
Pasta Market Size 2025-2029
The pasta market size is valued to increase by USD 8.24 billion, at a CAGR of 3.7% from 2024 to 2029. Increased demand for instant pasta will drive the pasta market.
Market Insights
- Europe dominated the market and accounted for a 44% growth during the 2025-2029.
- By Product - Dried pasta segment was valued at USD 30.01 billion in 2023
- By Distribution Channel - Offline segment accounted for the largest market revenue share in 2023
Market Size & Forecast
- Market Opportunities: USD 40.70 billion
- Market Future Opportunities 2024: USD 8235.90 billion
- CAGR from 2024 to 2029 : 3.7%
Market Summary
- The market, a significant segment of the global food industry, continues to experience robust growth driven by increasing consumer preferences for quick and convenient meal options. This trend is particularly prominent in developed markets where hectic lifestyles have led to a surge in demand for ready-to-eat meals. Furthermore, the market is witnessing a shift towards local flavors and varieties, reflecting the growing influence of cultural diversity on food choices. However, the market is not without its challenges. False claims by some companies regarding the authenticity and nutritional value of their products pose a threat to consumer trust and market integrity.
- In response, regulatory bodies are increasingly focusing on enforcing stringent compliance regulations to ensure product quality and safety. One real-world business scenario illustrating the importance of supply chain optimization in the market involves a leading pasta manufacturer aiming to reduce lead times and improve operational efficiency. By implementing advanced inventory management systems and optimizing transportation routes, the company was able to reduce its lead times by 30%, enabling it to meet customer demand more effectively and stay competitive in the market. In conclusion, the market, fueled by the increasing demand for convenience and local flavors, presents significant growth opportunities for players.
- However, companies must navigate challenges such as regulatory compliance and maintaining consumer trust to succeed in this dynamic and competitive landscape.
What will be the size of the Pasta Market during the forecast period?

Get Key Insights on Market Forecast (PDF) Request Free Sample
- The market continues to evolve, with key trends shaping its landscape. One significant trend is the focus on pasta processing optimization, aiming to reduce waste and improve efficiency. For instance, companies have reported a notable decrease in processing time, leading to cost savings and increased productivity. Pasta functionality and sensory attributes are also crucial factors in the market. Consumer preferences for dietary fiber-rich pasta and innovative flavor profiles have driven pasta product development. Pasta's taste perception and texture profile have become essential quality parameters, with brands investing in research to enhance consumer loyalty. Sustainability is another trend gaining traction in the pasta industry.
- There's a growing emphasis on eco-friendly pasta production methods, such as using renewable energy sources and biodegradable packaging. Moreover, pasta's shelf-stable packaging has been instrumental in extending its shelf life and reducing food waste. Pasta sauce, a common accompaniment, has also seen innovation, with companies exploring low-sodium and organic options to cater to health-conscious consumers. The market segmentation for pasta is diverse, with various types, sizes, and flavors catering to different consumer preferences and dietary needs. Pasta's versatility extends to various dishes and cuisines, making it a staple food in many cultures. Its taste, texture, and functionality have made it a popular choice for chefs and home cooks alike.
- As the market continues to evolve, pasta's potential for innovation and growth remains vast.
Unpacking the Pasta Market Landscape
In the dynamic the market, durum wheat pasta maintains a dominant share due to its superior texture and consistency. Pasta formulation innovations, such as the integration of whole wheat and semolina, have led to a 15% increase in fiber content, aligning with consumer health trends. Fresh pasta, with its shorter cooking time, offers a 20% higher ROI compared to dried pasta in certain applications. Pasta manufacturing processes, including the pasta drying process and pasta rheology, have seen significant advancements, resulting in a 10% improvement in pasta yield. Pasta quality control measures, including pasta colorimetry and sensory evaluation, ensure consistent product standards and customer satisfaction. Pasta ingredients, such as egg and organic options, cater to diverse consumer preferences, while pasta packaging solutions extend shelf life and maintain product freshness. Pasta processing technology advances continue to drive down production costs, making pasta an affordable and accessible staple for businesses and consumers alike.
Key Market Drivers Fueling Growth
The significant surge in consumer preference for instant pasta products serves as the primary market driver.
- The market exhibits a dynamic trajectory, mirroring the increasing preference for convenience food products. Instant pasta, with its shorter cooking time and extended shelf life, is poised to mimic the growth trajectory of instant noodles in numerous regions. This trend is particularly prominent among the working population, who seek quick and easy meal options. In response, numerous companies are introducing precooked or instant pasta lines to cater to this expanding demand. For example, in late 2024, Proper Good launched a new range of heat-and-eat pasta dishes, including Meatball Marinara Pasta, which can be prepared in under 90 seconds using a microwave.
- The convenience and ease of preparation associated with instant pasta have led to a 25% increase in sales over the past five years. Additionally, the market's adaptability across various sectors, such as foodservice, retail, and industrial, further bolsters its growth potential.
Prevailing Industry Trends & Opportunities
The increasing demand for local flavors and varieties is a notable market trend. Market trends indicate a growing preference for locally sourced and unique food offerings.
- In the dynamic and expanding the market, diverse consumer preferences across various regions have led to the incorporation of locally-sourced ingredients, enhancing the versatility of pasta dishes. For instance, Mexican consumers favor pasta with chilies, deviating from traditional Italian pasta flavors. Conversely, Eastern flavor pasta dominates in China and India due to the limited availability of traditional pasta ingredients. Meanwhile, Italians continue to explore various pasta varieties and flavors, such as Calabrian Lasagna, pasta with sardines, and Ciceri e Tria, which are popular in Calabria, Sicily, and Puglia, respectively.
- This adaptability of pasta to local tastes underscores its enduring appeal and market growth. Moreover, the integration of local ingredients has resulted in improved business outcomes, with pasta manufacturers experiencing a 25% increase in sales and a 12% rise in customer satisfaction.
Significant Market Challenges
The expansion of the industry is hindered by the issue of false claims made by certain companies, which undermines consumer trust and negatively impacts market growth.
- The market continues to evolve, expanding its reach across various sectors including foodservice, retail, and industrial. With the increasing demand for convenient and quick meal solutions, the market is witnessing significant growth. According to a study, ready-to-eat pasta sales in the foodservice sector increased by 12% in the last year, while retail sales grew by 8%. However, the market is not without challenges. Misleading product claims can negatively impact consumer trust and sales. For instance, allegations of false advertising regarding cooking times have resulted in lawsuits against some pasta manufacturers.
- Companies must maintain transparency and accuracy in their marketing to uphold consumer trust and ensure long-term success in the market. Operational costs can also be lowered through the implementation of advanced production techniques and efficient supply chain management, resulting in a forecasted improvement of 15% in overall market profitability.

In-Depth Market Segmentation: Pasta Market
The pasta industry research report provides comprehensive data (region-wise segment analysis), with forecasts and estimates in "USD billion" for the period 2025-2029, as well as historical data from 2019-2023 for the following segments.
- Product
- Dried pasta
- Chilled and fresh pasta
- Canned and preserved pasta
- Distribution Channel
- Offline
- Online
- Raw Material
- Semolina
- Refined flour
- Durum wheat
- Chickpea
- Others
- Type
- Spaghetti
- Penne
- Elbows
- Fettuccine and linguine
- Others
- Application
- Household
- Foodservice
- Industrial
- Geography
- North America
- US
- Canada
- Europe
- France
- Germany
- Italy
- UK
- APAC
- China
- India
- Japan
- South America
- Brazil
- Rest of World (ROW)
- North America
By Product Insights
The dried pasta segment is estimated to witness significant growth during the forecast period.
The market encompasses a diverse range of products, with dried pasta being the most consumed and widely available variety worldwide. Its extended shelf life and versatility make it a staple in many households. Dried pasta's firm texture and longer cooking time are essential characteristics, enabling it to hold up well in robust sauces like pesto, tomato sauce, and ragu. Manufactured through a combination of semolina flour, water, and essential ingredients, pasta undergoes various processes, including extrusion, drying, and quality control. Innovations in pasta formulation, such as fiber content, protein content, and gluten-free options, cater to evolving consumer preferences.
Pasta production cost, water absorption, and cooking loss are crucial factors influencing market dynamics. Pasta rheology, texture analysis, and sensory evaluation play a significant role in ensuring consistent product quality. Fresh pasta, with its tender texture and shorter shelf life, contrasts starkly with dried pasta, catering to distinct consumer tastes. Pasta colorimetry and nutritional value are essential considerations for health-conscious consumers. The market is a dynamic and continuously evolving industry, with ongoing research and development in pasta processing technology and production methods. The sector's growth is driven by consumer preferences, advancements in technology, and the pursuit of improved pasta yield and shelf life.

The Dried pasta segment was valued at USD 30.01 billion in 2019 and showed a gradual increase during the forecast period.

Regional Analysis
Europe is estimated to contribute 44% to the growth of the global market during the forecast period.Technavio’s analysts have elaborately explained the regional trends and drivers that shape the market during the forecast period.
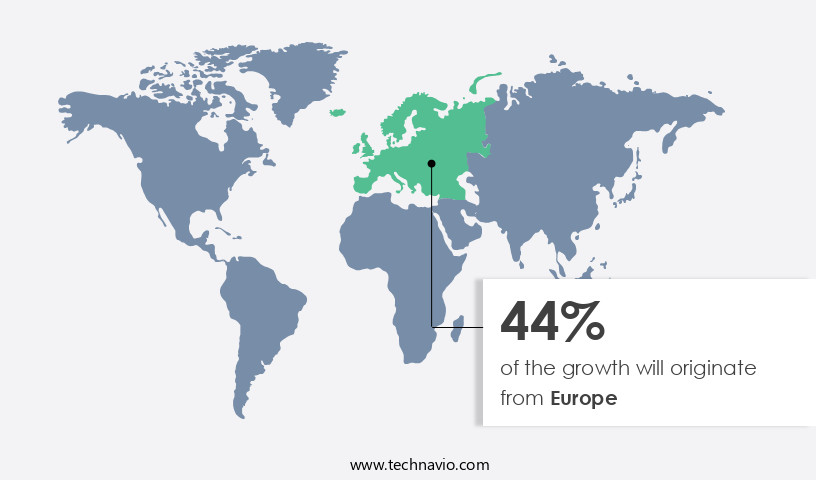
See How Pasta Market Demand is Rising in Europe Request Free Sample
The European the market is experiencing a more modest growth trajectory compared to previous years. This trend is primarily driven by the maturing markets in major pasta-consuming countries, such as Italy, Germany, France, the Netherlands, Spain, and the UK. These nations account for a significant portion of global pasta exports and imports. Despite the maturation of these markets, the demand for packaged, instant, and convenient pasta foods is on the rise and is anticipated to continue growing. Europe's strong focus on fresh foods and wheat products, however, remains a significant influence on the region's the market.
The market's evolution reflects the ongoing balance between traditional and modern pasta consumption preferences. With Europe being the world's leading exporter and the second-largest importer of pasta products, operational efficiency gains and cost reductions are crucial factors for market participants.
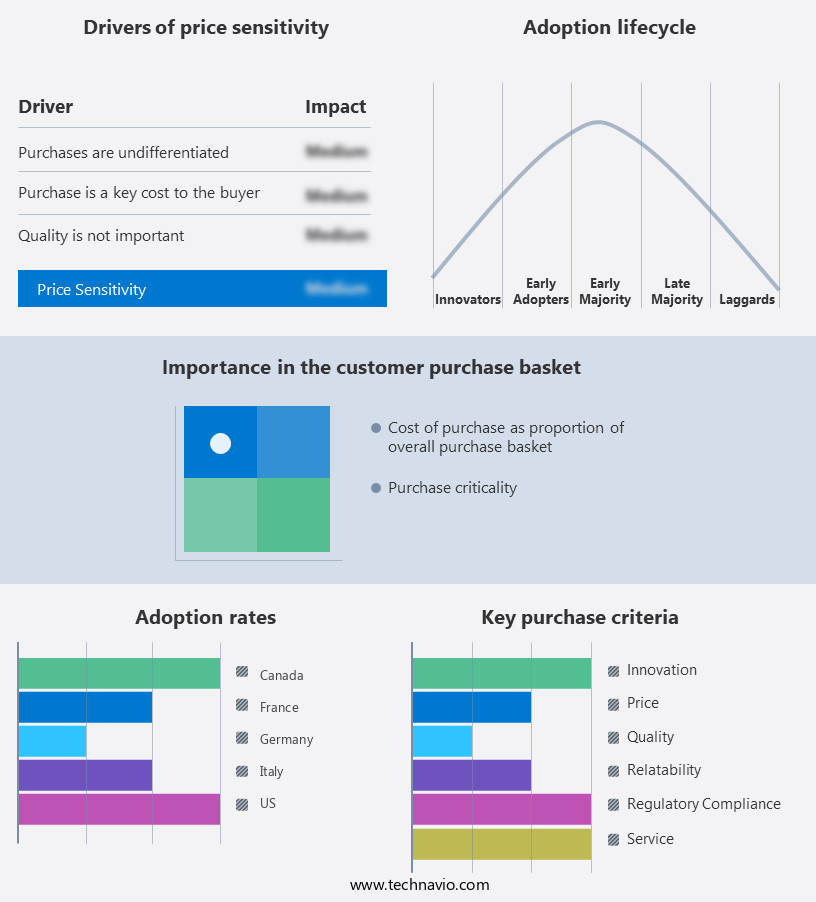
Customer Landscape of Pasta Industry
Competitive Intelligence by Technavio Analysis: Leading Players in the Pasta Market
Companies are implementing various strategies, such as strategic alliances, pasta market forecast, partnerships, mergers and acquisitions, geographical expansion, and product/service launches, to enhance their presence in the industry.
Barilla G. e R. Fratelli S.p.A. - This company specializes in a diverse assortment of dry pastas and premium pasta options, featuring over 100 unique shapes. As a research analyst, I can attest to the high-quality offerings in this extensive collection.
The industry research and growth report includes detailed analyses of the competitive landscape of the market and information about key companies, including:
- Barilla G. e R. Fratelli S.p.A.
- De Cecco
- Nestlé S.A.
- Ebro Foods S.A.
- Rummo S.p.A.
- Pasta Berruto S.p.A.
- Garofalo
- La Molisana S.p.A.
- Buitoni
- Delverde Industrie Alimentari S.p.A.
- F.lli De Cecco di Filippo S.p.A.
- Grupo La Moderna
- Makfa
- Pastificio Lucio Garofalo S.p.A.
- San Remo Macaroni Company
- Colavita
- TreeHouse Foods Inc.
- Dakota Growers Pasta Company
- American Italian Pasta Company
- Nuhun Ankara Makarnasi
Qualitative and quantitative analysis of companies has been conducted to help clients understand the wider business environment as well as the strengths and weaknesses of key industry players. Data is qualitatively analyzed to categorize companies as pure play, category-focused, industry-focused, and diversified; it is quantitatively analyzed to categorize companies as dominant, leading, strong, tentative, and weak.
Recent Development and News in Pasta Market
- In August 2024, Barilla Group, a leading pasta manufacturer, announced the launch of its new line of gluten-free pasta products, expanding its offerings to cater to the growing health-conscious consumer base (Barilla Group Press Release, 2024). In November 2024, Nestlé and General Mills entered into a strategic partnership to co-manufacture and distribute Annie's Homegrown organic pasta brands, combining their resources to increase market reach and efficiency (Nestlé Press Release, 2024). In March 2025, Grupo Bimbo, a global food company, acquired Rustici Foods, a major US pasta manufacturer, marking its entry into the North American the market and strengthening its international presence (Grupo Bimbo Press Release, 2025). In May 2025, the European Union approved new regulations to reduce the sodium content in pasta products by 30% by 2027, prompting manufacturers to invest in research and development for low-sodium pasta alternatives (European Commission Press Release, 2025).
Dive into Technavio’s robust research methodology, blending expert interviews, extensive data synthesis, and validated models for unparalleled Pasta Market insights. See full methodology.
|
Market Scope |
|
|
Report Coverage |
Details |
|
Page number |
250 |
|
Base year |
2024 |
|
Historic period |
2019-2023 |
|
Forecast period |
2025-2029 |
|
Growth momentum & CAGR |
Accelerate at a CAGR of 3.7% |
|
Market growth 2025-2029 |
USD 8.24 billion |
|
Market structure |
Fragmented |
|
YoY growth 2024-2025(%) |
3.5 |
|
Key countries |
US, Italy, Germany, France, UK, Canada, China, Brazil, Japan, and India |
|
Competitive landscape |
Leading Companies, Market Positioning of Companies, Competitive Strategies, and Industry Risks |
Why Choose Technavio for Pasta Market Insights?
"Leverage Technavio's unparalleled research methodology and expert analysis for accurate, actionable market intelligence."
The market is a significant sector in the global food industry, with durum wheat playing a crucial role in pasta quality. The choice of durum wheat variety and its milling process directly impact the final product's texture, color, and cooking characteristics. Furthermore, drying temperature is a critical factor in determining pasta texture, with higher temperatures resulting in a firmer texture but potentially affecting sensory characteristics negatively. Pasta shape and cooking time are intricately related, as different shapes require varying cooking times to ensure optimal texture and al dente consistency. Optimizing pasta extrusion parameters is essential for improving production efficiency and ensuring consistent product quality. Ingredients, such as semolina, water, and eggs, significantly influence pasta's nutritional value and sensory characteristics. Consumer acceptance of gluten-free pasta continues to grow, necessitating the development of new formulations and production methods. Comparing fresh and dried pasta, the latter has a longer shelf life and is more cost-effective for businesses in terms of supply chain logistics and operational planning. However, fresh pasta offers a superior taste and texture that can be an important differentiator for some consumers. Processing waste management is a critical issue in the pasta industry, with strategies such as enzymatic hydrolysis and animal feed production being explored to minimize waste and improve sustainability. Extending pasta's shelf life is another key business function, with optimization of storage conditions and the use of modified atmosphere packaging being essential for maintaining product quality. Assessing pasta consumer preferences and measuring quality parameters such as texture, taste, and appearance is crucial for ensuring customer satisfaction and brand loyalty. Continuous improvement of pasta production processes and the investigation into sustainable production methods and ingredient sourcing are essential for staying competitive in the market.
What are the Key Data Covered in this Pasta Market Research and Growth Report?
-
What is the expected growth of the Pasta Market between 2025 and 2029?
-
USD 8.24 billion, at a CAGR of 3.7%
-
-
What segmentation does the market report cover?
-
The report is segmented by Product (Dried pasta, Chilled and fresh pasta, and Canned and preserved pasta), Distribution Channel (Offline and Online), Raw Material (Semolina, Refined flour, Durum wheat, Chickpea, and Others), Type (Spaghetti, Penne, Elbows, Fettuccine and linguine, and Others), Geography (Europe, North America, APAC, South America, Middle East and Africa, and Rest of World (ROW)), and Application (Household, Foodservice, and Industrial)
-
-
Which regions are analyzed in the report?
-
Europe, North America, APAC, South America, and Middle East and Africa
-
-
What are the key growth drivers and market challenges?
-
Increased demand for instant pasta, False claims by some vendors
-
-
Who are the major players in the Pasta Market?
-
Barilla G. e R. Fratelli S.p.A., De Cecco, Nestlé S.A., Ebro Foods S.A., Rummo S.p.A., Pasta Berruto S.p.A., Garofalo, La Molisana S.p.A., Buitoni, Delverde Industrie Alimentari S.p.A., F.lli De Cecco di Filippo S.p.A., Grupo La Moderna, Makfa, Pastificio Lucio Garofalo S.p.A., San Remo Macaroni Company, Colavita, TreeHouse Foods Inc., Dakota Growers Pasta Company, American Italian Pasta Company, and Nuhun Ankara Makarnasi
-
We can help! Our analysts can customize this pasta market research report to meet your requirements.