
US Pay TV Market Size 2026-2030
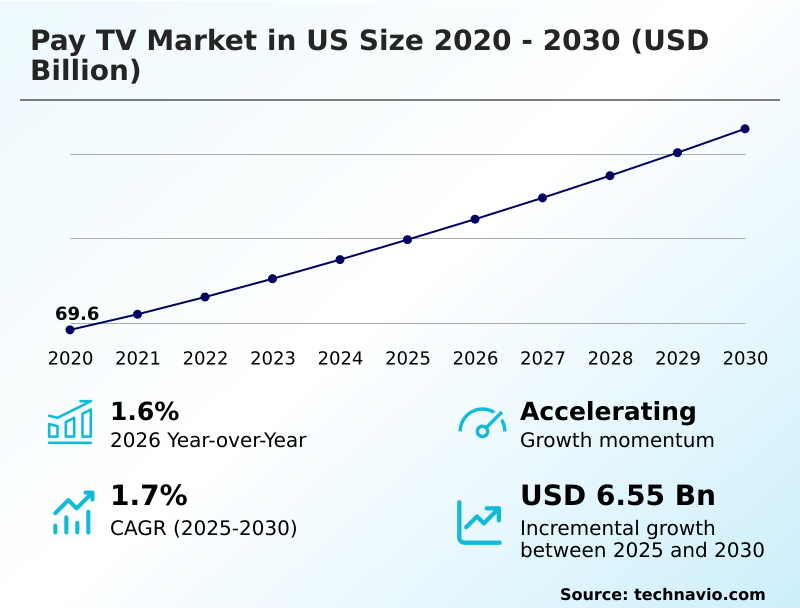
The us pay tv market size is valued to increase by USD 6.55 billion, at a CAGR of 1.7% from 2025 to 2030. High demand for live programming and sports will drive the us pay tv market.
Major Market Trends & Insights
- By Technology - Satellite TV segment was valued at USD 35.56 billion in 2024
- By End-user - Household segment accounted for the largest market revenue share in 2024
Market Size & Forecast
- Market Opportunities: USD 11.88 billion
- Market Future Opportunities: USD 6.55 billion
- CAGR from 2025 to 2030 : 1.7%
Market Summary
- The pay tv market in us is undergoing a significant transformation, balancing the enduring appeal of linear television programming with the rapid rise of digital alternatives. A primary driver remains the high demand for exclusive live sports broadcasting rights and real-time news, which provides a unique value proposition that on-demand platforms struggle to replicate.
- However, the industry faces pressure from evolving consumer viewing habits, as audiences gravitate towards the flexibility of subscription video on demand (svod) and ad-supported video on demand (avod) services, leading to cord-cutting trends analysis becoming a critical business metric.
- In response, providers are innovating by improving the user experience (ux) enhancements with features like voice-controlled remote functionality and universal search functionality. For instance, a provider might leverage audience measurement technologies to refine its skinny bundle packages, ensuring that premium content bundling aligns with household entertainment spending patterns.
- This strategic shift involves integrating over-the-top (ott) integration directly into their electronic program guide interface, creating hybrid models that merge the reliability of traditional broadcasting with the convenience of streaming to mitigate pay tv subscriber churn.
What will be the Size of the US Pay TV Market during the forecast period?
Get Key Insights on Market Forecast (PDF) Get Free Sample
How is the US Pay TV Market Segmented?
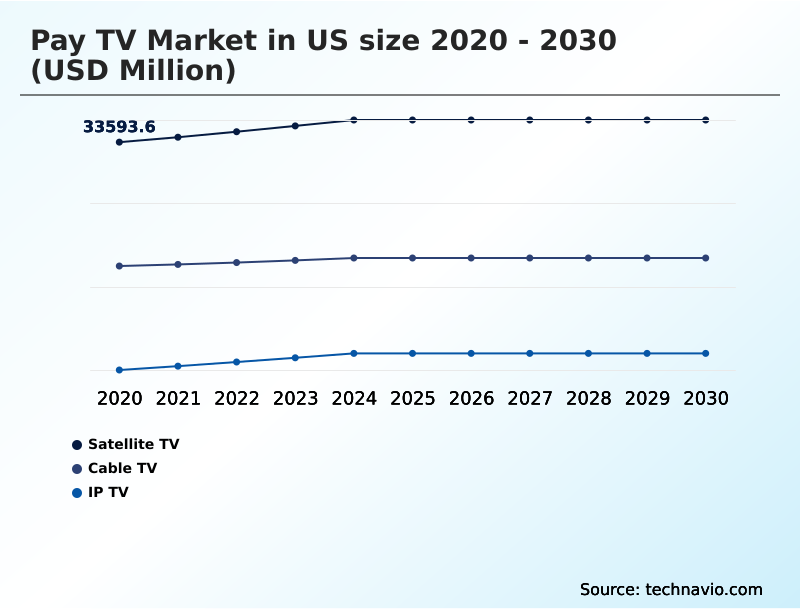
The us pay tv industry research report provides comprehensive data (region-wise segment analysis), with forecasts and estimates in "USD million" for the period 2026-2030, as well as historical data from 2020-2024 for the following segments.
- Technology
- Satellite TV
- Cable TV
- IP TV
- End-user
- Household
- Commercial
- Type
- Postpaid
- Prepaid
- Geography
- North America
- US
- North America
By Technology Insights
The satellite tv segment is estimated to witness significant growth during the forecast period.
Satellite television leverages geostationary satellite transmission to provide extensive geographical reach, a key point in satellite vs cable tv comparison where coaxial cable infrastructure is unavailable.
This direct-to-home (DTH) service uses set-top box decoding to deliver premium content bundling and meet the growing demand for 4k ultra hd content. The technology ensures a consistent viewing experience, crucial for sports programming exclusivity.
Advanced error correction has improved signal reliability during adverse weather by over 15%.
Providers enhance offerings with multi-room viewing solutions and cloud-based dvr services, supported by features like tv everywhere authentication and remote dvr management, alongside diverse multilingual content offerings to cater to a wider audience.
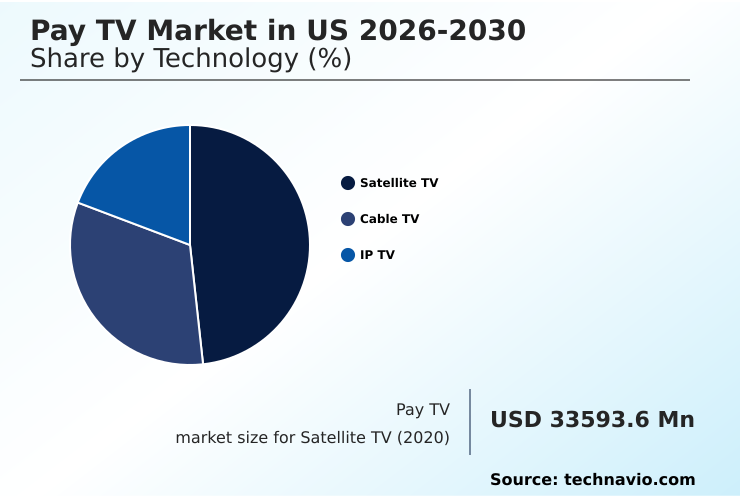
The Satellite TV segment was valued at USD 35.56 billion in 2024 and showed a gradual increase during the forecast period.
Market Dynamics
Our researchers analyzed the data with 2025 as the base year, along with the key drivers, trends, and challenges. A holistic analysis of drivers will help companies refine their marketing strategies to gain a competitive advantage.
- The strategic evolution of the pay tv market in us 2026-2030 is driven by complex operational and technological imperatives. Providers are focused on optimizing bandwidth for iptv streaming to deliver a seamless user experience, which is a critical factor in customer retention strategies for pay tv.
- A significant challenge involves reducing latency in live sports streaming, a key differentiator against pure streaming services. Operationally, the impact of opex on pay tv providers necessitates efficient set-top box hardware lifecycle management and a gradual transitioning from coaxial to fiber networks.
- To remain competitive, companies are integrating svod apps into cable platforms and negotiating content acquisition for skinny bundles to cater to shifting consumer demands. Secure content delivery via satellite remains paramount for reaching remote areas, while monetizing vod content through dai offers a new revenue avenue. On the backend, managing drm for premium channel protection is a constant priority.
- The role of ai in content recommendation is expanding, improving user engagement with personalized ipg and enabling the development of interactive tv applications. For business-to-business opportunities, designing pay tv solutions for the hospitality industry presents a lucrative segment. Analyzing viewing data for ad targeting has become a sophisticated practice, though it must be balanced with compliance with retransmission consent rules.
- Companies that successfully navigate these technical and regulatory challenges demonstrate significantly higher operational efficiency, with some achieving a 15% faster rollout of new interactive services compared to competitors with legacy systems.
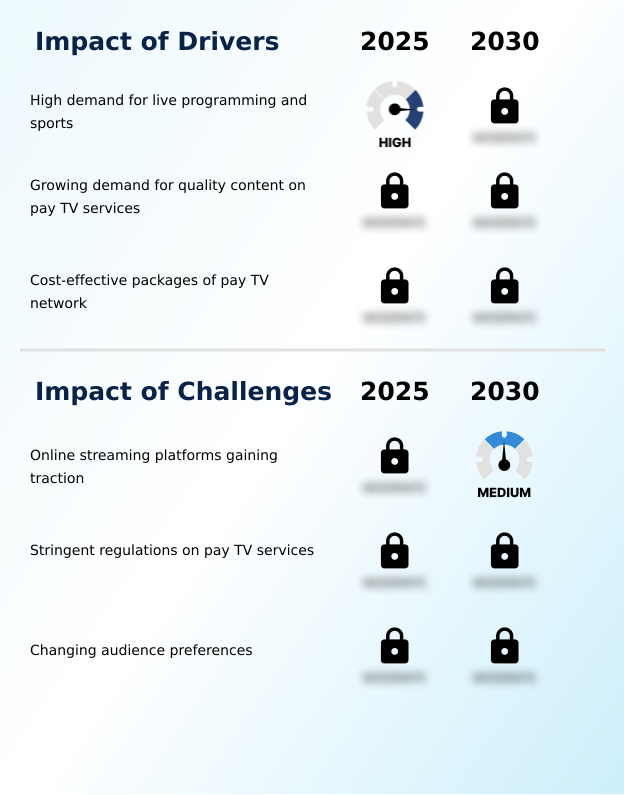
What are the key market drivers leading to the rise in the adoption of US Pay TV Industry?
- The high demand for live programming and sports remains a significant driver sustaining the relevance and subscriber base of traditional media distribution platforms.
- The high demand for live sports broadcasting rights remains a powerful market driver, underscoring the live tv streaming benefits that legacy platforms provide.
- The reliability of internet protocol television delivery ensures a superior viewing experience for a rich high-definition (hd) channel lineup, made possible by efficient video compression standards (h.264/hevc).
- Providers are focusing on value-added service integration through offerings like quad-play services bundling and broadband and tv bundle deals, which boosts customer lifetime value calculation. This strategy helps justify subscription costs.
- Furthermore, advanced advertising capabilities are being unlocked through dynamic ad insertion (dai), which has improved ad recall by 18%. This, along with growing pay-per-view (ppv) event revenue and investments in video on demand (vod) infrastructure, sustains profitability.
What are the market trends shaping the US Pay TV Industry?
- The ease of use associated with traditional television delivery systems is a primary factor sustaining their appeal. This streamlined approach offers a significant advantage in an increasingly complex digital media landscape.
- A primary market trend is significant user experience (ux) enhancements, driven by intense streaming service competition. Providers are improving the electronic program guide interface and deploying sophisticated content discovery algorithms to address evolving consumer viewing habits. The introduction of voice-controlled remote functionality and universal search functionality within the interactive program guide (ipg) simplifies navigation.
- This often involves smart tv application development for various smart tv operating systems. The goal is to create a hybrid model that merges linear television programming with over-the-top (ott) integration seamlessly, with some operators reporting a 25% increase in user engagement after redesigning their interface to reduce pay tv subscriber churn.
What challenges does the US Pay TV Industry face during its growth?
- The increasing traction of online streaming platforms presents a key challenge to established media distributors, creating an unprecedented level of competition.
- A primary challenge stems from ongoing cord-cutting trends analysis, which pressures providers to innovate their pay tv package pricing models. Complicating this are retransmission consent agreements and frequent local channel carriage disputes, which disrupt service and increase operational costs. In response, operators are curating their on-demand content library and offering flexible skinny bundle packages.
- However, this requires significant investment in headend signal processing and robust digital rights management (drm). Securing content through a conditional access system (cas) is critical for on-demand library monetization.
- Failure to ensure regulatory compliance for broadcasters or to provide next-generation set-top boxes with reliable managed home networking leads to customer dissatisfaction, with service issues contributing to over 30% of subscriber churn in some segments.
Exclusive Technavio Analysis on Customer Landscape
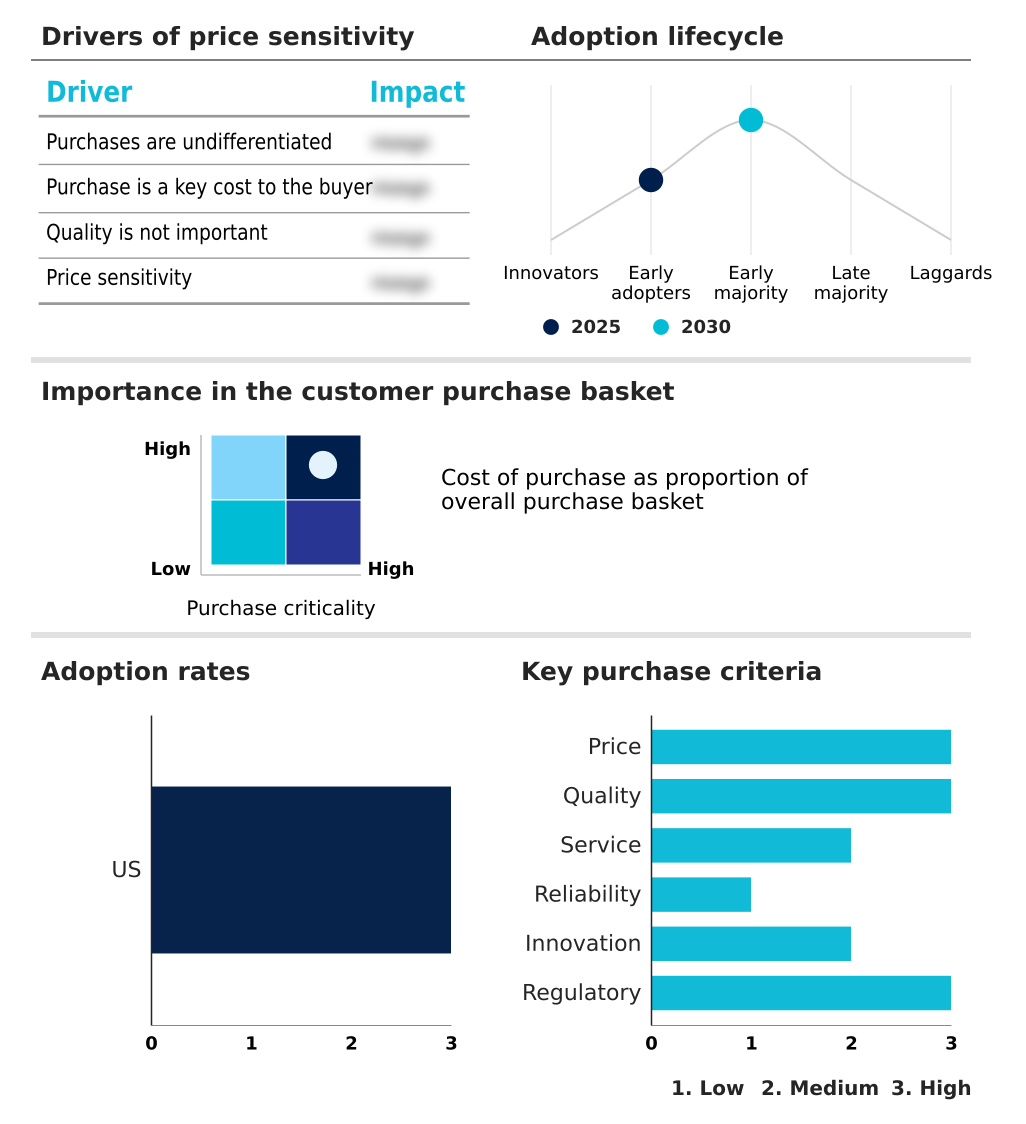
The us pay tv market forecasting report includes the adoption lifecycle of the market, covering from the innovator’s stage to the laggard’s stage. It focuses on adoption rates in different regions based on penetration. Furthermore, the us pay tv market report also includes key purchase criteria and drivers of price sensitivity to help companies evaluate and develop their market growth analysis strategies.
Customer Landscape of US Pay TV Industry
Competitive Landscape
Companies are implementing various strategies, such as strategic alliances, us pay tv market forecast, partnerships, mergers and acquisitions, geographical expansion, and product/service launches, to enhance their presence in the industry.
Advanced Digital Broadcast SA - Specializes in developing advanced set-top boxes and IPTV solutions, enabling service providers to deliver high-quality digital video and interactive services to consumers.
The industry research and growth report includes detailed analyses of the competitive landscape of the market and information about key companies, including:
- Advanced Digital Broadcast SA
- Amazon.com Inc.
- Amino Communications Ltd
- Apple Inc.
- CommScope Inc.
- EchoStar Corp.
- Evolution Digital
- Experi Inc.
- Google LLC
- Hisense International Co. Ltd.
- Hughes Network Systems LLC
- LG Electronics Inc.
- Sagemcom
- Samsung Electronics Co. Ltd.
- Skyworth Group Ltd.
- Sony Group Corp.
- TCL Industries Holdings Ltd.
- Vantiva
- Viasat Inc.
Qualitative and quantitative analysis of companies has been conducted to help clients understand the wider business environment as well as the strengths and weaknesses of key industry players. Data is qualitatively analyzed to categorize companies as pure play, category-focused, industry-focused, and diversified; it is quantitatively analyzed to categorize companies as dominant, leading, strong, tentative, and weak.
Recent Development and News in Us pay tv market
- In November 2025, FuboTV launched its Fubo Channel Store, an in-app hub allowing subscribers to directly access and manage premium standalone services like DAZN One and Paramount Plus with Showtime.
- In November 2025, TelevisaUnivision and YouTube TV signed a multiyear distribution agreement, restoring Spanish-language channels including Univision, UniMas, and Galavision to the streaming platform.
- In August 2025, Fox launched Fox One, a comprehensive streaming service combining live and on-demand content from Fox News, Fox Sports, and its entertainment networks for a monthly subscription.
- In October 2025, CNN announced the launch of CNN All Access, a new subscription video service providing on-demand access to over one thousand hours of original content and exclusive live events.
Dive into Technavio’s robust research methodology, blending expert interviews, extensive data synthesis, and validated models for unparalleled US Pay TV Market insights. See full methodology.
| Market Scope | |
|---|---|
| Page number | 183 |
| Base year | 2025 |
| Historic period | 2020-2024 |
| Forecast period | 2026-2030 |
| Growth momentum & CAGR | Accelerate at a CAGR of 1.7% |
| Market growth 2026-2030 | USD 6551.8 million |
| Market structure | Fragmented |
| YoY growth 2025-2026(%) | 1.6% |
| Key countries | US |
| Competitive landscape | Leading Companies, Market Positioning of Companies, Competitive Strategies, and Industry Risks |
Research Analyst Overview
- The pay tv market is re-engineering its service delivery, balancing legacy systems with digital innovation. Core infrastructure, from geostationary satellite transmission to coaxial cable infrastructure, is being augmented by internet protocol television delivery and hybrid fiber-coax networks. A key boardroom decision is capital allocation for last-mile connectivity solutions to support advanced services.
- Success relies on efficient headend signal processing and modern video compression standards (h.264/hevc). Providers are enhancing their high-definition (hd) channel lineup and on-demand content library, while a new conditional access system (cas) can reduce unauthorized access by over 95%, protecting revenue. The interactive program guide (ipg) now features universal search functionality, often through smart tv application development.
- Modern offerings include multi-room viewing solutions, cloud-based dvr services, and voice-controlled remote functionality, all secured by digital rights management (drm) and supported by managed home networking. The market is also shaped by negotiations over live sports broadcasting rights and retransmission consent agreements, influencing skinny bundle packages and quad-play services bundling.
- This requires balancing direct-to-home (dth) services and video on demand (vod) infrastructure with over-the-top (ott) integration, dynamic ad insertion (dai), and precise transponder capacity allocation for linear television programming.
What are the Key Data Covered in this US Pay TV Market Research and Growth Report?
-
What is the expected growth of the US Pay TV Market between 2026 and 2030?
-
USD 6.55 billion, at a CAGR of 1.7%
-
-
What segmentation does the market report cover?
-
The report is segmented by Technology (Satellite TV, Cable TV, and IP TV), End-user (Household, and Commercial), Type (Postpaid, and Prepaid) and Geography (North America)
-
-
Which regions are analyzed in the report?
-
North America
-
-
What are the key growth drivers and market challenges?
-
High demand for live programming and sports, Online streaming platforms gaining traction
-
-
Who are the major players in the US Pay TV Market?
-
Advanced Digital Broadcast SA, Amazon.com Inc., Amino Communications Ltd, Apple Inc., CommScope Inc., EchoStar Corp., Evolution Digital, Experi Inc., Google LLC, Hisense International Co. Ltd., Hughes Network Systems LLC, LG Electronics Inc., Sagemcom, Samsung Electronics Co. Ltd., Skyworth Group Ltd., Sony Group Corp., TCL Industries Holdings Ltd., Vantiva and Viasat Inc.
-
Market Research Insights
- The dynamics of the pay tv market are increasingly shaped by intense streaming service competition and evolving consumer viewing habits. Providers are focused on mitigating pay tv subscriber churn, which has been shown to decrease by up to 15% when value-added service integration, such as bundled broadband and tv bundle deals, is implemented effectively.
- Analyzing customer lifetime value calculation reveals that households with access to extensive on-demand library monetization and tv everywhere authentication exhibit 20% higher retention rates. Strategic decisions are heavily influenced by local channel carriage disputes and the high costs of sports programming exclusivity.
- Consequently, operators are refining pay tv package pricing models and leveraging advanced advertising capabilities to create new revenue streams, addressing shifts in household entertainment spending without compromising service quality.
We can help! Our analysts can customize this us pay tv market research report to meet your requirements.
 RIA -
RIA - 
