Payroll Outsourcing Services Market Analysis, Size, and Forecast 2026-2030: North America (US, Canada, and Mexico), Europe (UK, Germany, and France), APAC (China, India, and Japan), South America (Brazil and Argentina), Middle East and Africa (UAE, Saudi Arabia, and South Africa), and Rest of World (ROW)

Payroll Outsourcing Services Market Analysis, Size, and Forecast 2026-2030:
North America (US, Canada, and Mexico), Europe (UK, Germany, and France), APAC (China, India, and Japan), South America (Brazil and Argentina), Middle East and Africa (UAE, Saudi Arabia, and South Africa), and Rest of World (ROW)

Published: Mar 2026 288 Pages SKU: IRTNTR43325

Market Overview at a Glance

$6.94 B
Market Opportunity
5.1%
CAGR 2025 - 2030
45%
North America Growth
$15.85 B
Hybrid segment 2024

Payroll Outsourcing Services Market Size 2026-2030

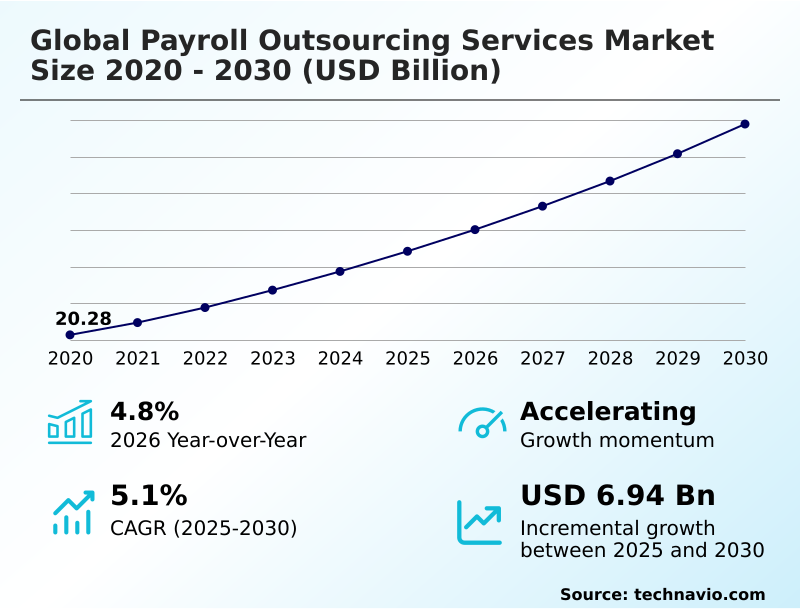
The payroll outsourcing services market size is valued to increase by USD 6.94 billion, at a CAGR of 5.1% from 2025 to 2030. Growing demand for expert-led payroll compliance management will drive the payroll outsourcing services market.

Major Market Trends & Insights

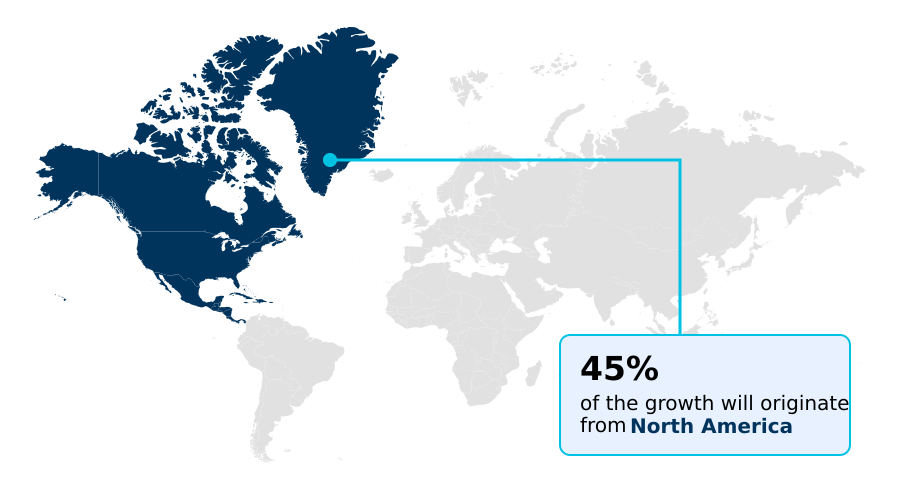
  • North America dominated the market and accounted for a 45% growth during the forecast period.
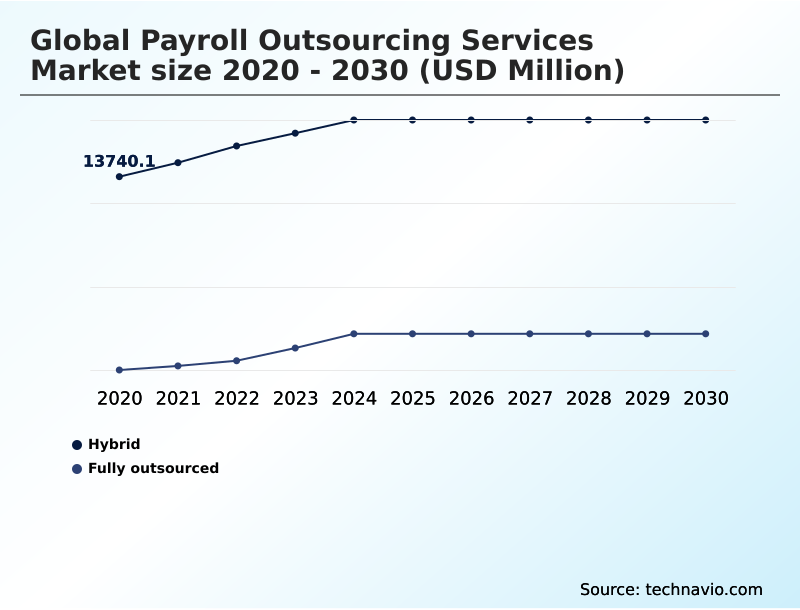
  • By Product - Hybrid segment was valued at USD 15.85 billion in 2024
  • By Type - Mid-market segment accounted for the largest market revenue share in 2024

Market Size & Forecast

  • Market Opportunities: USD 11.50 billion
  • Market Future Opportunities: USD 6.94 billion
  • CAGR from 2025 to 2030 : 5.1%

Market Summary

  • The payroll outsourcing services market is undergoing a significant transformation, driven by the convergence of technological innovation and evolving business needs. Organizations are increasingly moving away from treating payroll as a purely administrative task and toward viewing it as a strategic function that requires specialized expertise and advanced tools.
  • This shift is propelled by the growing complexity of global compliance, the rise of distributed and remote workforces, and the demand for data-driven insights into labor costs. For example, a multinational corporation expanding into new regions can leverage outsourced services to navigate disparate tax laws and labor regulations, thereby mitigating compliance risks and ensuring a consistent employee experience.
  • The market is characterized by a strong emphasis on cloud-based platforms that offer integrated human capital management capabilities, automation, and enhanced security. As businesses prioritize operational efficiency and strategic agility, outsourcing payroll becomes a critical enabler, allowing internal teams to focus on core growth initiatives rather than administrative burdens.
  • This trend underscores the market's role in supporting modern, global business operations.

What will be the Size of the Payroll Outsourcing Services Market during the forecast period?

Get Key Insights on Market Forecast (PDF) Request Free Sample

How is the Payroll Outsourcing Services Market Segmented?

The payroll outsourcing services industry research report provides comprehensive data (region-wise segment analysis), with forecasts and estimates in "USD million" for the period 2026-2030, as well as historical data from 2020-2024 for the following segments.

  • Product
    • Hybrid
    • Fully outsourced
  • Type
    • Mid-market
    • National
    • Multinational
  • End-user
    • Large enterprises
    • SMEs
  • Geography
    • North America
      • US
      • Canada
      • Mexico
    • Europe
      • UK
      • Germany
      • France
    • APAC
      • China
      • India
      • Japan
    • South America
      • Brazil
      • Argentina
    • Middle East and Africa
      • UAE
      • Saudi Arabia
      • South Africa
    • Rest of World (ROW)

By Product Insights

The hybrid segment is estimated to witness significant growth during the forecast period.

A hybrid approach to payroll services offers a strategic balance, allowing organizations to retain control over core processes while delegating complex functions.

This model is ideal for enterprises with existing HR teams that need specialized support for multi-country compliance or year-end tax reporting.

By integrating external compensation planning tools and automated compliance updates with internal systems via bi-directional data sync, businesses achieve significant payroll process optimization.

This blended strategy provides key payroll outsourcing benefits without the full commitment of end-to-end payroll outsourcing, optimizing the cost of in-house payroll vs outsourcing.

It also facilitates modern functionalities like earned wage access (ewa) and efficient off-cycle payment processing, ensuring a robust and flexible system built on a unified employee data record.

Request Free Sample

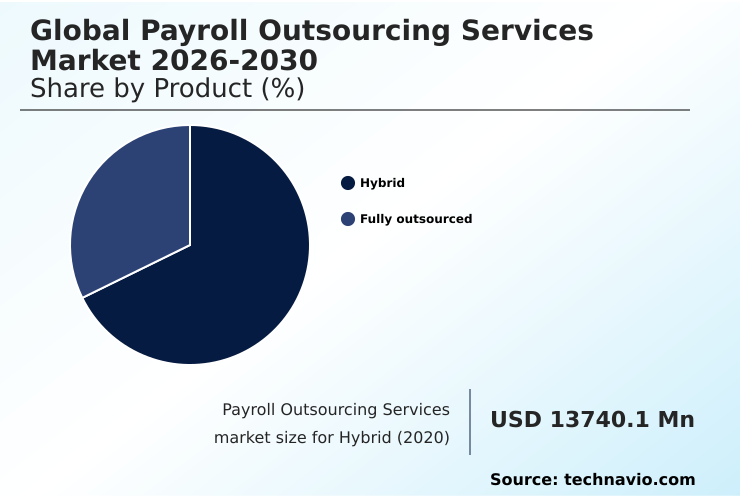
The Hybrid segment was valued at USD 15.85 billion in 2024 and showed a gradual increase during the forecast period.

Request Free Sample

Regional Analysis

North America is estimated to contribute 45% to the growth of the global market during the forecast period.Technavio’s analysts have elaborately explained the regional trends and drivers that shape the market during the forecast period.

See How Payroll Outsourcing Services Market Demand is Rising in North America Request Free Sample

The geographic landscape of the market is characterized by varying maturity levels, with North America demonstrating high adoption of integrated systems while APAC presents significant growth opportunities in managing payroll in emerging markets.

Global payroll consolidation onto a unified payroll platform is a key objective for multinational corporations, with leading providers reporting a 35% reduction in reducing payroll processing time for clients who centralize outsourcing payroll functions.

In Europe, demand is high for platforms that offer strong benefits administration integration and payroll tax compliance services. Across all regions, the adoption of employee self-service (ess) portals and time and attendance systems is increasing.

Advanced payroll data analytics and sophisticated currency exchange management are becoming key differentiators, enabling firms to achieve payroll process standardization and a 15% improvement in forecast accuracy for global labor costs.

Market Dynamics

Our researchers analyzed the data with 2025 as the base year, along with the key drivers, trends, and challenges. A holistic analysis of drivers will help companies refine their marketing strategies to gain a competitive advantage.

  • As organizations navigate the complexities of global expansion, understanding the technology trends in the global payroll outsourcing services market 2026-2030 is crucial for strategic planning. The decision-making process involves comparing hybrid vs fully outsourced payroll models to determine the best fit for corporate culture and operational needs.
  • For many, the benefits of a unified global payroll platform are compelling, particularly when dealing with the challenges of multi-country payroll processing and the impact of remote work on payroll administration. Evaluating the roi of payroll outsourcing services is a key step, where businesses often find that specialized providers deliver efficiencies that are difficult to replicate in-house.
  • A critical part of this evaluation is learning how to choose a global payroll provider that offers robust data security measures for outsourced payroll services and a clear framework for navigating cross-border tax withholding complexities. Implementing employee self-service in payroll systems is no longer a luxury but a necessity for enhancing employee experience.
  • Best practices for global payroll management now include using ai for payroll anomaly detection and fraud prevention and integrating payroll with erp and hcm systems to create a single source of truth. Automating statutory reporting in payroll processing streamlines compliance, while payroll analytics for strategic workforce planning provides actionable insights.
  • The role of employer of record in global expansion has become pivotal for managing payroll compliance for a distributed workforce, especially in ensuring gdpr compliance in global payroll operations and streamlining year-end payroll reporting processes. Adopting these advanced strategies allows for optimizing payroll for multinational companies, leading to compliance frameworks that are twice as effective as non-integrated approaches.

What are the key market drivers leading to the rise in the adoption of Payroll Outsourcing Services Industry?

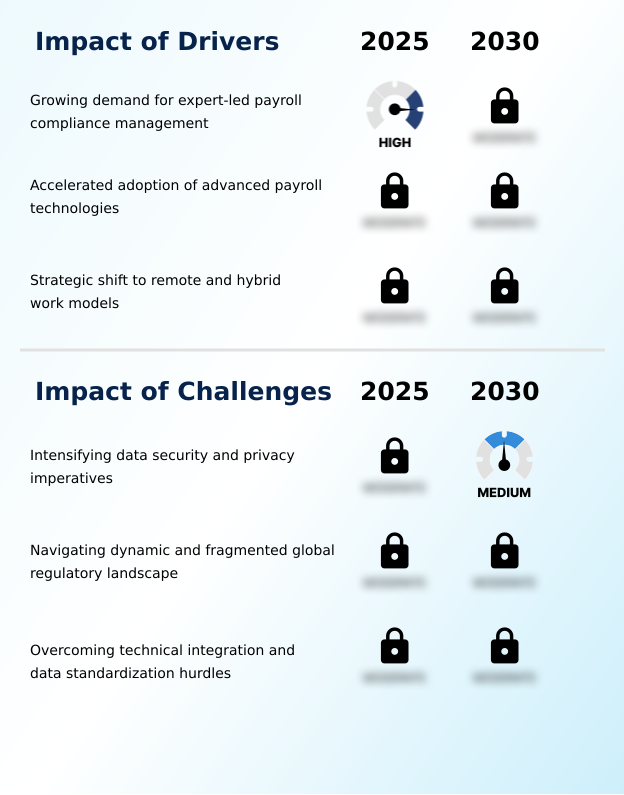
  • The growing demand for expert-led payroll compliance management is a key driver, as businesses navigate increasingly complex global regulatory landscapes.

  • The growing complexity of multi-jurisdictional tax laws is a primary driver for market adoption, compelling businesses to seek expert payroll compliance risk mitigation.
  • For outsourced payroll for smes and large corporations alike, managing payroll for remote teams has become a significant challenge, making robust workforce management solutions essential. A centralized global payroll strategy, supported by international payroll solutions, delivers consistency and control.
  • Providers offering employer of record (eor) services and advanced cross-border payment processing have become critical partners, with clients reporting a 40% reduction in compliance-related issues.
  • Effective global payroll management systems that deliver payroll processing automation are key to improving payroll accuracy and navigating the intricacies of multi-country compliance, making outsourcing a strategic imperative rather than just a cost-saving measure.

What are the market trends shaping the Payroll Outsourcing Services Industry?

  • Hyper-automation and the integration of artificial intelligence are redefining payroll platforms. This evolution creates intelligent ecosystems for predictive analysis and optimized workflows.

  • The evolution of the payroll technology stack is driving market momentum, with a distinct shift toward intelligent automation and integrated platforms. Cloud-based payroll platforms are now standard, enabling scaling payroll for global expansion and enhancing employee payroll experience through superior accessibility.
  • The integration of robotic process automation (rpa) in payroll has automated routine tasks, leading to a 30% reduction in manual data entry errors. Furthermore, advancements in hr and payroll integration support real-time payroll reporting and sophisticated payroll reporting and analytics.
  • AI-powered tools for payroll anomaly detection and predictive payroll forecasting improve financial oversight, while secure data transmission protocols and the use of a digital payroll ledger ensure data integrity and compliance, resulting in a 25% improvement in accurate payroll calculation across distributed workforces.

What challenges does the Payroll Outsourcing Services Industry face during its growth?

  • Intensifying data security and privacy imperatives present a key challenge, demanding robust protection for sensitive financial and personal information.

  • Navigating the landscape of challenges in multinational payroll requires a robust payroll compliance framework capable of addressing fragmented regulations. A primary hurdle is payroll system integration with existing human capital management (hcm) integration environments, where mismatched data standards can increase manual work by up to 20%.
  • Ensuring stringent payroll data security standards and secure payroll data handling is paramount, especially with mandates like general data protection regulation (gdpr) in payroll. Furthermore, achieving accurate tax withholding automation and correct statutory deduction calculation across borders remains difficult.
  • This complexity makes multi-country payroll provider evaluation a critical process for businesses aiming to implement automated payroll workflows and ensure compliance with regional rules such as wage protection system (wps) compliance.

Exclusive Technavio Analysis on Customer Landscape

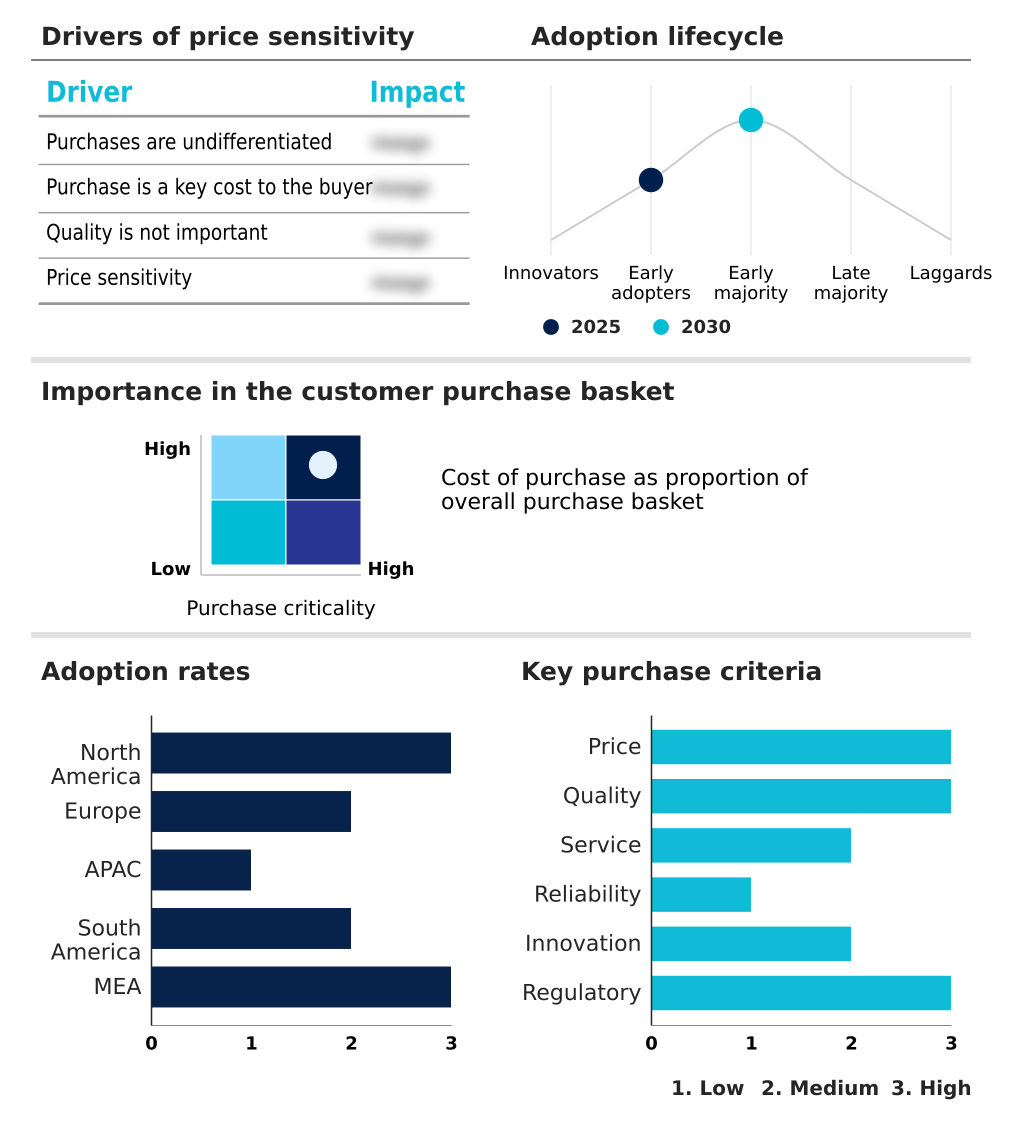
The payroll outsourcing services market forecasting report includes the adoption lifecycle of the market, covering from the innovator’s stage to the laggard’s stage. It focuses on adoption rates in different regions based on penetration. Furthermore, the payroll outsourcing services market report also includes key purchase criteria and drivers of price sensitivity to help companies evaluate and develop their market growth analysis strategies.

Customer Landscape of Payroll Outsourcing Services Industry

Competitive Landscape

Companies are implementing various strategies, such as strategic alliances, payroll outsourcing services market forecast, partnerships, mergers and acquisitions, geographical expansion, and product/service launches, to enhance their presence in the industry.

Automatic Data Processing Inc. - Specialized payroll outsourcing services, including compliance management and tax filing, enable organizations to streamline complex workforce payment and reporting functions.

The industry research and growth report includes detailed analyses of the competitive landscape of the market and information about key companies, including:

  • Automatic Data Processing Inc.
  • BDO International Ltd.
  • BIPO Service
  • Block Inc.
  • CloudPay Inc.
  • Deel Inc.
  • Globalization Partners LLC
  • IRIS Software Group Ltd.
  • Mercans LLC
  • Neeyamo Enterprise Solutions
  • Oyster HR Inc.
  • Papaya Global Ltd.
  • Paychex Inc.
  • Paylocity Holding Corp.
  • Ramco Systems Ltd.
  • Remote Technology Inc.
  • Rippling People Center Inc.
  • Safeguard World International
  • SD Worx Group NV
  • TMF Group BV

Qualitative and quantitative analysis of companies has been conducted to help clients understand the wider business environment as well as the strengths and weaknesses of key industry players. Data is qualitatively analyzed to categorize companies as pure play, category-focused, industry-focused, and diversified; it is quantitatively analyzed to categorize companies as dominant, leading, strong, tentative, and weak.

Recent Development and News in Payroll outsourcing services market

  • In August 2025, Safeguard Global secured a landmark agreement with a major international retail conglomerate to manage its entire payroll and compliance framework across 45 countries, unifying its fragmented systems onto a single platform.
  • In February 2025, Deel announced its acquisition of a prominent regional payroll provider in Southeast Asia, a strategic move to strengthen its footprint and compliance capabilities across the fast-growing APAC region.
  • In May 2025, Ceridian announced a strategic partnership with Microsoft to integrate its Dayforce platform directly within Microsoft Teams, embedding HR and payroll functions into daily workflows to enhance enterprise efficiency.
  • In April 2025, Amazon Web Services issued a mandatory directive requiring all partners handling sensitive financial data, including many cloud-based payroll platforms, to implement advanced quantum-resistant encryption algorithms to defend against future security threats.

Dive into Technavio’s robust research methodology, blending expert interviews, extensive data synthesis, and validated models for unparalleled Payroll Outsourcing Services Market insights. See full methodology.

Market Scope
Page number 288
Base year 2025
Historic period 2020-2024
Forecast period 2026-2030
Growth momentum & CAGR Accelerate at a CAGR of 5.1%
Market growth 2026-2030 USD 6940.3 million
Market structure Fragmented
YoY growth 2025-2026(%) 4.8%
Key countries US, Canada, Mexico, UK, Germany, France, Italy, Spain, Poland, China, India, Japan, South Korea, Singapore, Indonesia, Brazil, Argentina, Chile, UAE, Saudi Arabia, South Africa, Egypt and Israel
Competitive landscape Leading Companies, Market Positioning of Companies, Competitive Strategies, and Industry Risks

Request Free Sample

Research Analyst Overview

  • The market is defined by a strategic shift toward technology-driven solutions that address complex global employment challenges. Core functions like payroll processing automation and multi-country compliance are now table stakes; differentiation comes from sophisticated capabilities in global payroll management and deep human capital management (hcm) integration.
  • Providers are leveraging cloud-based payroll platforms and robotic process automation (rpa) in payroll to deliver efficiency gains, with some achieving a 30% reduction in processing time. This allows for advanced features such as payroll data analytics, real-time payroll reporting, and predictive payroll forecasting.
  • For boardroom consideration, the ability to manage multi-jurisdictional tax laws and ensure wage protection system (wps) compliance is paramount. A unified payroll platform that includes employee self-service (ess) portals, automated tax filing, and robust benefits administration integration is becoming the standard.
  • Furthermore, employer of record (eor) services are critical for agile global expansion, simplifying cross-border payment processing and currency exchange management while maintaining a stringent payroll compliance framework.

What are the Key Data Covered in this Payroll Outsourcing Services Market Research and Growth Report?

  • What is the expected growth of the Payroll Outsourcing Services Market between 2026 and 2030?

    • USD 6.94 billion, at a CAGR of 5.1%

  • What segmentation does the market report cover?

    • The report is segmented by Product (Hybrid, and Fully outsourced), Type (Mid-market, National, and Multinational), End-user (Large enterprises, and SMEs) and Geography (North America, Europe, APAC, South America, Middle East and Africa)

  • Which regions are analyzed in the report?

    • North America, Europe, APAC, South America and Middle East and Africa

  • What are the key growth drivers and market challenges?

    • Growing demand for expert-led payroll compliance management, Intensifying data security and privacy imperatives

  • Who are the major players in the Payroll Outsourcing Services Market?

    • Automatic Data Processing Inc., BDO International Ltd., BIPO Service, Block Inc., CloudPay Inc., Deel Inc., Globalization Partners LLC, IRIS Software Group Ltd., Mercans LLC, Neeyamo Enterprise Solutions, Oyster HR Inc., Papaya Global Ltd., Paychex Inc., Paylocity Holding Corp., Ramco Systems Ltd., Remote Technology Inc., Rippling People Center Inc., Safeguard World International, SD Worx Group NV and TMF Group BV

Market Research Insights

  • The market dynamics are shaped by a strategic push for operational agility and rigorous compliance. Businesses are adopting a centralized global payroll strategy to gain control over disparate processes, with integrated platforms demonstrating a 30% improvement in payroll accuracy.
  • The demand for robust international payroll solutions is intensifying, particularly for managing payroll for remote teams, where compliance risk mitigation is paramount. As companies evaluate the benefits of outsourcing payroll functions, they find that specialized providers can reduce processing times by over 25% compared to legacy in-house systems.
  • The ability to offer automated compliance updates and a unified employee data record are key differentiators, making the evaluation of a multi-country payroll provider a critical decision for achieving scalable and secure global workforce payment solutions.

We can help! Our analysts can customize this payroll outsourcing services market research report to meet your requirements.

Get in touch

1. Executive Summary

1.1 Market overview

Executive Summary - Chart on Market Overview
Executive Summary - Data Table on Market Overview
Executive Summary - Chart on Global Market Characteristics
Executive Summary - Chart on Market by Geography
Executive Summary - Chart on Market Segmentation by Product
Executive Summary - Chart on Market Segmentation by Type
Executive Summary - Chart on Market Segmentation by End-user
Executive Summary - Chart on Incremental Growth
Executive Summary - Data Table on Incremental Growth
Executive Summary - Chart on Company Market Positioning

2. Technavio Analysis

2.1 Analysis of price sensitivity, lifecycle, customer purchase basket, adoption rates, and purchase criteria

2.2 Criticality of inputs and Factors of differentiation

Chart on Overview on criticality of inputs and factors of differentiation

2.3 Factors of disruption

Chart on Overview on factors of disruption

2.4 Impact of drivers and challenges

Chart on Impact of drivers and challenges in 2025 and 2030

3. Market Landscape

3.1 Market ecosystem

Chart on Parent Market
Data Table on - Parent Market

3.2 Market characteristics

Chart on Market characteristics analysis

3.3 Value chain analysis

Chart on Value chain analysis

4. Market Sizing

4.1 Market definition

Data Table on Offerings of companies included in the market definition

4.2 Market segment analysis

Market segments

4.3 Market size 2025

4.4 Market outlook: Forecast for 2025-2030

Chart on Global - Market size and forecast 2025-2030 ($ million)
Data Table on Global - Market size and forecast 2025-2030 ($ million)
Chart on Global Market: Year-over-year growth 2025-2030 (%)
Data Table on Global Market: Year-over-year growth 2025-2030 (%)

5. Historic Market Size

5.1 Global Payroll Outsourcing Services Market 2020 - 2024

Historic Market Size - Data Table on Global Payroll Outsourcing Services Market 2020 - 2024 ($ million)

5.2 Product segment analysis 2020 - 2024

Historic Market Size - Product Segment 2020 - 2024 ($ million)

5.3 Type segment analysis 2020 - 2024

Historic Market Size - Type Segment 2020 - 2024 ($ million)

5.4 End-user segment analysis 2020 - 2024

Historic Market Size - End-user Segment 2020 - 2024 ($ million)

5.5 Geography segment analysis 2020 - 2024

Historic Market Size - Geography Segment 2020 - 2024 ($ million)

5.6 Country segment analysis 2020 - 2024

Historic Market Size - Country Segment 2020 - 2024 ($ million)

6. Qualitative Analysis

6.1 Impact of AI on Global Payroll Outsourcing Services Market

7. Five Forces Analysis

7.1 Five forces summary

Five forces analysis - Comparison between 2025 and 2030

7.2 Bargaining power of buyers

Bargaining power of buyers - Impact of key factors 2025 and 2030

7.3 Bargaining power of suppliers

Bargaining power of suppliers - Impact of key factors in 2025 and 2030

7.4 Threat of new entrants

Threat of new entrants - Impact of key factors in 2025 and 2030

7.5 Threat of substitutes

Threat of substitutes - Impact of key factors in 2025 and 2030

7.6 Threat of rivalry

Threat of rivalry - Impact of key factors in 2025 and 2030

7.7 Market condition

Chart on Market condition - Five forces 2025 and 2030

8. Market Segmentation by Product

8.1 Market segments

Chart on Product - Market share 2025-2030 (%)
Data Table on Product - Market share 2025-2030 (%)

8.2 Comparison by Product

Chart on Comparison by Product
Data Table on Comparison by Product

8.3 Hybrid - Market size and forecast 2025-2030

Chart on Hybrid - Market size and forecast 2025-2030 ($ million)
Data Table on Hybrid - Market size and forecast 2025-2030 ($ million)
Chart on Hybrid - Year-over-year growth 2025-2030 (%)
Data Table on Hybrid - Year-over-year growth 2025-2030 (%)

8.4 Fully outsourced - Market size and forecast 2025-2030

Chart on Fully outsourced - Market size and forecast 2025-2030 ($ million)
Data Table on Fully outsourced - Market size and forecast 2025-2030 ($ million)
Chart on Fully outsourced - Year-over-year growth 2025-2030 (%)
Data Table on Fully outsourced - Year-over-year growth 2025-2030 (%)

8.5 Market opportunity by Product

Market opportunity by Product ($ million)
Data Table on Market opportunity by Product ($ million)

9. Market Segmentation by Type

9.1 Market segments

Chart on Type - Market share 2025-2030 (%)
Data Table on Type - Market share 2025-2030 (%)

9.2 Comparison by Type

Chart on Comparison by Type
Data Table on Comparison by Type

9.3 Mid-market - Market size and forecast 2025-2030

Chart on Mid-market - Market size and forecast 2025-2030 ($ million)
Data Table on Mid-market - Market size and forecast 2025-2030 ($ million)
Chart on Mid-market - Year-over-year growth 2025-2030 (%)
Data Table on Mid-market - Year-over-year growth 2025-2030 (%)

9.4 National - Market size and forecast 2025-2030

Chart on National - Market size and forecast 2025-2030 ($ million)
Data Table on National - Market size and forecast 2025-2030 ($ million)
Chart on National - Year-over-year growth 2025-2030 (%)
Data Table on National - Year-over-year growth 2025-2030 (%)

9.5 Multinational - Market size and forecast 2025-2030

Chart on Multinational - Market size and forecast 2025-2030 ($ million)
Data Table on Multinational - Market size and forecast 2025-2030 ($ million)
Chart on Multinational - Year-over-year growth 2025-2030 (%)
Data Table on Multinational - Year-over-year growth 2025-2030 (%)

9.6 Market opportunity by Type

Market opportunity by Type ($ million)
Data Table on Market opportunity by Type ($ million)

10. Market Segmentation by End-user

10.1 Market segments

Chart on End-user - Market share 2025-2030 (%)
Data Table on End-user - Market share 2025-2030 (%)

10.2 Comparison by End-user

Chart on Comparison by End-user
Data Table on Comparison by End-user

10.3 Large enterprises - Market size and forecast 2025-2030

Chart on Large enterprises - Market size and forecast 2025-2030 ($ million)
Data Table on Large enterprises - Market size and forecast 2025-2030 ($ million)
Chart on Large enterprises - Year-over-year growth 2025-2030 (%)
Data Table on Large enterprises - Year-over-year growth 2025-2030 (%)

10.4 SMEs - Market size and forecast 2025-2030

Chart on SMEs - Market size and forecast 2025-2030 ($ million)
Data Table on SMEs - Market size and forecast 2025-2030 ($ million)
Chart on SMEs - Year-over-year growth 2025-2030 (%)
Data Table on SMEs - Year-over-year growth 2025-2030 (%)

10.5 Market opportunity by End-user

Market opportunity by End-user ($ million)
Data Table on Market opportunity by End-user ($ million)

11. Customer Landscape

11.1 Customer landscape overview

Analysis of price sensitivity, lifecycle, customer purchase basket, adoption rates, and purchase criteria

12. Geographic Landscape

12.1 Geographic segmentation

Chart on Market share by geography 2025-2030 (%)
Data Table on Market share by geography 2025-2030 (%)

12.2 Geographic comparison

Chart on Geographic comparison
Data Table on Geographic comparison

12.3 North America - Market size and forecast 2025-2030

Chart on North America - Market size and forecast 2025-2030 ($ million)
Data Table on North America - Market size and forecast 2025-2030 ($ million)
Chart on North America - Year-over-year growth 2025-2030 (%)
Data Table on North America - Year-over-year growth 2025-2030 (%)
Chart on Regional Comparison - North America
Data Table on Regional Comparison - North America

12.3.1 US - Market size and forecast 2025-2030

Chart on US - Market size and forecast 2025-2030 ($ million)
Data Table on US - Market size and forecast 2025-2030 ($ million)
Chart on US - Year-over-year growth 2025-2030 (%)
Data Table on US - Year-over-year growth 2025-2030 (%)

12.3.2 Canada - Market size and forecast 2025-2030

Chart on Canada - Market size and forecast 2025-2030 ($ million)
Data Table on Canada - Market size and forecast 2025-2030 ($ million)
Chart on Canada - Year-over-year growth 2025-2030 (%)
Data Table on Canada - Year-over-year growth 2025-2030 (%)

12.3.3 Mexico - Market size and forecast 2025-2030

Chart on Mexico - Market size and forecast 2025-2030 ($ million)
Data Table on Mexico - Market size and forecast 2025-2030 ($ million)
Chart on Mexico - Year-over-year growth 2025-2030 (%)
Data Table on Mexico - Year-over-year growth 2025-2030 (%)

12.4 Europe - Market size and forecast 2025-2030

Chart on Europe - Market size and forecast 2025-2030 ($ million)
Data Table on Europe - Market size and forecast 2025-2030 ($ million)
Chart on Europe - Year-over-year growth 2025-2030 (%)
Data Table on Europe - Year-over-year growth 2025-2030 (%)
Chart on Regional Comparison - Europe
Data Table on Regional Comparison - Europe

12.4.1 UK - Market size and forecast 2025-2030

Chart on UK - Market size and forecast 2025-2030 ($ million)
Data Table on UK - Market size and forecast 2025-2030 ($ million)
Chart on UK - Year-over-year growth 2025-2030 (%)
Data Table on UK - Year-over-year growth 2025-2030 (%)

12.4.2 Germany - Market size and forecast 2025-2030

Chart on Germany - Market size and forecast 2025-2030 ($ million)
Data Table on Germany - Market size and forecast 2025-2030 ($ million)
Chart on Germany - Year-over-year growth 2025-2030 (%)
Data Table on Germany - Year-over-year growth 2025-2030 (%)

12.4.3 France - Market size and forecast 2025-2030

Chart on France - Market size and forecast 2025-2030 ($ million)
Data Table on France - Market size and forecast 2025-2030 ($ million)
Chart on France - Year-over-year growth 2025-2030 (%)
Data Table on France - Year-over-year growth 2025-2030 (%)

12.4.4 Italy - Market size and forecast 2025-2030

Chart on Italy - Market size and forecast 2025-2030 ($ million)
Data Table on Italy - Market size and forecast 2025-2030 ($ million)
Chart on Italy - Year-over-year growth 2025-2030 (%)
Data Table on Italy - Year-over-year growth 2025-2030 (%)

12.4.5 Spain - Market size and forecast 2025-2030

Chart on Spain - Market size and forecast 2025-2030 ($ million)
Data Table on Spain - Market size and forecast 2025-2030 ($ million)
Chart on Spain - Year-over-year growth 2025-2030 (%)
Data Table on Spain - Year-over-year growth 2025-2030 (%)

12.4.6 Poland - Market size and forecast 2025-2030

Chart on Poland - Market size and forecast 2025-2030 ($ million)
Data Table on Poland - Market size and forecast 2025-2030 ($ million)
Chart on Poland - Year-over-year growth 2025-2030 (%)
Data Table on Poland - Year-over-year growth 2025-2030 (%)

12.5 APAC - Market size and forecast 2025-2030

Chart on APAC - Market size and forecast 2025-2030 ($ million)
Data Table on APAC - Market size and forecast 2025-2030 ($ million)
Chart on APAC - Year-over-year growth 2025-2030 (%)
Data Table on APAC - Year-over-year growth 2025-2030 (%)
Chart on Regional Comparison - APAC
Data Table on Regional Comparison - APAC

12.5.1 China - Market size and forecast 2025-2030

Chart on China - Market size and forecast 2025-2030 ($ million)
Data Table on China - Market size and forecast 2025-2030 ($ million)
Chart on China - Year-over-year growth 2025-2030 (%)
Data Table on China - Year-over-year growth 2025-2030 (%)

12.5.2 India - Market size and forecast 2025-2030

Chart on India - Market size and forecast 2025-2030 ($ million)
Data Table on India - Market size and forecast 2025-2030 ($ million)
Chart on India - Year-over-year growth 2025-2030 (%)
Data Table on India - Year-over-year growth 2025-2030 (%)

12.5.3 Japan - Market size and forecast 2025-2030

Chart on Japan - Market size and forecast 2025-2030 ($ million)
Data Table on Japan - Market size and forecast 2025-2030 ($ million)
Chart on Japan - Year-over-year growth 2025-2030 (%)
Data Table on Japan - Year-over-year growth 2025-2030 (%)

12.5.4 South Korea - Market size and forecast 2025-2030

Chart on South Korea - Market size and forecast 2025-2030 ($ million)
Data Table on South Korea - Market size and forecast 2025-2030 ($ million)
Chart on South Korea - Year-over-year growth 2025-2030 (%)
Data Table on South Korea - Year-over-year growth 2025-2030 (%)

12.5.5 Singapore - Market size and forecast 2025-2030

Chart on Singapore - Market size and forecast 2025-2030 ($ million)
Data Table on Singapore - Market size and forecast 2025-2030 ($ million)
Chart on Singapore - Year-over-year growth 2025-2030 (%)
Data Table on Singapore - Year-over-year growth 2025-2030 (%)

12.5.6 Indonesia - Market size and forecast 2025-2030

Chart on Indonesia - Market size and forecast 2025-2030 ($ million)
Data Table on Indonesia - Market size and forecast 2025-2030 ($ million)
Chart on Indonesia - Year-over-year growth 2025-2030 (%)
Data Table on Indonesia - Year-over-year growth 2025-2030 (%)

12.6 South America - Market size and forecast 2025-2030

Chart on South America - Market size and forecast 2025-2030 ($ million)
Data Table on South America - Market size and forecast 2025-2030 ($ million)
Chart on South America - Year-over-year growth 2025-2030 (%)
Data Table on South America - Year-over-year growth 2025-2030 (%)
Chart on Regional Comparison - South America
Data Table on Regional Comparison - South America

12.6.1 Brazil - Market size and forecast 2025-2030

Chart on Brazil - Market size and forecast 2025-2030 ($ million)
Data Table on Brazil - Market size and forecast 2025-2030 ($ million)
Chart on Brazil - Year-over-year growth 2025-2030 (%)
Data Table on Brazil - Year-over-year growth 2025-2030 (%)

12.6.2 Argentina - Market size and forecast 2025-2030

Chart on Argentina - Market size and forecast 2025-2030 ($ million)
Data Table on Argentina - Market size and forecast 2025-2030 ($ million)
Chart on Argentina - Year-over-year growth 2025-2030 (%)
Data Table on Argentina - Year-over-year growth 2025-2030 (%)

12.6.3 Chile - Market size and forecast 2025-2030

Chart on Chile - Market size and forecast 2025-2030 ($ million)
Data Table on Chile - Market size and forecast 2025-2030 ($ million)
Chart on Chile - Year-over-year growth 2025-2030 (%)
Data Table on Chile - Year-over-year growth 2025-2030 (%)

12.7 Middle East and Africa - Market size and forecast 2025-2030

Chart on Middle East and Africa - Market size and forecast 2025-2030 ($ million)
Data Table on Middle East and Africa - Market size and forecast 2025-2030 ($ million)
Chart on Middle East and Africa - Year-over-year growth 2025-2030 (%)
Data Table on Middle East and Africa - Year-over-year growth 2025-2030 (%)
Chart on Regional Comparison - Middle East and Africa
Data Table on Regional Comparison - Middle East and Africa

12.7.1 UAE - Market size and forecast 2025-2030

Chart on UAE - Market size and forecast 2025-2030 ($ million)
Data Table on UAE - Market size and forecast 2025-2030 ($ million)
Chart on UAE - Year-over-year growth 2025-2030 (%)
Data Table on UAE - Year-over-year growth 2025-2030 (%)

12.7.2 Saudi Arabia - Market size and forecast 2025-2030

Chart on Saudi Arabia - Market size and forecast 2025-2030 ($ million)
Data Table on Saudi Arabia - Market size and forecast 2025-2030 ($ million)
Chart on Saudi Arabia - Year-over-year growth 2025-2030 (%)
Data Table on Saudi Arabia - Year-over-year growth 2025-2030 (%)

12.7.3 South Africa - Market size and forecast 2025-2030

Chart on South Africa - Market size and forecast 2025-2030 ($ million)
Data Table on South Africa - Market size and forecast 2025-2030 ($ million)
Chart on South Africa - Year-over-year growth 2025-2030 (%)
Data Table on South Africa - Year-over-year growth 2025-2030 (%)

12.7.4 Egypt - Market size and forecast 2025-2030

Chart on Egypt - Market size and forecast 2025-2030 ($ million)
Data Table on Egypt - Market size and forecast 2025-2030 ($ million)
Chart on Egypt - Year-over-year growth 2025-2030 (%)
Data Table on Egypt - Year-over-year growth 2025-2030 (%)

12.7.5 Israel - Market size and forecast 2025-2030

Chart on Israel - Market size and forecast 2025-2030 ($ million)
Data Table on Israel - Market size and forecast 2025-2030 ($ million)
Chart on Israel - Year-over-year growth 2025-2030 (%)
Data Table on Israel - Year-over-year growth 2025-2030 (%)

12.8 Market opportunity by geography

Market opportunity by geography ($ million)
Data Tables on Market opportunity by geography ($ million)

13. Drivers, Challenges, and Opportunity

13.1 Market drivers

Growing demand for expert-led payroll compliance management
Accelerated adoption of advanced payroll technologies
Strategic shift to remote and hybrid work models

13.2 Market challenges

Intensifying data security and privacy imperatives
Navigating dynamic and fragmented global regulatory landscape
Overcoming technical integration and data standardization hurdles

13.3 Impact of drivers and challenges

Impact of drivers and challenges in 2025 and 2030

13.4 Market opportunities

Hyper automation and integration of AI
Rise of integrated human capital management and employee experience platforms
Data analytics and demand for actionable insights

14. Competitive Landscape

14.1 Overview

14.2

Overview on criticality of inputs and factors of differentiation

14.3 Landscape disruption

Overview on factors of disruption

14.4 Industry risks

Impact of key risks on business

15. Competitive Analysis

15.1 Companies profiled

Companies covered

15.2 Company ranking index

15.3 Market positioning of companies

Matrix on companies position and classification

15.4 Automatic Data Processing Inc.

Automatic Data Processing Inc. - Overview
Automatic Data Processing Inc. - Business segments
Automatic Data Processing Inc. - Key news
Automatic Data Processing Inc. - Key offerings
Automatic Data Processing Inc. - Segment focus
SWOT

15.5 Block Inc.

Block Inc. - Overview
Block Inc. - Business segments
Block Inc. - Key news
Block Inc. - Key offerings
Block Inc. - Segment focus
SWOT

15.6 Deel Inc.

Deel Inc. - Overview
Deel Inc. - Product / Service
Deel Inc. - Key offerings
SWOT

15.7 Globalization Partners LLC

Globalization Partners LLC - Overview
Globalization Partners LLC - Product / Service
Globalization Partners LLC - Key offerings
SWOT

15.8 Mercans LLC

Mercans LLC - Overview
Mercans LLC - Product / Service
Mercans LLC - Key offerings
SWOT

15.9 Neeyamo Enterprise Solutions

Neeyamo Enterprise Solutions - Overview
Neeyamo Enterprise Solutions - Product / Service
Neeyamo Enterprise Solutions - Key offerings
SWOT

15.10 Oyster HR Inc.

Oyster HR Inc. - Overview
Oyster HR Inc. - Product / Service
Oyster HR Inc. - Key offerings
SWOT

15.11 Papaya Global Ltd.

Papaya Global Ltd. - Overview
Papaya Global Ltd. - Product / Service
Papaya Global Ltd. - Key offerings
SWOT

15.12 Paychex Inc.

Paychex Inc. - Overview
Paychex Inc. - Business segments
Paychex Inc. - Key offerings
Paychex Inc. - Segment focus
SWOT

15.13 Paylocity Holding Corp.

Paylocity Holding Corp. - Overview
Paylocity Holding Corp. - Product / Service
Paylocity Holding Corp. - Key offerings
SWOT

15.14 Ramco Systems Ltd.

Ramco Systems Ltd. - Overview
Ramco Systems Ltd. - Business segments
Ramco Systems Ltd. - Key offerings
Ramco Systems Ltd. - Segment focus
SWOT

15.15 Remote Technology Inc.

Remote Technology Inc. - Overview
Remote Technology Inc. - Product / Service
Remote Technology Inc. - Key offerings
SWOT

15.16 Safeguard World International

Safeguard World International - Overview
Safeguard World International - Product / Service
Safeguard World International - Key offerings
SWOT

15.17 SD Worx Group NV

SD Worx Group NV - Overview
SD Worx Group NV - Product / Service
SD Worx Group NV - Key offerings
SWOT

15.18 TMF Group BV

TMF Group BV - Overview
TMF Group BV - Product / Service
TMF Group BV - Key offerings
SWOT

16. Appendix

16.1 Scope of the report

Market definition
Objectives
Notes and caveats

16.2 Inclusions and exclusions checklist

Inclusions checklist
Exclusions checklist

16.3 Currency conversion rates for US$

16.4 Research methodology

16.5 Data procurement

Information sources

16.6 Data validation

16.7 Validation techniques employed for market sizing

16.8 Data synthesis

16.9 360 degree market analysis

16.10 List of abbreviations

Research Methodology

Technavio presents a detailed picture of the market by way of study, synthesis, and summation of data from multiple sources. The analysts have presented the various facets of the market with a particular focus on identifying the key industry influencers. The data thus presented is comprehensive, reliable, and the result of extensive research, both primary and secondary.

INFORMATION SOURCES

Primary sources

  • Manufacturers and suppliers
  • Channel partners
  • Industry experts
  • Strategic decision makers

Secondary sources

  • Industry journals and periodicals
  • Government data
  • Financial reports of key industry players
  • Historical data
  • Press releases

DATA ANALYSIS

Data Synthesis

  • Collation of data
  • Estimation of key figures
  • Analysis of derived insights

Data Validation

  • Triangulation with data models
  • Reference against proprietary databases
  • Corroboration with industry experts

REPORT WRITING

Qualitative

  • Market drivers
  • Market challenges
  • Market trends
  • Five forces analysis

Quantitative

  • Market size and forecast
  • Market segmentation
  • Geographical insights
  • Competitive landscape

Interested in this report?

Get your sample now to see our research methodology and insights!

Download Now

Frequently Asked Questions

Payroll Outsourcing Services market growth will increase by USD 6940.3 million during 2026-2030.

The Payroll Outsourcing Services market is expected to grow at a CAGR of 5.1% during 2026-2030.

Payroll Outsourcing Services market is segmented by Product (Hybrid, Fully outsourced) Type (Mid-market, National, Multinational) End-user (Large enterprises, SMEs)

Automatic Data Processing Inc., BDO International Ltd., BIPO Service, Block Inc., CloudPay Inc., Deel Inc., Globalization Partners LLC, IRIS Software Group Ltd., Mercans LLC, Neeyamo Enterprise Solutions, Oyster HR Inc., Papaya Global Ltd., Paychex Inc., Paylocity Holding Corp., Ramco Systems Ltd., Remote Technology Inc., Rippling People Center Inc., Safeguard World International, SD Worx Group NV, TMF Group BV are a few of the key vendors in the Payroll Outsourcing Services market.

North America will register the highest growth rate of 45% among the other regions. Therefore, the Payroll Outsourcing Services market in North America is expected to garner significant business opportunities for the vendors during the forecast period.

US, Canada, Mexico, UK, Germany, France, Italy, Spain, Poland, China, India, Japan, South Korea, Singapore, Indonesia, Brazil, Argentina, Chile, UAE, Saudi Arabia, South Africa, Egypt, Israel

  • Growing demand for expert-led payroll compliance management is the driving factor this market.

The Payroll Outsourcing Services market vendors should focus on grabbing business opportunities from the Product segment as it accounted for the largest market share in the base year.