Pectin Market Analysis, Size, and Forecast 2025-2029: Europe (Germany, UK, and France), North America (US, Canada, and Mexico), APAC (China, Japan, and India), Middle East and Africa (South Africa, UAE, and Saudi Arabia), South America (Brazil, Argentina, and Colombia), and Rest of World (ROW)

Pectin Market Analysis, Size, and Forecast 2025-2029:
Europe (Germany, UK, and France), North America (US, Canada, and Mexico), APAC (China, Japan, and India), Middle East and Africa (South Africa, UAE, and Saudi Arabia), South America (Brazil, Argentina, and Colombia), and Rest of World (ROW)

Published: Dec 2025 311 Pages SKU: IRTNTR70594

Market Overview at a Glance

$848.2 Mn
Market Opportunity
9%
CAGR 2024 - 2029
32.3%
North America Growth
$612.2 Mn
Food and bakery segment 2023

Pectin Market Size 2025-2029

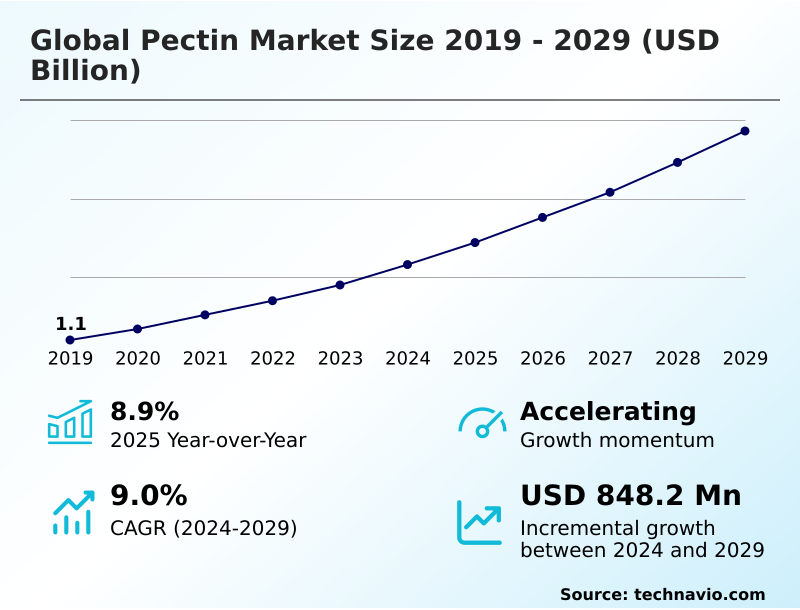
The pectin market size is valued to increase by USD 848.2 million, at a CAGR of 9% from 2024 to 2029. Increasing demand for natural and plant-based ingredients will drive the pectin market.

Major Market Trends & Insights

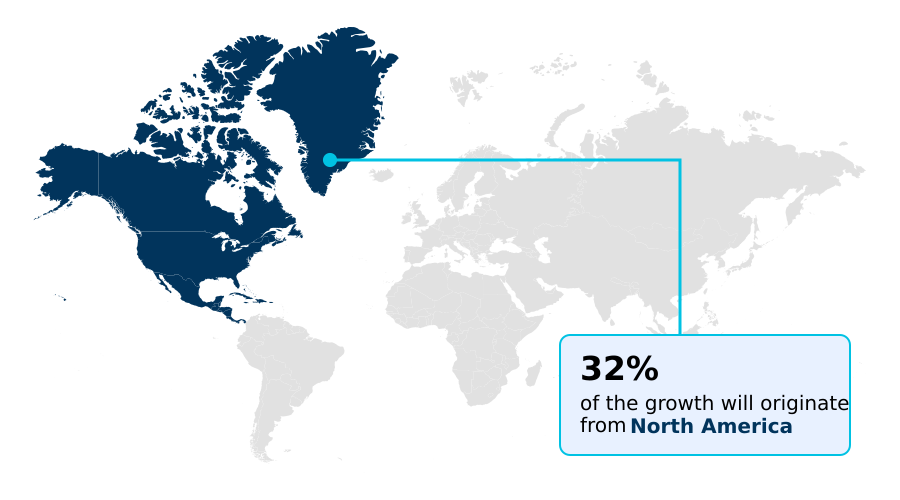
  • North America dominated the market and accounted for a 32.3% growth during the forecast period.
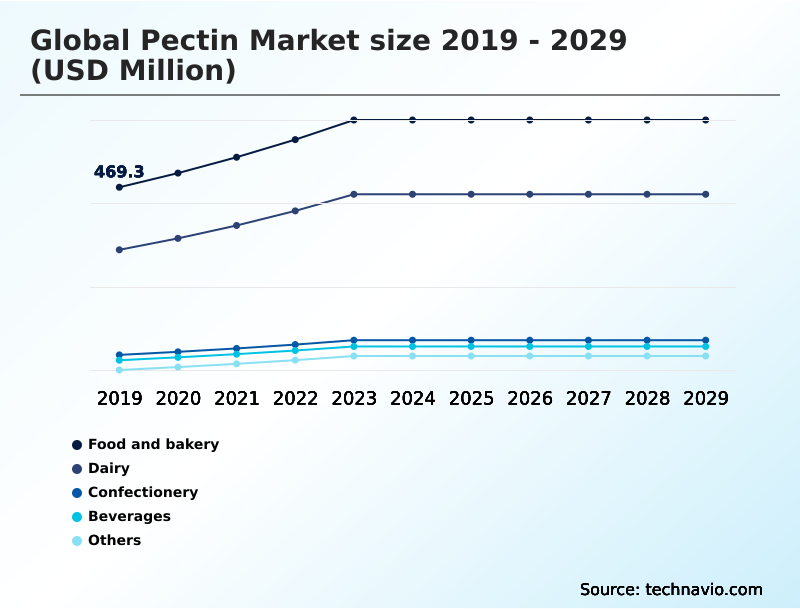
  • By End-user - Food and bakery segment was valued at USD 612.2 million in 2023
  • By Application - Gelling agent segment accounted for the largest market revenue share in 2023

Market Size & Forecast

  • Market Opportunities: USD 1.33 billion
  • Market Future Opportunities: USD 848.2 million
  • CAGR from 2024 to 2029 : 9%

Market Summary

  • The pectin market is defined by its integral role in the food, beverage, and pharmaceutical sectors as a functional polysaccharide. Growth is propelled by consumer demand for clean label ingredients and the expansion of plant-based and functional foods. Pectin's utility as a gelling agent, stabilizer, and thickener is indispensable.
  • However, the industry grapples with challenges related to raw material price volatility and supply chain inconsistencies, which can impact production costs. For instance, a beverage manufacturer seeking to launch a new low-sugar fruit drink relies on a specific low methoxyl pectin for pulp suspension and mouthfeel.
  • An unexpected shortage in apple pomace, a primary raw material, can force a costly and time-consuming reformulation with an alternative hydrocolloid, potentially delaying market entry. This scenario highlights the critical need for robust sourcing strategies and innovation in pectin extraction from diverse botanical sources to ensure market stability and support continuous product development.
  • The focus remains on enhancing hydrocolloid functionality to meet evolving consumer preferences for natural and healthier products.

What will be the Size of the Pectin Market during the forecast period?

Get Key Insights on Market Forecast (PDF) Request Free Sample

How is the Pectin Market Segmented?

The pectin industry research report provides comprehensive data (region-wise segment analysis), with forecasts and estimates in "USD million" for the period 2025-2029, as well as historical data from 2019-2023 for the following segments.

  • End-user
    • Food and bakery
    • Dairy
    • Confectionery
    • Beverages
    • Others
  • Application
    • Gelling agent
    • Thickener
    • Stabilizer
    • Fat replacer
    • Others
  • Source
    • Citrus peel
    • Apple pomace
    • Others
  • Geography
    • Europe
      • Germany
      • UK
      • France
    • North America
      • US
      • Canada
      • Mexico
    • APAC
      • China
      • Japan
      • India
    • Middle East and Africa
      • South Africa
      • UAE
      • Saudi Arabia
    • South America
      • Brazil
      • Argentina
      • Colombia
    • Rest of World (ROW)

By End-user Insights

The food and bakery segment is estimated to witness significant growth during the forecast period.

The food and bakery segment leverages pectin as a critical food processing aid for texture modification and stability. As a versatile natural food hydrocolloid and texturizer for baked goods, this plant-derived gelling agent is indispensable in fruit preparations.

It acts as a primary thickening agent and fat replacer in low-fat products, improving moisture retention by up to 15%. The rheological properties are fine-tuned for specific outcomes, from creating firm gels to creamy fillings.

Industry focus on citrus peel valorization supports sustainable supply. Furthermore, its use as a pharmaceutical excipient informs its high-quality standards, while hydrocolloid synergy with other ingredients is explored for advanced formulations.

It is also used as a gelling agent for yogurts.

Request Free Sample

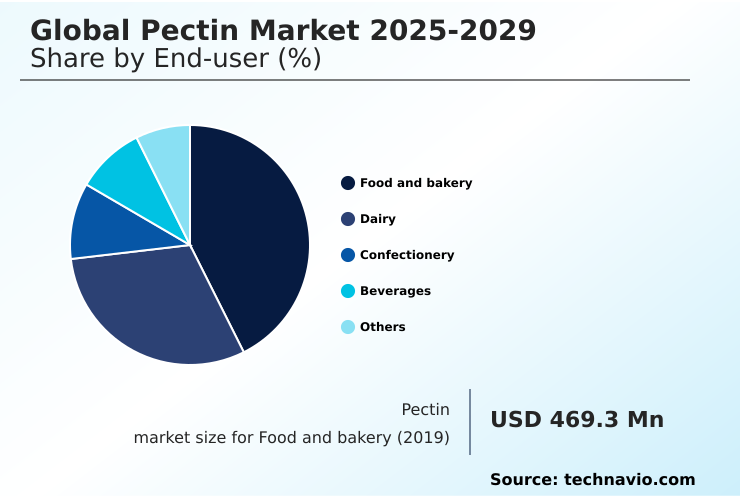
The Food and bakery segment was valued at USD 612.2 million in 2023 and showed a gradual increase during the forecast period.

Request Free Sample

Regional Analysis

North America is estimated to contribute 32.3% to the growth of the global market during the forecast period.Technavio’s analysts have elaborately explained the regional trends and drivers that shape the market during the forecast period.

See How Pectin Market Demand is Rising in North America Request Free Sample

The geographic landscape is shaped by regional consumption patterns and processing capabilities.

North America leads in innovation, especially for pectin for dairy alternatives, while APAC is the fastest-growing region, with its market expanding at a rate over 1.5% higher than Europe.

In Europe, a focus on tradition and quality drives demand for citrus pectin in classic acid sugar gel jams. Its role as a dietary fiber and functional food ingredient is gaining traction globally.

As a fruit-based stabilizer and emulsion stabilizer, it is crucial for mouthfeel enhancement and beverage pulp suspension in drinks. Advanced applications include its use in biodegradable films and as an excipient for drug delivery, forming a stable calcium pectinate gel.

Market Dynamics

Our researchers analyzed the data with 2024 as the base year, along with the key drivers, trends, and challenges. A holistic analysis of drivers will help companies refine their marketing strategies to gain a competitive advantage.

  • Strategic formulation in the food and beverage industry increasingly hinges on understanding the nuances of pectin. The debate over citrus pectin versus apple pectin functionality is central to product development, as each offers unique textural properties. For instance, using pectin for low sugar jam production often requires low methoxyl variants to achieve the desired gel without high solids content.
  • In bakery, using pectin as a fat replacer in bakery items can improve moisture retention and shelf life. The economic impact of pectin price volatility forces manufacturers to evaluate the cost of pectin versus other hydrocolloids, making efficient raw material sourcing a priority.
  • For a stabilizer for plant-based yogurt formulation, the goal is achieving creaminess and preventing whey separation, a challenge addressed by controlling syneresis with amidated pectin. In beverages, using pectin for beverage mouthfeel enhancement and for protein stabilization in drinks are key objectives. Advancements in pectin extraction technology are crucial, as are adherence to regulatory standards for food grade pectin.
  • In confectionery, achieving the perfect texture in vegan gummies with pectin depends on selecting the right high methoxyl pectin for confectionery. For functional applications, the role of pectin in edible food coatings and in pharmaceutical drug delivery systems highlights its versatility, where optimizing pectin gel strength in preserves can reduce additive usage by 10% compared to standard formulations.
  • The gelling properties of modified pectin continue to open new application horizons.

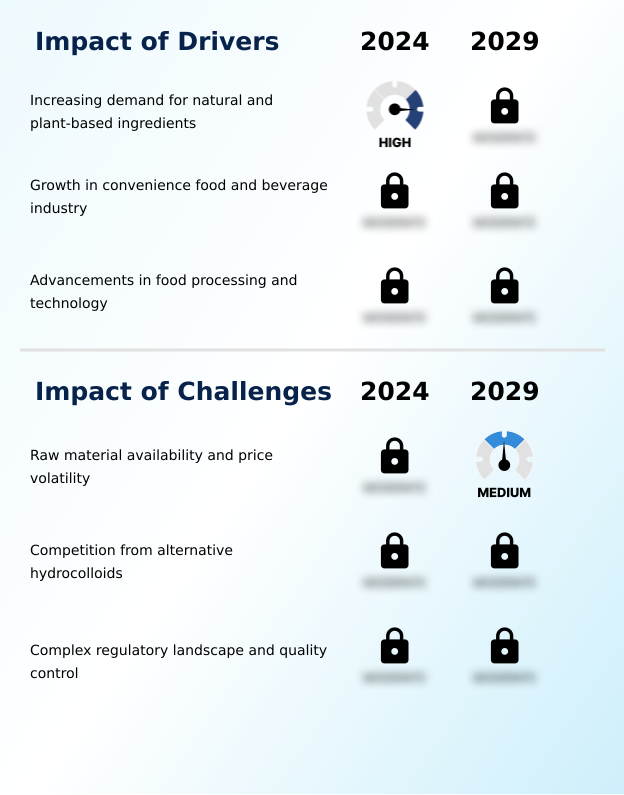
What are the key market drivers leading to the rise in the adoption of Pectin Industry?

  • The growing demand for natural, recognizable, and plant-based ingredients is the key driver fueling expansion in the pectin market.

  • Demand for natural products drives the market, with pectin’s status as a clean label ingredient and sustainable food additive being paramount. The pectin extraction process is continuously optimized to yield specific functionalities.
  • Its polysaccharide structure allows for viscosity control, making it an effective thickener for sauces and a key ingredient in low-sugar jam formulation.
  • As a food additive, its functionality is determined by the degree of esterification, enabling its use as a fat mimetic in foods.
  • Modified pectin is developed for specialized roles, such as creating a controlled-release matrix in functional foods or providing texture in pectin for dairy alternatives, where it can reduce reliance on other stabilizers by up to 30%.

What are the market trends shaping the Pectin Industry?

  • The increasing consumer shift toward plant-based food and beverage products represents a significant market trend. This movement is a primary factor driving demand for versatile, plant-derived ingredients.

  • The rise of plant-based diets is a primary trend, positioning pectin as a leading plant-based texturizer and vegan gelatin alternative. Its role as a stabilizing agent is crucial for stabilizer for plant milks, where it can improve suspension and prevent separation, extending product appeal by over 25%. The specific gelling mechanism of high methoxyl pectin is leveraged in confectionery.
  • Beyond food, nutraceutical applications are expanding, using pectin as a prebiotic dietary fiber. Innovations in encapsulation technology use pectin for protecting active ingredients. Advanced food texture analysis validates its performance, while its use in edible coating for produce acts as a shelf-life extension additive and supports juice clarification.

What challenges does the Pectin Industry face during its growth?

  • Volatility in the availability and pricing of raw materials, such as citrus peels and apple pomace, presents a significant challenge to market growth and stability.

  • Navigating raw material sourcing and price volatility remains a key challenge, making efficient apple pomace utilization crucial. The hydrocolloid functionality of apple pectin faces competition, necessitating innovation in hydrocolloid blend optimization to highlight its superior gelling properties of polysaccharides. Ensuring consistent pectin quality control is vital. In applications like dairy, syneresis control and protein stabilization are critical performance metrics.
  • Formulators use low methoxyl pectin and amidated pectin to create robust gels in low-sugar environments. This is essential for the confectionery gelling system, where texture is paramount. Pectin's role also extends to hydrocolloid for cosmetics, where purity and performance must be flawless, with batch testing reducing formulation failures by 15%.

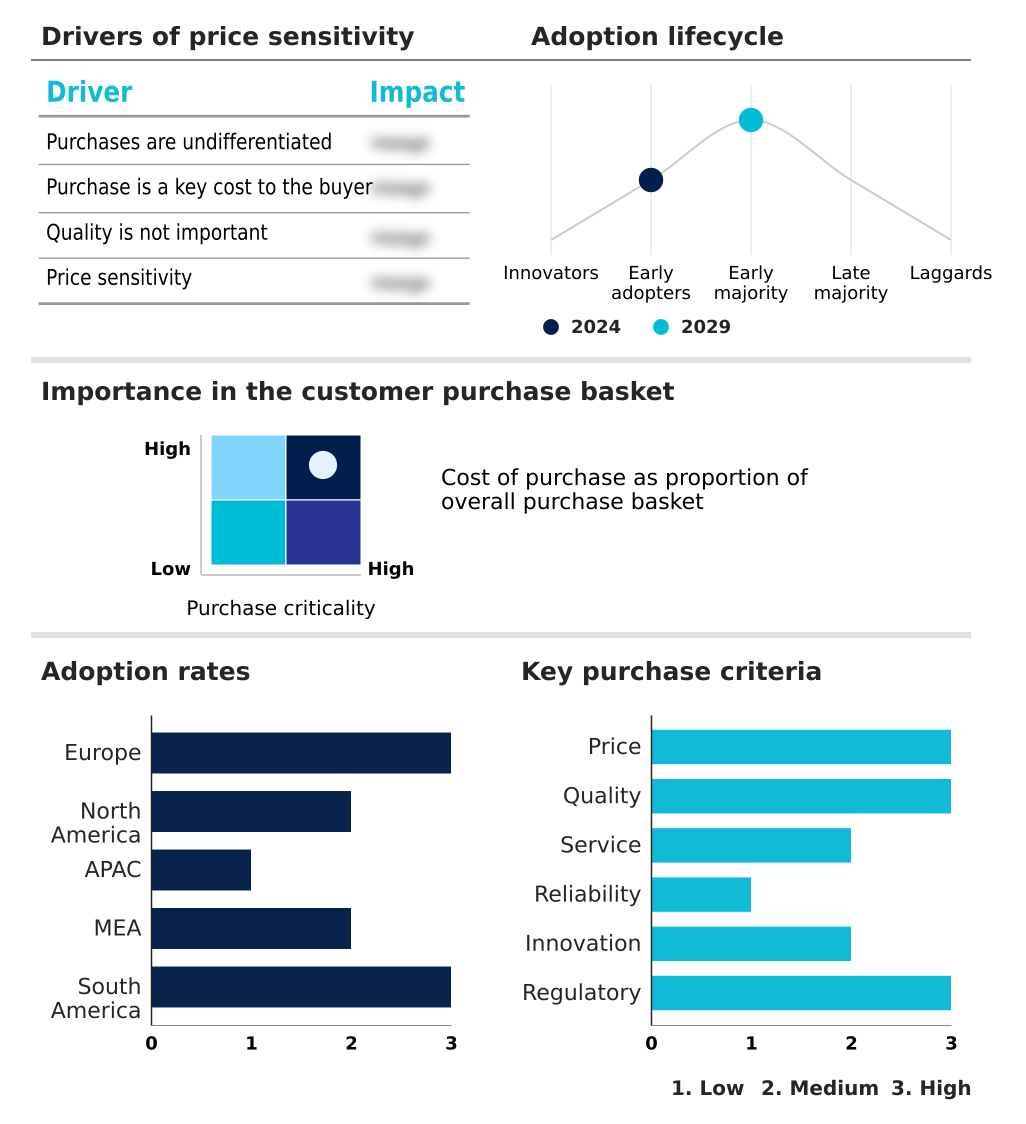
Exclusive Technavio Analysis on Customer Landscape

The pectin market forecasting report includes the adoption lifecycle of the market, covering from the innovator’s stage to the laggard’s stage. It focuses on adoption rates in different regions based on penetration. Furthermore, the pectin market report also includes key purchase criteria and drivers of price sensitivity to help companies evaluate and develop their market growth analysis strategies.

Customer Landscape of Pectin Industry

Competitive Landscape

Companies are implementing various strategies, such as strategic alliances, pectin market forecast, partnerships, mergers and acquisitions, geographical expansion, and product/service launches, to enhance their presence in the industry.

Agar Corp. - Specialized citrus and apple pectins provide tailored gelling, thickening, and stabilizing solutions for diverse food, beverage, and pharmaceutical applications.

The industry research and growth report includes detailed analyses of the competitive landscape of the market and information about key companies, including:

  • Agar Corp.
  • Al Sedanah Jordan LLC
  • Cargill Inc.
  • Compania Espanola S.A.
  • Condio GmbH
  • Devson Impex Pvt. Ltd.
  • DSM Firmenich AG
  • DuPont de Nemours Inc.
  • Herbstreith and Fox GmbH
  • Ingredion Inc.
  • J. Rettenmaier and Sohne
  • Jinfeng Technology Co. Ltd.
  • Krishna Pectins Pvt. Ltd.
  • Maspex
  • Polygal Inc.
  • Silvateam Spa
  • Tate and Lyle PLC
  • The Kraft Heinz Co

Qualitative and quantitative analysis of companies has been conducted to help clients understand the wider business environment as well as the strengths and weaknesses of key industry players. Data is qualitatively analyzed to categorize companies as pure play, category-focused, industry-focused, and diversified; it is quantitatively analyzed to categorize companies as dominant, leading, strong, tentative, and weak.

Recent Development and News in Pectin market

  • In September 2024, IFF showcased its expanded portfolio of plant-based solutions, emphasizing how natural hydrocolloids like pectin are crucial for developing innovative, clean label products for the food and beverage industry.
  • In November 2024, Ingredion highlighted its ingredient solutions, including pectin, tailored for the convenience food sector, demonstrating how these ingredients enable manufacturers to create stable and appealing ready-to-eat products.
  • In January 2025, CP Kelco reaffirmed its commitment to process innovation and research for hydrocolloids, including pectin, to develop advanced solutions that meet the evolving demands of the food and beverage industry.
  • In March 2025, Tate and Lyle PLC presented its solutions for sugar reduction and texture optimization in confectionery, which frequently involve natural hydrocolloids like pectin to meet contemporary consumer demands for healthier sweet treats.

Dive into Technavio’s robust research methodology, blending expert interviews, extensive data synthesis, and validated models for unparalleled Pectin Market insights. See full methodology.

Market Scope
Page number 311
Base year 2024
Historic period 2019-2023
Forecast period 2025-2029
Growth momentum & CAGR Accelerate at a CAGR of 9%
Market growth 2025-2029 USD 848.2 million
Market structure Fragmented
YoY growth 2024-2025(%) 8.9%
Key countries Germany, UK, France, Italy, Spain, The Netherlands, US, Canada, Mexico, China, Japan, India, South Korea, Australia, Indonesia, South Africa, UAE, Saudi Arabia, Israel, Turkey, Brazil, Argentina and Colombia
Competitive landscape Leading Companies, Market Positioning of Companies, Competitive Strategies, and Industry Risks

Request Free Sample

Research Analyst Overview

  • The pectin market's evolution is driven by its essential hydrocolloid functionality as a natural food additive. The inherent polysaccharide structure, defined by its degree of esterification, dictates its performance as a gelling agent, thickening agent, and stabilizing agent.
  • Boardroom decisions are increasingly influenced by the clean label movement, pushing for reformulation with pectin as a plant-based texturizer and fat replacer, where it facilitates texture modification and mouthfeel enhancement. Companies leverage specific types like high methoxyl pectin for acid sugar gel formations and low methoxyl pectin or amidated pectin for calcium pectinate gel systems, crucial for syneresis control.
  • The choice between citrus pectin and apple pectin depends on raw material sourcing and desired rheological properties. This focus has led to innovations in modified pectin for specialized nutraceutical applications, such as encapsulation technology for a controlled-release matrix, with firms reporting a 10% improvement in active ingredient stability.
  • Its role extends to juice clarification, protein stabilization, and as a pharmaceutical excipient, with ongoing research into biodegradable films for sustainable packaging, all while managing viscosity control.

What are the Key Data Covered in this Pectin Market Research and Growth Report?

  • What is the expected growth of the Pectin Market between 2025 and 2029?

    • USD 848.2 million, at a CAGR of 9%

  • What segmentation does the market report cover?

    • The report is segmented by End-user (Food and bakery, Dairy, Confectionery, Beverages, and Others), Application (Gelling agent, Thickener, Stabilizer, Fat replacer, and Others), Source (Citrus peel, Apple pomace, and Others) and Geography (Europe, North America, APAC, Middle East and Africa, South America)

  • Which regions are analyzed in the report?

    • Europe, North America, APAC, Middle East and Africa and South America

  • What are the key growth drivers and market challenges?

    • Increasing demand for natural and plant-based ingredients, Raw material availability and price volatility

  • Who are the major players in the Pectin Market?

    • Agar Corp., Al Sedanah Jordan LLC, Cargill Inc., Compania Espanola S.A., Condio GmbH, Devson Impex Pvt. Ltd., DSM Firmenich AG, DuPont de Nemours Inc., Herbstreith and Fox GmbH, Ingredion Inc., J. Rettenmaier and Sohne, Jinfeng Technology Co. Ltd., Krishna Pectins Pvt. Ltd., Maspex, Polygal Inc., Silvateam Spa, Tate and Lyle PLC and The Kraft Heinz Co

Market Research Insights

  • The pectin market's dynamics are heavily influenced by its role as a versatile texturizer and stabilizer. The adoption of pectin as a vegan gelatin alternative has accelerated, with product reformulations leading to a 20% increase in development cycles for some confectionery manufacturers.
  • In beverages, its function in beverage pulp suspension helps maintain product homogeneity, improving consumer satisfaction scores by over 15%. The application of pectin for dairy alternatives is also expanding as formulators seek a clean label texturizer to mimic traditional mouthfeel.
  • These shifts underscore the ingredient's critical role in meeting consumer demands for plant-based, natural, and functional products while providing tangible improvements in product quality and stability.

We can help! Our analysts can customize this pectin market research report to meet your requirements.

Get in touch

1. Executive Summary

1.1 Market overview

Executive Summary - Chart on Market Overview
Executive Summary - Data Table on Market Overview
Executive Summary - Chart on Global Market Characteristics
Executive Summary - Chart on Market by Geography
Executive Summary - Chart on Market Segmentation by End-user
Executive Summary - Chart on Market Segmentation by Application
Executive Summary - Chart on Market Segmentation by Source
Executive Summary - Chart on Incremental Growth
Executive Summary - Data Table on Incremental Growth
Executive Summary - Chart on Company Market Positioning

2. Technavio Analysis

2.1 Analysis of price sensitivity, lifecycle, customer purchase basket, adoption rates, and purchase criteria

2.2 Criticality of inputs and Factors of differentiation

Chart on Overview on criticality of inputs and factors of differentiation

2.3 Factors of disruption

Chart on Overview on factors of disruption

2.4 Impact of drivers and challenges

Chart on Impact of drivers and challenges in 2024 and 2029

3. Market Landscape

3.1 Market ecosystem

Chart on Parent Market
Data Table on - Parent Market

3.2 Market characteristics

Chart on Market characteristics analysis

3.3 Value chain analysis

Chart on Value chain analysis

4. Market Sizing

4.1 Market definition

Data Table on Offerings of companies included in the market definition

4.2 Market segment analysis

Market segments

4.3 Market size 2024

4.4 Market outlook: Forecast for 2024-2029

Chart on Global - Market size and forecast 2024-2029 ($ million)
Data Table on Global - Market size and forecast 2024-2029 ($ million)
Chart on Global Market: Year-over-year growth 2024-2029 (%)
Data Table on Global Market: Year-over-year growth 2024-2029 (%)

5. Historic Market Size

5.1 Global Pectin Market 2019 - 2023

Historic Market Size - Data Table on Global Pectin Market 2019 - 2023 ($ million)

5.2 End-user segment analysis 2019 - 2023

Historic Market Size - End-user Segment 2019 - 2023 ($ million)

5.3 Application segment analysis 2019 - 2023

Historic Market Size - Application Segment 2019 - 2023 ($ million)

5.4 Source segment analysis 2019 - 2023

Historic Market Size - Source Segment 2019 - 2023 ($ million)

5.5 Geography segment analysis 2019 - 2023

Historic Market Size - Geography Segment 2019 - 2023 ($ million)

5.6 Country segment analysis 2019 - 2023

Historic Market Size - Country Segment 2019 - 2023 ($ million)

6. Qualitative Analysis

6.1 Impact of AI on global pectin market

7. Five Forces Analysis

7.1 Five forces summary

Five forces analysis - Comparison between 2024 and 2029

7.2 Bargaining power of buyers

Bargaining power of buyers - Impact of key factors 2024 and 2029

7.3 Bargaining power of suppliers

Bargaining power of suppliers - Impact of key factors in 2024 and 2029

7.4 Threat of new entrants

Threat of new entrants - Impact of key factors in 2024 and 2029

7.5 Threat of substitutes

Threat of substitutes - Impact of key factors in 2024 and 2029

7.6 Threat of rivalry

Threat of rivalry - Impact of key factors in 2024 and 2029

7.7 Market condition

Chart on Market condition - Five forces 2024 and 2029

8. Market Segmentation by End-user

8.1 Market segments

Chart on End-user - Market share 2024-2029 (%)
Data Table on End-user - Market share 2024-2029 (%)

8.2 Comparison by End-user

Chart on Comparison by End-user
Data Table on Comparison by End-user

8.3 Food and bakery - Market size and forecast 2024-2029

Chart on Food and bakery - Market size and forecast 2024-2029 ($ million)
Data Table on Food and bakery - Market size and forecast 2024-2029 ($ million)
Chart on Food and bakery - Year-over-year growth 2024-2029 (%)
Data Table on Food and bakery - Year-over-year growth 2024-2029 (%)

8.4 Dairy - Market size and forecast 2024-2029

Chart on Dairy - Market size and forecast 2024-2029 ($ million)
Data Table on Dairy - Market size and forecast 2024-2029 ($ million)
Chart on Dairy - Year-over-year growth 2024-2029 (%)
Data Table on Dairy - Year-over-year growth 2024-2029 (%)

8.5 Confectionery - Market size and forecast 2024-2029

Chart on Confectionery - Market size and forecast 2024-2029 ($ million)
Data Table on Confectionery - Market size and forecast 2024-2029 ($ million)
Chart on Confectionery - Year-over-year growth 2024-2029 (%)
Data Table on Confectionery - Year-over-year growth 2024-2029 (%)

8.6 Beverages - Market size and forecast 2024-2029

Chart on Beverages - Market size and forecast 2024-2029 ($ million)
Data Table on Beverages - Market size and forecast 2024-2029 ($ million)
Chart on Beverages - Year-over-year growth 2024-2029 (%)
Data Table on Beverages - Year-over-year growth 2024-2029 (%)

8.7 Others - Market size and forecast 2024-2029

Chart on Others - Market size and forecast 2024-2029 ($ million)
Data Table on Others - Market size and forecast 2024-2029 ($ million)
Chart on Others - Year-over-year growth 2024-2029 (%)
Data Table on Others - Year-over-year growth 2024-2029 (%)

8.8 Market opportunity by End-user

Market opportunity by End-user ($ million)
Data Table on Market opportunity by End-user ($ million)

9. Market Segmentation by Application

9.1 Market segments

Chart on Application - Market share 2024-2029 (%)
Data Table on Application - Market share 2024-2029 (%)

9.2 Comparison by Application

Chart on Comparison by Application
Data Table on Comparison by Application

9.3 Gelling agent - Market size and forecast 2024-2029

Chart on Gelling agent - Market size and forecast 2024-2029 ($ million)
Data Table on Gelling agent - Market size and forecast 2024-2029 ($ million)
Chart on Gelling agent - Year-over-year growth 2024-2029 (%)
Data Table on Gelling agent - Year-over-year growth 2024-2029 (%)

9.4 Thickener - Market size and forecast 2024-2029

Chart on Thickener - Market size and forecast 2024-2029 ($ million)
Data Table on Thickener - Market size and forecast 2024-2029 ($ million)
Chart on Thickener - Year-over-year growth 2024-2029 (%)
Data Table on Thickener - Year-over-year growth 2024-2029 (%)

9.5 Stabilizer - Market size and forecast 2024-2029

Chart on Stabilizer - Market size and forecast 2024-2029 ($ million)
Data Table on Stabilizer - Market size and forecast 2024-2029 ($ million)
Chart on Stabilizer - Year-over-year growth 2024-2029 (%)
Data Table on Stabilizer - Year-over-year growth 2024-2029 (%)

9.6 Fat replacer - Market size and forecast 2024-2029

Chart on Fat replacer - Market size and forecast 2024-2029 ($ million)
Data Table on Fat replacer - Market size and forecast 2024-2029 ($ million)
Chart on Fat replacer - Year-over-year growth 2024-2029 (%)
Data Table on Fat replacer - Year-over-year growth 2024-2029 (%)

9.7 Others - Market size and forecast 2024-2029

Chart on Others - Market size and forecast 2024-2029 ($ million)
Data Table on Others - Market size and forecast 2024-2029 ($ million)
Chart on Others - Year-over-year growth 2024-2029 (%)
Data Table on Others - Year-over-year growth 2024-2029 (%)

9.8 Market opportunity by Application

Market opportunity by Application ($ million)
Data Table on Market opportunity by Application ($ million)

10. Market Segmentation by Source

10.1 Market segments

Chart on Source - Market share 2024-2029 (%)
Data Table on Source - Market share 2024-2029 (%)

10.2 Comparison by Source

Chart on Comparison by Source
Data Table on Comparison by Source

10.3 Citrus peel - Market size and forecast 2024-2029

Chart on Citrus peel - Market size and forecast 2024-2029 ($ million)
Data Table on Citrus peel - Market size and forecast 2024-2029 ($ million)
Chart on Citrus peel - Year-over-year growth 2024-2029 (%)
Data Table on Citrus peel - Year-over-year growth 2024-2029 (%)

10.4 Apple pomace - Market size and forecast 2024-2029

Chart on Apple pomace - Market size and forecast 2024-2029 ($ million)
Data Table on Apple pomace - Market size and forecast 2024-2029 ($ million)
Chart on Apple pomace - Year-over-year growth 2024-2029 (%)
Data Table on Apple pomace - Year-over-year growth 2024-2029 (%)

10.5 Others - Market size and forecast 2024-2029

Chart on Others - Market size and forecast 2024-2029 ($ million)
Data Table on Others - Market size and forecast 2024-2029 ($ million)
Chart on Others - Year-over-year growth 2024-2029 (%)
Data Table on Others - Year-over-year growth 2024-2029 (%)

10.6 Market opportunity by Source

Market opportunity by Source ($ million)
Data Table on Market opportunity by Source ($ million)

11. Customer Landscape

11.1 Customer landscape overview

Analysis of price sensitivity, lifecycle, customer purchase basket, adoption rates, and purchase criteria

12. Geographic Landscape

12.1 Geographic segmentation

Chart on Market share by geography 2024-2029 (%)
Data Table on Market share by geography 2024-2029 (%)

12.2 Geographic comparison

Chart on Geographic comparison
Data Table on Geographic comparison

12.3 Europe - Market size and forecast 2024-2029

Chart on Europe - Market size and forecast 2024-2029 ($ million)
Data Table on Europe - Market size and forecast 2024-2029 ($ million)
Chart on Europe - Year-over-year growth 2024-2029 (%)
Data Table on Europe - Year-over-year growth 2024-2029 (%)
Chart on Regional Comparison - Europe
Data Table on Regional Comparison - Europe

12.3.1 Germany - Market size and forecast 2024-2029

Chart on Germany - Market size and forecast 2024-2029 ($ million)
Data Table on Germany - Market size and forecast 2024-2029 ($ million)
Chart on Germany - Year-over-year growth 2024-2029 (%)
Data Table on Germany - Year-over-year growth 2024-2029 (%)

12.3.2 UK - Market size and forecast 2024-2029

Chart on UK - Market size and forecast 2024-2029 ($ million)
Data Table on UK - Market size and forecast 2024-2029 ($ million)
Chart on UK - Year-over-year growth 2024-2029 (%)
Data Table on UK - Year-over-year growth 2024-2029 (%)

12.3.3 France - Market size and forecast 2024-2029

Chart on France - Market size and forecast 2024-2029 ($ million)
Data Table on France - Market size and forecast 2024-2029 ($ million)
Chart on France - Year-over-year growth 2024-2029 (%)
Data Table on France - Year-over-year growth 2024-2029 (%)

12.3.4 Italy - Market size and forecast 2024-2029

Chart on Italy - Market size and forecast 2024-2029 ($ million)
Data Table on Italy - Market size and forecast 2024-2029 ($ million)
Chart on Italy - Year-over-year growth 2024-2029 (%)
Data Table on Italy - Year-over-year growth 2024-2029 (%)

12.3.5 Spain - Market size and forecast 2024-2029

Chart on Spain - Market size and forecast 2024-2029 ($ million)
Data Table on Spain - Market size and forecast 2024-2029 ($ million)
Chart on Spain - Year-over-year growth 2024-2029 (%)
Data Table on Spain - Year-over-year growth 2024-2029 (%)

12.3.6 The Netherlands - Market size and forecast 2024-2029

Chart on The Netherlands - Market size and forecast 2024-2029 ($ million)
Data Table on The Netherlands - Market size and forecast 2024-2029 ($ million)
Chart on The Netherlands - Year-over-year growth 2024-2029 (%)
Data Table on The Netherlands - Year-over-year growth 2024-2029 (%)

12.4 North America - Market size and forecast 2024-2029

Chart on North America - Market size and forecast 2024-2029 ($ million)
Data Table on North America - Market size and forecast 2024-2029 ($ million)
Chart on North America - Year-over-year growth 2024-2029 (%)
Data Table on North America - Year-over-year growth 2024-2029 (%)
Chart on Regional Comparison - North America
Data Table on Regional Comparison - North America

12.4.1 US - Market size and forecast 2024-2029

Chart on US - Market size and forecast 2024-2029 ($ million)
Data Table on US - Market size and forecast 2024-2029 ($ million)
Chart on US - Year-over-year growth 2024-2029 (%)
Data Table on US - Year-over-year growth 2024-2029 (%)

12.4.2 Canada - Market size and forecast 2024-2029

Chart on Canada - Market size and forecast 2024-2029 ($ million)
Data Table on Canada - Market size and forecast 2024-2029 ($ million)
Chart on Canada - Year-over-year growth 2024-2029 (%)
Data Table on Canada - Year-over-year growth 2024-2029 (%)

12.4.3 Mexico - Market size and forecast 2024-2029

Chart on Mexico - Market size and forecast 2024-2029 ($ million)
Data Table on Mexico - Market size and forecast 2024-2029 ($ million)
Chart on Mexico - Year-over-year growth 2024-2029 (%)
Data Table on Mexico - Year-over-year growth 2024-2029 (%)

12.5 APAC - Market size and forecast 2024-2029

Chart on APAC - Market size and forecast 2024-2029 ($ million)
Data Table on APAC - Market size and forecast 2024-2029 ($ million)
Chart on APAC - Year-over-year growth 2024-2029 (%)
Data Table on APAC - Year-over-year growth 2024-2029 (%)
Chart on Regional Comparison - APAC
Data Table on Regional Comparison - APAC

12.5.1 China - Market size and forecast 2024-2029

Chart on China - Market size and forecast 2024-2029 ($ million)
Data Table on China - Market size and forecast 2024-2029 ($ million)
Chart on China - Year-over-year growth 2024-2029 (%)
Data Table on China - Year-over-year growth 2024-2029 (%)

12.5.2 Japan - Market size and forecast 2024-2029

Chart on Japan - Market size and forecast 2024-2029 ($ million)
Data Table on Japan - Market size and forecast 2024-2029 ($ million)
Chart on Japan - Year-over-year growth 2024-2029 (%)
Data Table on Japan - Year-over-year growth 2024-2029 (%)

12.5.3 India - Market size and forecast 2024-2029

Chart on India - Market size and forecast 2024-2029 ($ million)
Data Table on India - Market size and forecast 2024-2029 ($ million)
Chart on India - Year-over-year growth 2024-2029 (%)
Data Table on India - Year-over-year growth 2024-2029 (%)

12.5.4 South Korea - Market size and forecast 2024-2029

Chart on South Korea - Market size and forecast 2024-2029 ($ million)
Data Table on South Korea - Market size and forecast 2024-2029 ($ million)
Chart on South Korea - Year-over-year growth 2024-2029 (%)
Data Table on South Korea - Year-over-year growth 2024-2029 (%)

12.5.5 Australia - Market size and forecast 2024-2029

Chart on Australia - Market size and forecast 2024-2029 ($ million)
Data Table on Australia - Market size and forecast 2024-2029 ($ million)
Chart on Australia - Year-over-year growth 2024-2029 (%)
Data Table on Australia - Year-over-year growth 2024-2029 (%)

12.5.6 Indonesia - Market size and forecast 2024-2029

Chart on Indonesia - Market size and forecast 2024-2029 ($ million)
Data Table on Indonesia - Market size and forecast 2024-2029 ($ million)
Chart on Indonesia - Year-over-year growth 2024-2029 (%)
Data Table on Indonesia - Year-over-year growth 2024-2029 (%)

12.6 Middle East and Africa - Market size and forecast 2024-2029

Chart on Middle East and Africa - Market size and forecast 2024-2029 ($ million)
Data Table on Middle East and Africa - Market size and forecast 2024-2029 ($ million)
Chart on Middle East and Africa - Year-over-year growth 2024-2029 (%)
Data Table on Middle East and Africa - Year-over-year growth 2024-2029 (%)
Chart on Regional Comparison - Middle East and Africa
Data Table on Regional Comparison - Middle East and Africa

12.6.1 South Africa - Market size and forecast 2024-2029

Chart on South Africa - Market size and forecast 2024-2029 ($ million)
Data Table on South Africa - Market size and forecast 2024-2029 ($ million)
Chart on South Africa - Year-over-year growth 2024-2029 (%)
Data Table on South Africa - Year-over-year growth 2024-2029 (%)

12.6.2 UAE - Market size and forecast 2024-2029

Chart on UAE - Market size and forecast 2024-2029 ($ million)
Data Table on UAE - Market size and forecast 2024-2029 ($ million)
Chart on UAE - Year-over-year growth 2024-2029 (%)
Data Table on UAE - Year-over-year growth 2024-2029 (%)

12.6.3 Saudi Arabia - Market size and forecast 2024-2029

Chart on Saudi Arabia - Market size and forecast 2024-2029 ($ million)
Data Table on Saudi Arabia - Market size and forecast 2024-2029 ($ million)
Chart on Saudi Arabia - Year-over-year growth 2024-2029 (%)
Data Table on Saudi Arabia - Year-over-year growth 2024-2029 (%)

12.6.4 Israel - Market size and forecast 2024-2029

Chart on Israel - Market size and forecast 2024-2029 ($ million)
Data Table on Israel - Market size and forecast 2024-2029 ($ million)
Chart on Israel - Year-over-year growth 2024-2029 (%)
Data Table on Israel - Year-over-year growth 2024-2029 (%)

12.6.5 Turkey - Market size and forecast 2024-2029

Chart on Turkey - Market size and forecast 2024-2029 ($ million)
Data Table on Turkey - Market size and forecast 2024-2029 ($ million)
Chart on Turkey - Year-over-year growth 2024-2029 (%)
Data Table on Turkey - Year-over-year growth 2024-2029 (%)

12.7 South America - Market size and forecast 2024-2029

Chart on South America - Market size and forecast 2024-2029 ($ million)
Data Table on South America - Market size and forecast 2024-2029 ($ million)
Chart on South America - Year-over-year growth 2024-2029 (%)
Data Table on South America - Year-over-year growth 2024-2029 (%)
Chart on Regional Comparison - South America
Data Table on Regional Comparison - South America

12.7.1 Brazil - Market size and forecast 2024-2029

Chart on Brazil - Market size and forecast 2024-2029 ($ million)
Data Table on Brazil - Market size and forecast 2024-2029 ($ million)
Chart on Brazil - Year-over-year growth 2024-2029 (%)
Data Table on Brazil - Year-over-year growth 2024-2029 (%)

12.7.2 Argentina - Market size and forecast 2024-2029

Chart on Argentina - Market size and forecast 2024-2029 ($ million)
Data Table on Argentina - Market size and forecast 2024-2029 ($ million)
Chart on Argentina - Year-over-year growth 2024-2029 (%)
Data Table on Argentina - Year-over-year growth 2024-2029 (%)

12.7.3 Colombia - Market size and forecast 2024-2029

Chart on Colombia - Market size and forecast 2024-2029 ($ million)
Data Table on Colombia - Market size and forecast 2024-2029 ($ million)
Chart on Colombia - Year-over-year growth 2024-2029 (%)
Data Table on Colombia - Year-over-year growth 2024-2029 (%)

12.8 Market opportunity by geography

Market opportunity by geography ($ million)
Data Tables on Market opportunity by geography ($ million)

13. Drivers, Challenges, and Opportunity

13.1 Market drivers

Increasing demand for natural and plant-based ingredients
Growth in convenience food and beverage industry
Advancements in food processing and technology

13.2 Market challenges

Raw material availability and price volatility
Competition from alternative hydrocolloids
Complex regulatory landscape and quality control

13.3 Impact of drivers and challenges

Impact of drivers and challenges in 2024 and 2029

13.4 Market opportunities

Rise of plant-based food and beverage products
Growing consumer preference for clean label ingredients
Expansion of functional food and nutraceutical applications

14. Competitive Landscape

14.1 Overview

14.2

Overview on criticality of inputs and factors of differentiation

14.3 Landscape disruption

Overview on factors of disruption

14.4 Industry risks

Impact of key risks on business

15. Competitive Analysis

15.1 Companies profiled

Companies covered

15.2 Company ranking index

15.3 Market positioning of companies

Matrix on companies position and classification

15.4 Agar Corp.

Agar Corp. - Overview
Agar Corp. - Product / Service
Agar Corp. - Key offerings
SWOT

15.5 Cargill Inc.

Cargill Inc. - Overview
Cargill Inc. - Product / Service
Cargill Inc. - Key offerings
SWOT

15.6 Compania Espanola S.A.

Compania Espanola S.A. - Overview
Compania Espanola S.A. - Product / Service
Compania Espanola S.A. - Key offerings
SWOT

15.7 Condio GmbH

Condio GmbH - Overview
Condio GmbH - Product / Service
Condio GmbH - Key offerings
SWOT

15.8 DSM Firmenich AG

DSM Firmenich AG - Overview
DSM Firmenich AG - Product / Service
DSM Firmenich AG - Key offerings
SWOT

15.9 DuPont de Nemours Inc.

DuPont de Nemours Inc. - Overview
DuPont de Nemours Inc. - Business segments
DuPont de Nemours Inc. - Key news
DuPont de Nemours Inc. - Key offerings
DuPont de Nemours Inc. - Segment focus
SWOT

15.10 Herbstreith and Fox GmbH

Herbstreith and Fox GmbH - Overview
Herbstreith and Fox GmbH - Product / Service
Herbstreith and Fox GmbH - Key offerings
SWOT

15.11 Ingredion Inc.

Ingredion Inc. - Overview
Ingredion Inc. - Business segments
Ingredion Inc. - Key news
Ingredion Inc. - Key offerings
Ingredion Inc. - Segment focus
SWOT

15.12 J. Rettenmaier and Sohne

J. Rettenmaier and Sohne - Overview
J. Rettenmaier and Sohne - Product / Service
J. Rettenmaier and Sohne - Key offerings
SWOT

15.13 Krishna Pectins Pvt. Ltd.

Krishna Pectins Pvt. Ltd. - Overview
Krishna Pectins Pvt. Ltd. - Product / Service
Krishna Pectins Pvt. Ltd. - Key offerings
SWOT

15.14 Maspex

Maspex - Overview
Maspex - Product / Service
Maspex - Key offerings
SWOT

15.15 Polygal Inc.

Polygal Inc. - Overview
Polygal Inc. - Product / Service
Polygal Inc. - Key offerings
SWOT

15.16 Silvateam Spa

Silvateam Spa - Overview
Silvateam Spa - Product / Service
Silvateam Spa - Key offerings
SWOT

15.17 Tate and Lyle PLC

Tate and Lyle PLC - Overview
Tate and Lyle PLC - Business segments
Tate and Lyle PLC - Key news
Tate and Lyle PLC - Key offerings
Tate and Lyle PLC - Segment focus
SWOT

15.18 The Kraft Heinz Co

The Kraft Heinz Co - Overview
The Kraft Heinz Co - Business segments
The Kraft Heinz Co - Key news
The Kraft Heinz Co - Key offerings
The Kraft Heinz Co - Segment focus
SWOT

16. Appendix

16.1 Scope of the report

Market definition
Objectives
Notes and caveats

16.2 Inclusions and exclusions checklist

Inclusions checklist
Exclusions checklist

16.3 Currency conversion rates for US$

16.4 Research methodology

16.5 Data procurement

Information sources

16.6 Data validation

16.7 Validation techniques employed for market sizing

16.8 Data synthesis

16.9 360 degree market analysis

16.10 List of abbreviations

Research Methodology

Technavio presents a detailed picture of the market by way of study, synthesis, and summation of data from multiple sources. The analysts have presented the various facets of the market with a particular focus on identifying the key industry influencers. The data thus presented is comprehensive, reliable, and the result of extensive research, both primary and secondary.

INFORMATION SOURCES

Primary sources

  • Manufacturers and suppliers
  • Channel partners
  • Industry experts
  • Strategic decision makers

Secondary sources

  • Industry journals and periodicals
  • Government data
  • Financial reports of key industry players
  • Historical data
  • Press releases

DATA ANALYSIS

Data Synthesis

  • Collation of data
  • Estimation of key figures
  • Analysis of derived insights

Data Validation

  • Triangulation with data models
  • Reference against proprietary databases
  • Corroboration with industry experts

REPORT WRITING

Qualitative

  • Market drivers
  • Market challenges
  • Market trends
  • Five forces analysis

Quantitative

  • Market size and forecast
  • Market segmentation
  • Geographical insights
  • Competitive landscape

Interested in this report?

Get your sample now to see our research methodology and insights!

Download Now

Frequently Asked Questions

Pectin market growth will increase by USD 848.2 million during 2025-2029.

The Pectin market is expected to grow at a CAGR of 9% during 2025-2029.

Pectin market is segmented by End-user (Food and bakery, Dairy, Confectionery, Beverages, Others) Application (Gelling agent, Thickener, Stabilizer, Fat replacer, Others) Source (Citrus peel, Apple pomace, Others)

Agar Corp., Al Sedanah Jordan LLC, Cargill Inc., Compania Espanola S.A., Condio GmbH, Devson Impex Pvt. Ltd., DSM Firmenich AG, DuPont de Nemours Inc., Herbstreith and Fox GmbH, Ingredion Inc., J. Rettenmaier and Sohne, Jinfeng Technology Co. Ltd., Krishna Pectins Pvt. Ltd., Maspex, Polygal Inc., Silvateam Spa, Tate and Lyle PLC, The Kraft Heinz Co are a few of the key vendors in the Pectin market.

North America will register the highest growth rate of 32.3% among the other regions. Therefore, the Pectin market in North America is expected to garner significant business opportunities for the vendors during the forecast period.

Germany, UK, France, Italy, Spain, The Netherlands, US, Canada, Mexico, China, Japan, India, South Korea, Australia, Indonesia, South Africa, UAE, Saudi Arabia, Israel, Turkey, Brazil, Argentina, Colombia

  • Increasing demand for natural and plant-based ingredients is the driving factor this market.

The Pectin market vendors should focus on grabbing business opportunities from the End-user segment as it accounted for the largest market share in the base year.