Personal Flotation Devices Market Analysis, Size, and Forecast 2026-2030: North America (US, Canada, and Mexico), APAC (China, Japan, and India), Europe (Germany, UK, and France), South America (Brazil and Argentina), Middle East and Africa (Saudi Arabia, South Africa, and UAE), and Rest of World (ROW)

Personal Flotation Devices Market Analysis, Size, and Forecast 2026-2030:
North America (US, Canada, and Mexico), APAC (China, Japan, and India), Europe (Germany, UK, and France), South America (Brazil and Argentina), Middle East and Africa (Saudi Arabia, South Africa, and UAE), and Rest of World (ROW)

Published: Mar 2026 305 Pages SKU: IRTNTR43218

Market Overview at a Glance

$2.08 B
Market Opportunity
4.9%
CAGR 2025 - 2030
30%
APAC Growth
$1.88 B
Type I segment 2024

Personal Flotation Devices Market Size 2026-2030

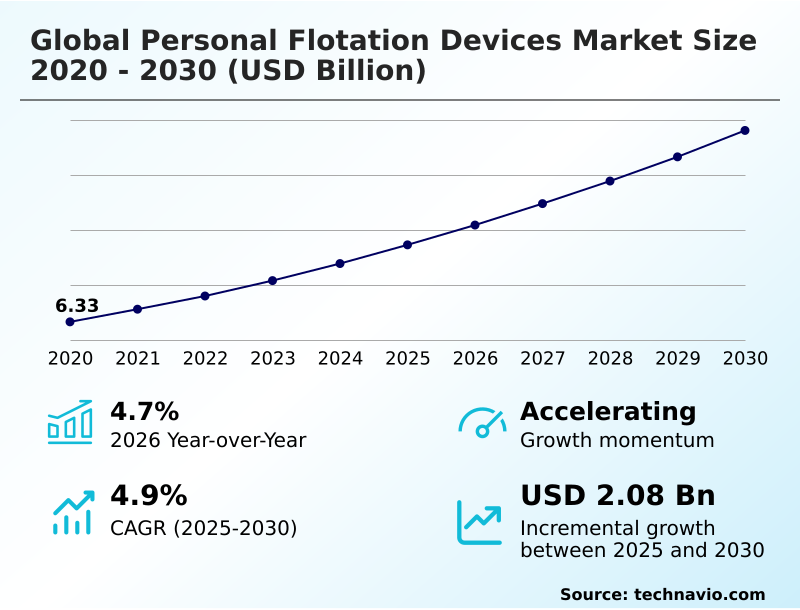
The personal flotation devices market size is valued to increase by USD 2.08 billion, at a CAGR of 4.9% from 2025 to 2030. Rising participation in diverse water sports and adventure tourism will drive the personal flotation devices market.

Major Market Trends & Insights

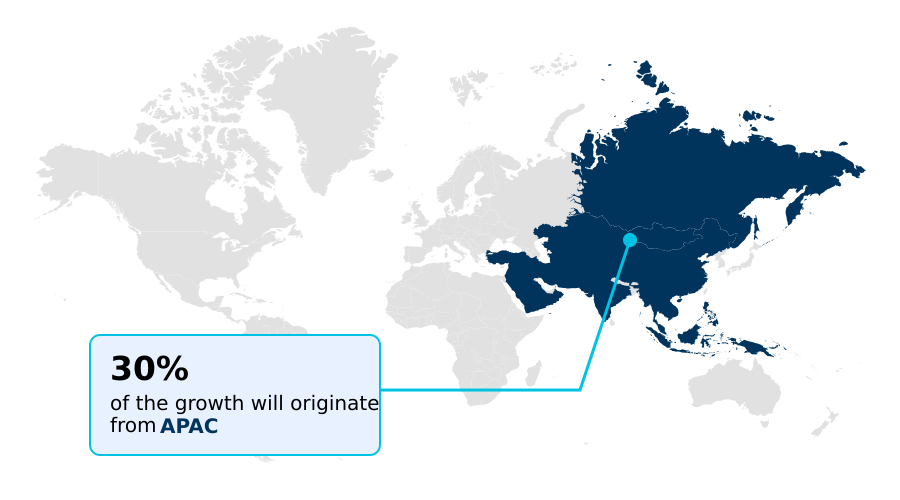
  • APAC dominated the market and accounted for a 30% growth during the forecast period.
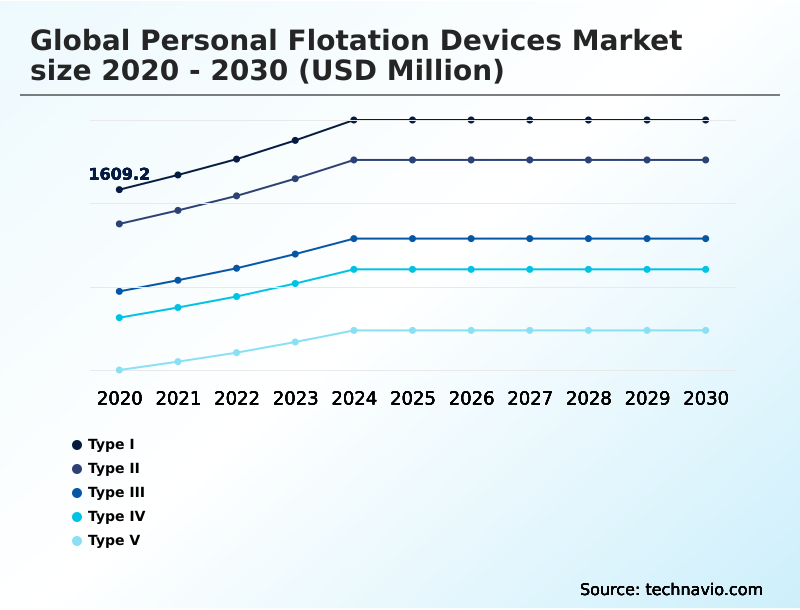
  • By Product - Type I segment was valued at USD 1.88 billion in 2024
  • By End-user - Oil and gas industry segment accounted for the largest market revenue share in 2024

Market Size & Forecast

  • Market Opportunities: USD 3.47 billion
  • Market Future Opportunities: USD 2.08 billion
  • CAGR from 2025 to 2030 : 4.9%

Market Summary

  • The Personal Flotation Devices market is undergoing a significant transformation, moving from basic passive safety equipment to sophisticated, integrated survival systems. This evolution is driven by stringent regulatory updates, such as the adoption of a performance-based level system, and a growing consumer base in recreational boating and water sports.
  • Key trends include the integration of smart technology, such as iot-integrated rescue capabilities and biometric sensor integration, which enhances user safety and rescue efficiency. Concurrently, there is a strong push toward sustainability, with manufacturers developing pvc-free foams and utilizing recycled materials.
  • A commercial fleet operator, for instance, can now equip its crew with a smart flotation vest that not only provides buoyancy but also transmits real-time location and health data to a central command. This improves emergency response times, ensures compliance with the imo life-saving appliance code, and can lower insurance premiums by demonstrating a proactive approach to risk management.
  • However, the high costs of R&D and regulatory compliance for these advanced inherently buoyant materials and systems present a considerable challenge for market participants.

What will be the Size of the Personal Flotation Devices Market during the forecast period?

Get Key Insights on Market Forecast (PDF) Request Free Sample

How is the Personal Flotation Devices Market Segmented?

The personal flotation devices industry research report provides comprehensive data (region-wise segment analysis), with forecasts and estimates in "USD million" for the period 2026-2030, as well as historical data from 2020-2024 for the following segments.

  • Product
    • Type I
    • Type II
    • Type III
    • Type IV
    • Type V
  • End-user
    • Oil and gas industry
    • Aquaculture industry
    • Naval industry
    • Others
  • Distribution channel
    • Specialty stores
    • Online sales channels
    • Company-owned outlets
    • Others
  • Geography
    • North America
      • US
      • Canada
      • Mexico
    • APAC
      • China
      • Japan
      • India
    • Europe
      • Germany
      • UK
      • France
    • South America
      • Brazil
      • Argentina
    • Middle East and Africa
      • Saudi Arabia
      • South Africa
      • UAE
    • Rest of World (ROW)

By Product Insights

The type i segment is estimated to witness significant growth during the forecast period.

The Type I segment, also known as offshore life jackets, is evolving beyond traditional classifications toward a performance-based level system. These devices, engineered for rough or remote waters, are now categorized by their newton buoyancy rating, emphasizing actual flotation power.

This transition impacts commercial sectors requiring high-buoyancy offshore pfd models with superior face-up turning capabilities. The growth in wellness tourism, which has expanded by nearly 30%, also influences demand for reliable recreational boating safety gear.

Innovations in smart flotation vest technology and high-visibility textiles are critical.

For industrial maritime workwear and professional rescue pfd applications, the focus remains on integrating features like a submersible gps transmitter and ensuring compliance with updated in-water performance testing protocols, making the maritime safety appliance more effective.

Request Free Sample

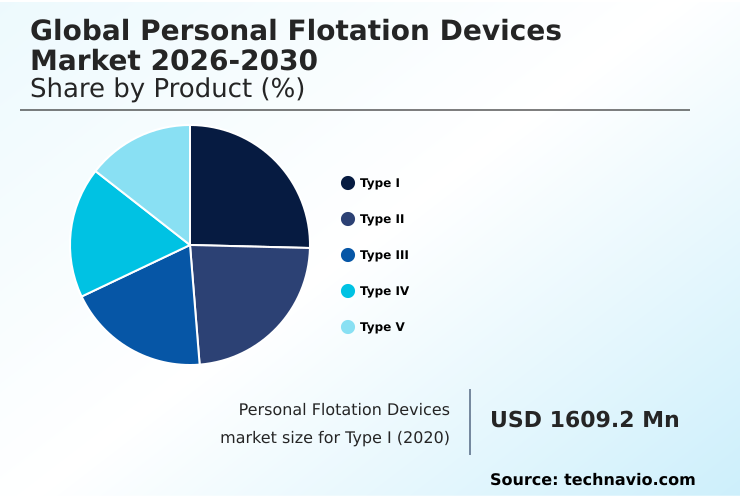
The Type I segment was valued at USD 1.88 billion in 2024 and showed a gradual increase during the forecast period.

Request Free Sample

Regional Analysis

APAC is estimated to contribute 30% to the growth of the global market during the forecast period.Technavio’s analysts have elaborately explained the regional trends and drivers that shape the market during the forecast period.

See How Personal Flotation Devices Market Demand is Rising in APAC Request Free Sample

The geographic landscape of the personal flotation devices market is diverse, with distinct drivers shaping regional dynamics.

In North America and Europe, which together represent a significant portion of the market, growth is propelled by stringent regulations and the adoption of high-performance gear such as the offshore energy work vest and special-use flotation device.

These mature markets focus on innovations like hydrostatic inflator technology and fall-arrest harness integration. In contrast, APAC is the fastest-growing region, contributing over 30% of the market's incremental growth.

This expansion is fueled by rising disposable incomes, increased participation in water sports, and major investments in maritime infrastructure, driving demand for a high volume of equipment, including the commercial fishing life jacket and gear for an aquaculture worker pfd.

The adoption of circular manufacturing protocols and lightweight ergonomic pfd designs is a global trend, with regional adaptations catering to specific environmental and commercial needs.

Market Dynamics

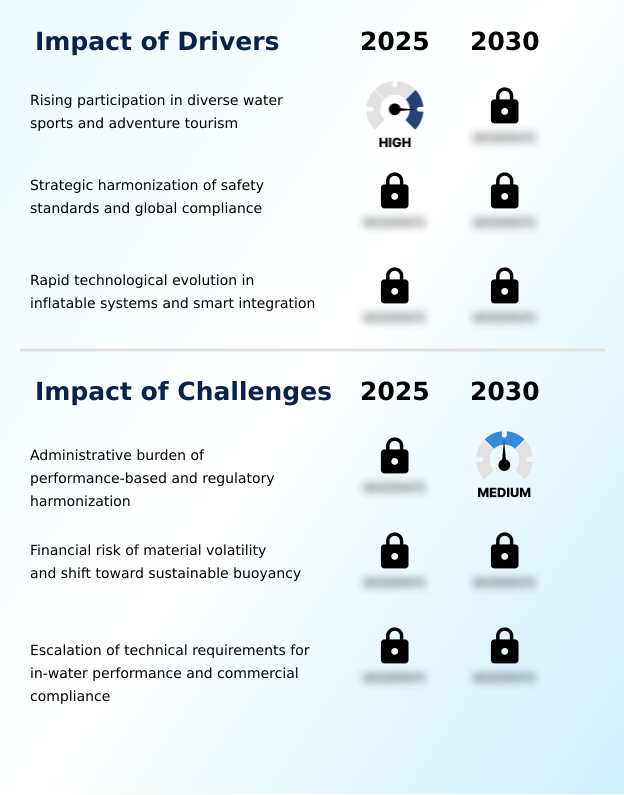
Our researchers analyzed the data with 2025 as the base year, along with the key drivers, trends, and challenges. A holistic analysis of drivers will help companies refine their marketing strategies to gain a competitive advantage.

  • The personal flotation devices market is navigating a complex technical and regulatory environment. Key boardroom discussions revolve around the hydrostatic inflator vs automatic inflator debate, the cost of certifying new materials, and the challenges of dual production lines needed to serve both harmonized and legacy markets.
  • The uscg harmonized approval process cost has become a significant factor in strategic planning, compelling a focus on modular designs. Innovations are centered on meeting buoyancy requirements for offshore work and improving in-water performance for unconscious wearers, which involves rigorous testing protocols for turning ability.
  • The integration of smart technology, such as integrating gps into life jackets and leveraging iot for real-time location tracking, is transforming survival gear. This includes the rise of biometric monitoring in survival gear.
  • Simultaneously, the industry is addressing sustainability through the adoption of a circular economy in safety equipment, exploring sustainable alternatives to pvc foam, and recycling ocean plastics for pfds. The ergonomic design for paddle sports remains a key growth area, alongside the development of hybrid foam and inflatable vests.
  • The impact of material cost volatility continues to be a challenge, while solutions combining fall arrest and flotation integration offer new value, improving safety compliance reporting efficiency by over 25% compared to separate systems.
  • These shifts are influenced by regulatory changes in lifejacket labeling and the need to enhance thermal protection in cold water, driving demand for advanced performance standards for rescue vests.

What are the key market drivers leading to the rise in the adoption of Personal Flotation Devices Industry?

  • The market's growth is primarily driven by the rising global participation in diverse water sports and adventure tourism, which creates a strong demand for specialized safety equipment.

  • Rising participation in water sports and the harmonization of safety standards are key market drivers. A nearly 30% growth in wellness-related tourism has amplified demand for specialized gear like the stand-up paddleboarding vest and inflatable sailing harness.
  • This trend pushes manufacturers to create products with enhanced ergonomics and functionality. Simultaneously, the strategic harmonization of standards, such as the adoption of ansi/can/ul 12402 standards, is streamlining cross-border trade.
  • This regulatory alignment allows manufacturers to reduce time-to-market for new products by as much as 25% by eliminating redundant testing.
  • This dual-engine growth, fueled by both consumer activity and regulatory efficiency, is fostering innovation in areas like the solas passenger lifejacket and equipment for search and rescue equipment, ensuring greater safety and market stability.

What are the market trends shaping the Personal Flotation Devices Industry?

  • The market is trending toward the integration of AI-enabled wearable safety devices and IoT-based rescue ecosystems. This evolution transforms passive buoyancy aids into proactive survival tools.

  • The personal flotation devices market is advancing through the institutionalization of intelligent safety ecosystems. The integration of an esp-32 microcontroller into a smart life safety jacket enables real-time health monitoring, reducing emergency response times by up to 40% in some simulations. This trend transforms a standard throwable flotation device or near-shore buoyant vest into a proactive diagnostic hub.
  • Another key trend is the move toward eco-friendly marine safety, driven by consumer demand and regulations. The market for eco-friendly textiles and bio-based foams is projected to expand at a compounded annual growth rate of over 12%.
  • This shift involves using materials like bio-based buoyancy foam and developing products like the anti-exposure suit with a minimal environmental footprint, aligning with global sustainability goals without compromising on the critical buoyancy-to-weight ratio.

What challenges does the Personal Flotation Devices Industry face during its growth?

  • A key market challenge is the significant administrative and financial burden associated with the industry-wide shift toward performance-based standards and regulatory harmonization.

  • The personal flotation devices market faces significant challenges from regulatory transitions and material cost volatility. The administrative burden of complying with new performance-based standards is substantial, requiring manufacturers to retool production lines and conduct expensive high-fidelity testing, which can increase go-to-market costs by 15-20% for new products.
  • This is particularly difficult for those supplying equipment like a white-water rafting vest or military tactical flotation gear. Furthermore, the reliance on petroleum-based foams and high-performance fabrics exposes the industry to price fluctuations.
  • The rising costs of industrial-grade synthetic fabrics and metal components for inflatable mechanisms have added up to a 10% increase in annual operational costs for some manufacturers, compressing profit margins and hindering investment in next-generation technology like hybrid buoyancy systems or advanced thermal protection gear.

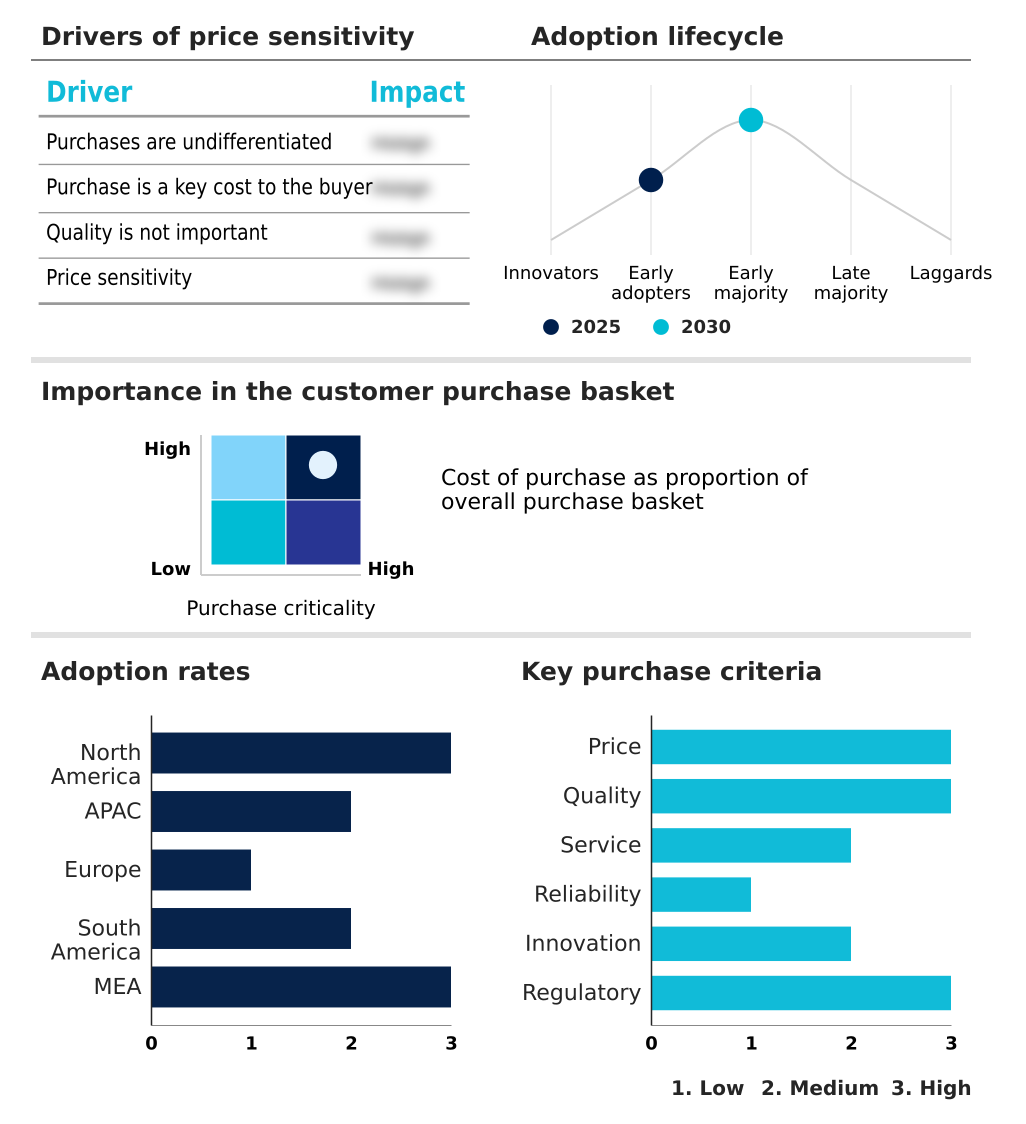
Exclusive Technavio Analysis on Customer Landscape

The personal flotation devices market forecasting report includes the adoption lifecycle of the market, covering from the innovator’s stage to the laggard’s stage. It focuses on adoption rates in different regions based on penetration. Furthermore, the personal flotation devices market report also includes key purchase criteria and drivers of price sensitivity to help companies evaluate and develop their market growth analysis strategies.

Customer Landscape of Personal Flotation Devices Industry

Competitive Landscape

Companies are implementing various strategies, such as strategic alliances, personal flotation devices market forecast, partnerships, mergers and acquisitions, geographical expansion, and product/service launches, to enhance their presence in the industry.

Astral Buoyancy Co. - Offerings focus on specialized, high-performance personal flotation devices, featuring ergonomic designs tailored for specific water sports and professional applications, ensuring enhanced safety and mobility.

The industry research and growth report includes detailed analyses of the competitive landscape of the market and information about key companies, including:

  • Astral Buoyancy Co.
  • Baltic Safety Products AB
  • Helly Hansen AS
  • International Safety Products
  • Kent Safety Products
  • Kokatat Inc.
  • Mullion PFD
  • Mustang Survival Corp.
  • Newell Brands Inc.
  • NRS Inc.
  • Onyx Outdoor
  • Palm Equipment International Ltd
  • Plastimo Group
  • SeaSafe Systems Ltd.
  • Spinlock Ltd.
  • Stohlquist
  • Survitec Group Ltd.
  • VIKING Life-Saving Equipment AS
  • Zodiac Nautic Group

Qualitative and quantitative analysis of companies has been conducted to help clients understand the wider business environment as well as the strengths and weaknesses of key industry players. Data is qualitatively analyzed to categorize companies as pure play, category-focused, industry-focused, and diversified; it is quantitatively analyzed to categorize companies as dominant, leading, strong, tentative, and weak.

Recent Development and News in Personal flotation devices market

  • In September 2024, a leading manufacturer announced a new line of smart personal flotation devices featuring integrated biometric sensors and GPS tracking for the professional offshore market.
  • In January 2025, the United States Coast Guard officially implemented the Lifejacket Approval Harmonization final rule, transitioning from legacy type classifications to a performance-based level system.
  • In February 2025, VIKING Life-Saving Equipment AS expanded its production capacity by opening a new state-of-the-art facility in Norway dedicated to specialized boats and advanced safety equipment.
  • In May 2025, a key industry player launched a new range of eco-friendly personal flotation devices made from recycled ocean plastics and bio-based foams, meeting rising consumer demand for sustainability.

Dive into Technavio’s robust research methodology, blending expert interviews, extensive data synthesis, and validated models for unparalleled Personal Flotation Devices Market insights. See full methodology.

Market Scope
Page number 305
Base year 2025
Historic period 2020-2024
Forecast period 2026-2030
Growth momentum & CAGR Accelerate at a CAGR of 4.9%
Market growth 2026-2030 USD 2077.6 million
Market structure Fragmented
YoY growth 2025-2026(%) 4.7%
Key countries US, Canada, Mexico, China, Japan, India, South Korea, Australia, Indonesia, Germany, UK, France, Italy, Spain, The Netherlands, Brazil, Argentina, Chile, Saudi Arabia, South Africa, UAE, Turkey and Israel
Competitive landscape Leading Companies, Market Positioning of Companies, Competitive Strategies, and Industry Risks

Request Free Sample

Research Analyst Overview

  • The personal flotation devices market is transitioning from passive safety aids to integrated survival systems, a shift compelling boardroom decisions on R&D investment into smart and sustainable technologies.
  • The adoption of a performance-based level system is standardizing safety metrics like the newton buoyancy rating, while the integration of an automated emergency beacon, personal locator beacons, and automatic identification system transponders is becoming critical. Advanced wearable safety device models now feature water-activated inflation and biometric sensor integration.
  • This pivot toward a smart flotation vest with iot-integrated rescue capabilities is reshaping product strategies. Manufacturers are focusing on enhancing face-up turning capabilities and self-righting capability, especially for offshore applications. The use of advanced materials such as closed-cell foam, high-visibility textiles, and recycled ripstop nylon is now mainstream. Innovations in hydrostatic release unit design and man-overboard modules further augment safety.
  • Furthermore, the market for eco-friendly textiles and bio-based foams is projected to expand at a rate of over 12%, signaling a definitive move toward sustainable yet high-performance solutions.

What are the Key Data Covered in this Personal Flotation Devices Market Research and Growth Report?

  • What is the expected growth of the Personal Flotation Devices Market between 2026 and 2030?

    • USD 2.08 billion, at a CAGR of 4.9%

  • What segmentation does the market report cover?

    • The report is segmented by Product (Type I, Type II, Type III, Type IV, and Type V), End-user (Oil and gas industry, Aquaculture industry, Naval industry, and Others), Distribution Channel (Specialty stores, Online sales channels, Company-owned outlets, and Others) and Geography (North America, APAC, Europe, South America, Middle East and Africa)

  • Which regions are analyzed in the report?

    • North America, APAC, Europe, South America and Middle East and Africa

  • What are the key growth drivers and market challenges?

    • Rising participation in diverse water sports and adventure tourism, Administrative burden of performance-based and regulatory harmonization

  • Who are the major players in the Personal Flotation Devices Market?

    • Astral Buoyancy Co., Baltic Safety Products AB, Helly Hansen AS, International Safety Products, Kent Safety Products, Kokatat Inc., Mullion PFD, Mustang Survival Corp., Newell Brands Inc., NRS Inc., Onyx Outdoor, Palm Equipment International Ltd, Plastimo Group, SeaSafe Systems Ltd., Spinlock Ltd., Stohlquist, Survitec Group Ltd., VIKING Life-Saving Equipment AS and Zodiac Nautic Group

Market Research Insights

  • Market dynamics are shaped by a dual focus on regulatory compliance and user-centric innovation. The push for us coast guard approval and alignment with the imo life-saving appliance code drives technical advancements in areas like the cold-water immersion suit and industrial maritime workwear. This results in efficiency gains, with harmonized standards reducing certification costs for multinational exports by over 15%.
  • Concurrently, a nearly 30% surge in wellness-related tourism fuels demand for specialized gear like the paddlesports flotation aid, kayak fishing pfd design, and low-profile inflatable vest. The integration of smart technology is also pivotal; a smart life safety jacket can now provide telemetry data that reduces search and rescue operational timelines, showcasing how safety and efficiency are becoming increasingly intertwined.
  • This creates opportunities for manufacturers of child-specific safety gear and those focused on eco-friendly marine safety to differentiate their offerings.

We can help! Our analysts can customize this personal flotation devices market research report to meet your requirements.

Get in touch

1. Executive Summary

1.1 Market overview

Executive Summary - Chart on Market Overview
Executive Summary - Data Table on Market Overview
Executive Summary - Chart on Global Market Characteristics
Executive Summary - Chart on Market by Geography
Executive Summary - Chart on Market Segmentation by Product
Executive Summary - Chart on Market Segmentation by End-user
Executive Summary - Chart on Market Segmentation by Distribution Channel
Executive Summary - Chart on Incremental Growth
Executive Summary - Data Table on Incremental Growth
Executive Summary - Chart on Company Market Positioning

2. Technavio Analysis

2.1 Analysis of price sensitivity, lifecycle, customer purchase basket, adoption rates, and purchase criteria

2.2 Criticality of inputs and Factors of differentiation

Chart on Overview on criticality of inputs and factors of differentiation

2.3 Factors of disruption

Chart on Overview on factors of disruption

2.4 Impact of drivers and challenges

Chart on Impact of drivers and challenges in 2025 and 2030

3. Market Landscape

3.1 Market ecosystem

Chart on Parent Market
Data Table on - Parent Market

3.2 Market characteristics

Chart on Market characteristics analysis

3.3 Value chain analysis

Chart on Value chain analysis

4. Market Sizing

4.1 Market definition

Data Table on Offerings of companies included in the market definition

4.2 Market segment analysis

Market segments

4.3 Market size 2025

4.4 Market outlook: Forecast for 2025-2030

Chart on Global - Market size and forecast 2025-2030 ($ million)
Data Table on Global - Market size and forecast 2025-2030 ($ million)
Chart on Global Market: Year-over-year growth 2025-2030 (%)
Data Table on Global Market: Year-over-year growth 2025-2030 (%)

5. Historic Market Size

5.1 Global Personal Flotation Devices Market 2020 - 2024

Historic Market Size - Data Table on Global Personal Flotation Devices Market 2020 - 2024 ($ million)

5.2 Product segment analysis 2020 - 2024

Historic Market Size - Product Segment 2020 - 2024 ($ million)

5.3 End-user segment analysis 2020 - 2024

Historic Market Size - End-user Segment 2020 - 2024 ($ million)

5.4 Distribution Channel segment analysis 2020 - 2024

Historic Market Size - Distribution Channel Segment 2020 - 2024 ($ million)

5.5 Geography segment analysis 2020 - 2024

Historic Market Size - Geography Segment 2020 - 2024 ($ million)

5.6 Country segment analysis 2020 - 2024

Historic Market Size - Country Segment 2020 - 2024 ($ million)

6. Qualitative Analysis

6.1 Impact of AI in global personal flotation devices market

6.2 Impact of geopolitical conflict for global personal flotation devices market

7. Five Forces Analysis

7.1 Five forces summary

Five forces analysis - Comparison between 2025 and 2030

7.2 Bargaining power of buyers

Bargaining power of buyers - Impact of key factors 2025 and 2030

7.3 Bargaining power of suppliers

Bargaining power of suppliers - Impact of key factors in 2025 and 2030

7.4 Threat of new entrants

Threat of new entrants - Impact of key factors in 2025 and 2030

7.5 Threat of substitutes

Threat of substitutes - Impact of key factors in 2025 and 2030

7.6 Threat of rivalry

Threat of rivalry - Impact of key factors in 2025 and 2030

7.7 Market condition

Chart on Market condition - Five forces 2025 and 2030

8. Market Segmentation by Product

8.1 Market segments

Chart on Product - Market share 2025-2030 (%)
Data Table on Product - Market share 2025-2030 (%)

8.2 Comparison by Product

Chart on Comparison by Product
Data Table on Comparison by Product

8.3 Type I - Market size and forecast 2025-2030

Chart on Type I - Market size and forecast 2025-2030 ($ million)
Data Table on Type I - Market size and forecast 2025-2030 ($ million)
Chart on Type I - Year-over-year growth 2025-2030 (%)
Data Table on Type I - Year-over-year growth 2025-2030 (%)

8.4 Type II - Market size and forecast 2025-2030

Chart on Type II - Market size and forecast 2025-2030 ($ million)
Data Table on Type II - Market size and forecast 2025-2030 ($ million)
Chart on Type II - Year-over-year growth 2025-2030 (%)
Data Table on Type II - Year-over-year growth 2025-2030 (%)

8.5 Type III - Market size and forecast 2025-2030

Chart on Type III - Market size and forecast 2025-2030 ($ million)
Data Table on Type III - Market size and forecast 2025-2030 ($ million)
Chart on Type III - Year-over-year growth 2025-2030 (%)
Data Table on Type III - Year-over-year growth 2025-2030 (%)

8.6 Type IV - Market size and forecast 2025-2030

Chart on Type IV - Market size and forecast 2025-2030 ($ million)
Data Table on Type IV - Market size and forecast 2025-2030 ($ million)
Chart on Type IV - Year-over-year growth 2025-2030 (%)
Data Table on Type IV - Year-over-year growth 2025-2030 (%)

8.7 Type V - Market size and forecast 2025-2030

Chart on Type V - Market size and forecast 2025-2030 ($ million)
Data Table on Type V - Market size and forecast 2025-2030 ($ million)
Chart on Type V - Year-over-year growth 2025-2030 (%)
Data Table on Type V - Year-over-year growth 2025-2030 (%)

8.8 Market opportunity by Product

Market opportunity by Product ($ million)
Data Table on Market opportunity by Product ($ million)

9. Market Segmentation by End-user

9.1 Market segments

Chart on End-user - Market share 2025-2030 (%)
Data Table on End-user - Market share 2025-2030 (%)

9.2 Comparison by End-user

Chart on Comparison by End-user
Data Table on Comparison by End-user

9.3 Oil and gas industry - Market size and forecast 2025-2030

Chart on Oil and gas industry - Market size and forecast 2025-2030 ($ million)
Data Table on Oil and gas industry - Market size and forecast 2025-2030 ($ million)
Chart on Oil and gas industry - Year-over-year growth 2025-2030 (%)
Data Table on Oil and gas industry - Year-over-year growth 2025-2030 (%)

9.4 Aquaculture industry - Market size and forecast 2025-2030

Chart on Aquaculture industry - Market size and forecast 2025-2030 ($ million)
Data Table on Aquaculture industry - Market size and forecast 2025-2030 ($ million)
Chart on Aquaculture industry - Year-over-year growth 2025-2030 (%)
Data Table on Aquaculture industry - Year-over-year growth 2025-2030 (%)

9.5 Naval industry - Market size and forecast 2025-2030

Chart on Naval industry - Market size and forecast 2025-2030 ($ million)
Data Table on Naval industry - Market size and forecast 2025-2030 ($ million)
Chart on Naval industry - Year-over-year growth 2025-2030 (%)
Data Table on Naval industry - Year-over-year growth 2025-2030 (%)

9.6 Others - Market size and forecast 2025-2030

Chart on Others - Market size and forecast 2025-2030 ($ million)
Data Table on Others - Market size and forecast 2025-2030 ($ million)
Chart on Others - Year-over-year growth 2025-2030 (%)
Data Table on Others - Year-over-year growth 2025-2030 (%)

9.7 Market opportunity by End-user

Market opportunity by End-user ($ million)
Data Table on Market opportunity by End-user ($ million)

10. Market Segmentation by Distribution Channel

10.1 Market segments

Chart on Distribution Channel - Market share 2025-2030 (%)
Data Table on Distribution Channel - Market share 2025-2030 (%)

10.2 Comparison by Distribution Channel

Chart on Comparison by Distribution Channel
Data Table on Comparison by Distribution Channel

10.3 Specialty stores - Market size and forecast 2025-2030

Chart on Specialty stores - Market size and forecast 2025-2030 ($ million)
Data Table on Specialty stores - Market size and forecast 2025-2030 ($ million)
Chart on Specialty stores - Year-over-year growth 2025-2030 (%)
Data Table on Specialty stores - Year-over-year growth 2025-2030 (%)

10.4 Online sales channels - Market size and forecast 2025-2030

Chart on Online sales channels - Market size and forecast 2025-2030 ($ million)
Data Table on Online sales channels - Market size and forecast 2025-2030 ($ million)
Chart on Online sales channels - Year-over-year growth 2025-2030 (%)
Data Table on Online sales channels - Year-over-year growth 2025-2030 (%)

10.5 Company-owned outlets - Market size and forecast 2025-2030

Chart on Company-owned outlets - Market size and forecast 2025-2030 ($ million)
Data Table on Company-owned outlets - Market size and forecast 2025-2030 ($ million)
Chart on Company-owned outlets - Year-over-year growth 2025-2030 (%)
Data Table on Company-owned outlets - Year-over-year growth 2025-2030 (%)

10.6 Others - Market size and forecast 2025-2030

Chart on Others - Market size and forecast 2025-2030 ($ million)
Data Table on Others - Market size and forecast 2025-2030 ($ million)
Chart on Others - Year-over-year growth 2025-2030 (%)
Data Table on Others - Year-over-year growth 2025-2030 (%)

10.7 Market opportunity by Distribution Channel

Market opportunity by Distribution Channel ($ million)
Data Table on Market opportunity by Distribution Channel ($ million)

11. Customer Landscape

11.1 Customer landscape overview

Analysis of price sensitivity, lifecycle, customer purchase basket, adoption rates, and purchase criteria

12. Geographic Landscape

12.1 Geographic segmentation

Chart on Market share by geography 2025-2030 (%)
Data Table on Market share by geography 2025-2030 (%)

12.2 Geographic comparison

Chart on Geographic comparison
Data Table on Geographic comparison

12.3 North America - Market size and forecast 2025-2030

Chart on North America - Market size and forecast 2025-2030 ($ million)
Data Table on North America - Market size and forecast 2025-2030 ($ million)
Chart on North America - Year-over-year growth 2025-2030 (%)
Data Table on North America - Year-over-year growth 2025-2030 (%)
Chart on Regional Comparison - North America
Data Table on Regional Comparison - North America

12.3.1 US - Market size and forecast 2025-2030

Chart on US - Market size and forecast 2025-2030 ($ million)
Data Table on US - Market size and forecast 2025-2030 ($ million)
Chart on US - Year-over-year growth 2025-2030 (%)
Data Table on US - Year-over-year growth 2025-2030 (%)

12.3.2 Canada - Market size and forecast 2025-2030

Chart on Canada - Market size and forecast 2025-2030 ($ million)
Data Table on Canada - Market size and forecast 2025-2030 ($ million)
Chart on Canada - Year-over-year growth 2025-2030 (%)
Data Table on Canada - Year-over-year growth 2025-2030 (%)

12.3.3 Mexico - Market size and forecast 2025-2030

Chart on Mexico - Market size and forecast 2025-2030 ($ million)
Data Table on Mexico - Market size and forecast 2025-2030 ($ million)
Chart on Mexico - Year-over-year growth 2025-2030 (%)
Data Table on Mexico - Year-over-year growth 2025-2030 (%)

12.4 APAC - Market size and forecast 2025-2030

Chart on APAC - Market size and forecast 2025-2030 ($ million)
Data Table on APAC - Market size and forecast 2025-2030 ($ million)
Chart on APAC - Year-over-year growth 2025-2030 (%)
Data Table on APAC - Year-over-year growth 2025-2030 (%)
Chart on Regional Comparison - APAC
Data Table on Regional Comparison - APAC

12.4.1 China - Market size and forecast 2025-2030

Chart on China - Market size and forecast 2025-2030 ($ million)
Data Table on China - Market size and forecast 2025-2030 ($ million)
Chart on China - Year-over-year growth 2025-2030 (%)
Data Table on China - Year-over-year growth 2025-2030 (%)

12.4.2 Japan - Market size and forecast 2025-2030

Chart on Japan - Market size and forecast 2025-2030 ($ million)
Data Table on Japan - Market size and forecast 2025-2030 ($ million)
Chart on Japan - Year-over-year growth 2025-2030 (%)
Data Table on Japan - Year-over-year growth 2025-2030 (%)

12.4.3 India - Market size and forecast 2025-2030

Chart on India - Market size and forecast 2025-2030 ($ million)
Data Table on India - Market size and forecast 2025-2030 ($ million)
Chart on India - Year-over-year growth 2025-2030 (%)
Data Table on India - Year-over-year growth 2025-2030 (%)

12.4.4 South Korea - Market size and forecast 2025-2030

Chart on South Korea - Market size and forecast 2025-2030 ($ million)
Data Table on South Korea - Market size and forecast 2025-2030 ($ million)
Chart on South Korea - Year-over-year growth 2025-2030 (%)
Data Table on South Korea - Year-over-year growth 2025-2030 (%)

12.4.5 Australia - Market size and forecast 2025-2030

Chart on Australia - Market size and forecast 2025-2030 ($ million)
Data Table on Australia - Market size and forecast 2025-2030 ($ million)
Chart on Australia - Year-over-year growth 2025-2030 (%)
Data Table on Australia - Year-over-year growth 2025-2030 (%)

12.4.6 Indonesia - Market size and forecast 2025-2030

Chart on Indonesia - Market size and forecast 2025-2030 ($ million)
Data Table on Indonesia - Market size and forecast 2025-2030 ($ million)
Chart on Indonesia - Year-over-year growth 2025-2030 (%)
Data Table on Indonesia - Year-over-year growth 2025-2030 (%)

12.5 Europe - Market size and forecast 2025-2030

Chart on Europe - Market size and forecast 2025-2030 ($ million)
Data Table on Europe - Market size and forecast 2025-2030 ($ million)
Chart on Europe - Year-over-year growth 2025-2030 (%)
Data Table on Europe - Year-over-year growth 2025-2030 (%)
Chart on Regional Comparison - Europe
Data Table on Regional Comparison - Europe

12.5.1 Germany - Market size and forecast 2025-2030

Chart on Germany - Market size and forecast 2025-2030 ($ million)
Data Table on Germany - Market size and forecast 2025-2030 ($ million)
Chart on Germany - Year-over-year growth 2025-2030 (%)
Data Table on Germany - Year-over-year growth 2025-2030 (%)

12.5.2 UK - Market size and forecast 2025-2030

Chart on UK - Market size and forecast 2025-2030 ($ million)
Data Table on UK - Market size and forecast 2025-2030 ($ million)
Chart on UK - Year-over-year growth 2025-2030 (%)
Data Table on UK - Year-over-year growth 2025-2030 (%)

12.5.3 France - Market size and forecast 2025-2030

Chart on France - Market size and forecast 2025-2030 ($ million)
Data Table on France - Market size and forecast 2025-2030 ($ million)
Chart on France - Year-over-year growth 2025-2030 (%)
Data Table on France - Year-over-year growth 2025-2030 (%)

12.5.4 Italy - Market size and forecast 2025-2030

Chart on Italy - Market size and forecast 2025-2030 ($ million)
Data Table on Italy - Market size and forecast 2025-2030 ($ million)
Chart on Italy - Year-over-year growth 2025-2030 (%)
Data Table on Italy - Year-over-year growth 2025-2030 (%)

12.5.5 Spain - Market size and forecast 2025-2030

Chart on Spain - Market size and forecast 2025-2030 ($ million)
Data Table on Spain - Market size and forecast 2025-2030 ($ million)
Chart on Spain - Year-over-year growth 2025-2030 (%)
Data Table on Spain - Year-over-year growth 2025-2030 (%)

12.5.6 The Netherlands - Market size and forecast 2025-2030

Chart on The Netherlands - Market size and forecast 2025-2030 ($ million)
Data Table on The Netherlands - Market size and forecast 2025-2030 ($ million)
Chart on The Netherlands - Year-over-year growth 2025-2030 (%)
Data Table on The Netherlands - Year-over-year growth 2025-2030 (%)

12.6 South America - Market size and forecast 2025-2030

Chart on South America - Market size and forecast 2025-2030 ($ million)
Data Table on South America - Market size and forecast 2025-2030 ($ million)
Chart on South America - Year-over-year growth 2025-2030 (%)
Data Table on South America - Year-over-year growth 2025-2030 (%)
Chart on Regional Comparison - South America
Data Table on Regional Comparison - South America

12.6.1 Brazil - Market size and forecast 2025-2030

Chart on Brazil - Market size and forecast 2025-2030 ($ million)
Data Table on Brazil - Market size and forecast 2025-2030 ($ million)
Chart on Brazil - Year-over-year growth 2025-2030 (%)
Data Table on Brazil - Year-over-year growth 2025-2030 (%)

12.6.2 Argentina - Market size and forecast 2025-2030

Chart on Argentina - Market size and forecast 2025-2030 ($ million)
Data Table on Argentina - Market size and forecast 2025-2030 ($ million)
Chart on Argentina - Year-over-year growth 2025-2030 (%)
Data Table on Argentina - Year-over-year growth 2025-2030 (%)

12.6.3 Chile - Market size and forecast 2025-2030

Chart on Chile - Market size and forecast 2025-2030 ($ million)
Data Table on Chile - Market size and forecast 2025-2030 ($ million)
Chart on Chile - Year-over-year growth 2025-2030 (%)
Data Table on Chile - Year-over-year growth 2025-2030 (%)

12.7 Middle East and Africa - Market size and forecast 2025-2030

Chart on Middle East and Africa - Market size and forecast 2025-2030 ($ million)
Data Table on Middle East and Africa - Market size and forecast 2025-2030 ($ million)
Chart on Middle East and Africa - Year-over-year growth 2025-2030 (%)
Data Table on Middle East and Africa - Year-over-year growth 2025-2030 (%)
Chart on Regional Comparison - Middle East and Africa
Data Table on Regional Comparison - Middle East and Africa

12.7.1 Saudi Arabia - Market size and forecast 2025-2030

Chart on Saudi Arabia - Market size and forecast 2025-2030 ($ million)
Data Table on Saudi Arabia - Market size and forecast 2025-2030 ($ million)
Chart on Saudi Arabia - Year-over-year growth 2025-2030 (%)
Data Table on Saudi Arabia - Year-over-year growth 2025-2030 (%)

12.7.2 South Africa - Market size and forecast 2025-2030

Chart on South Africa - Market size and forecast 2025-2030 ($ million)
Data Table on South Africa - Market size and forecast 2025-2030 ($ million)
Chart on South Africa - Year-over-year growth 2025-2030 (%)
Data Table on South Africa - Year-over-year growth 2025-2030 (%)

12.7.3 UAE - Market size and forecast 2025-2030

Chart on UAE - Market size and forecast 2025-2030 ($ million)
Data Table on UAE - Market size and forecast 2025-2030 ($ million)
Chart on UAE - Year-over-year growth 2025-2030 (%)
Data Table on UAE - Year-over-year growth 2025-2030 (%)

12.7.4 Turkey - Market size and forecast 2025-2030

Chart on Turkey - Market size and forecast 2025-2030 ($ million)
Data Table on Turkey - Market size and forecast 2025-2030 ($ million)
Chart on Turkey - Year-over-year growth 2025-2030 (%)
Data Table on Turkey - Year-over-year growth 2025-2030 (%)

12.7.5 Israel - Market size and forecast 2025-2030

Chart on Israel - Market size and forecast 2025-2030 ($ million)
Data Table on Israel - Market size and forecast 2025-2030 ($ million)
Chart on Israel - Year-over-year growth 2025-2030 (%)
Data Table on Israel - Year-over-year growth 2025-2030 (%)

12.8 Market opportunity by geography

Market opportunity by geography ($ million)
Data Tables on Market opportunity by geography ($ million)

13. Drivers, Challenges, and Opportunity

13.1 Market drivers

Rising participation in diverse water sports and adventure tourism
Strategic harmonization of safety standards and global compliance
Rapid technological evolution in inflatable systems and smart integration

13.2 Market challenges

Administrative burden of performance-based and regulatory harmonization
Financial risk of material volatility and shift toward sustainable buoyancy
Escalation of technical requirements for in-water performance and commercial compliance

13.3 Impact of drivers and challenges

Impact of drivers and challenges in 2025 and 2030

13.4 Market opportunities

Integration of AI-enabled wearable safety and IoT-integrated rescue
Growth of sustainable material science and circular manufacturing protocols
Expansion of harmonized global standards and hybrid designs

14. Competitive Landscape

14.1 Overview

14.2

Overview on criticality of inputs and factors of differentiation

14.3 Landscape disruption

Overview on factors of disruption

14.4 Industry risks

Impact of key risks on business

15. Competitive Analysis

15.1 Companies profiled

Companies covered

15.2 Company ranking index

15.3 Market positioning of companies

Matrix on companies position and classification

15.4 Astral Buoyancy Co.

Astral Buoyancy Co. - Overview
Astral Buoyancy Co. - Product / Service
Astral Buoyancy Co. - Key offerings
SWOT

15.5 Helly Hansen AS

Helly Hansen AS - Overview
Helly Hansen AS - Product / Service
Helly Hansen AS - Key offerings
SWOT

15.6 International Safety Products

International Safety Products - Overview
International Safety Products - Product / Service
International Safety Products - Key offerings
SWOT

15.7 Kokatat Inc.

Kokatat Inc. - Overview
Kokatat Inc. - Product / Service
Kokatat Inc. - Key offerings
SWOT

15.8 Mullion PFD

Mullion PFD - Overview
Mullion PFD - Product / Service
Mullion PFD - Key offerings
SWOT

15.9 Newell Brands Inc.

Newell Brands Inc. - Overview
Newell Brands Inc. - Business segments
Newell Brands Inc. - Key offerings
Newell Brands Inc. - Segment focus
SWOT

15.10 NRS Inc.

NRS Inc. - Overview
NRS Inc. - Product / Service
NRS Inc. - Key offerings
SWOT

15.11 Onyx Outdoor

Onyx Outdoor - Overview
Onyx Outdoor - Product / Service
Onyx Outdoor - Key offerings
SWOT

15.12 Palm Equipment International Ltd

Palm Equipment International Ltd - Overview
Palm Equipment International Ltd - Product / Service
Palm Equipment International Ltd - Key offerings
SWOT

15.13 Plastimo Group

Plastimo Group - Overview
Plastimo Group - Product / Service
Plastimo Group - Key offerings
SWOT

15.14 SeaSafe Systems Ltd.

SeaSafe Systems Ltd. - Overview
SeaSafe Systems Ltd. - Product / Service
SeaSafe Systems Ltd. - Key offerings
SWOT

15.15 Spinlock Ltd.

Spinlock Ltd. - Overview
Spinlock Ltd. - Product / Service
Spinlock Ltd. - Key offerings
SWOT

15.16 Survitec Group Ltd.

Survitec Group Ltd. - Overview
Survitec Group Ltd. - Product / Service
Survitec Group Ltd. - Key offerings
SWOT

15.17 VIKING Life-Saving Equipment AS

VIKING Life-Saving Equipment AS - Overview
VIKING Life-Saving Equipment AS - Product / Service
VIKING Life-Saving Equipment AS - Key offerings
SWOT

15.18 Zodiac Nautic Group

Zodiac Nautic Group - Overview
Zodiac Nautic Group - Product / Service
Zodiac Nautic Group - Key offerings
SWOT

16. Appendix

16.1 Scope of the report

Market definition
Objectives
Notes and caveats

16.2 Inclusions and exclusions checklist

Inclusions checklist
Exclusions checklist

16.3 Currency conversion rates for US$

16.4 Research methodology

16.5 Data procurement

Information sources

16.6 Data validation

16.7 Validation techniques employed for market sizing

16.8 Data synthesis

16.9 360 degree market analysis

16.10 List of abbreviations

Research Methodology

Technavio presents a detailed picture of the market by way of study, synthesis, and summation of data from multiple sources. The analysts have presented the various facets of the market with a particular focus on identifying the key industry influencers. The data thus presented is comprehensive, reliable, and the result of extensive research, both primary and secondary.

INFORMATION SOURCES

Primary sources

  • Manufacturers and suppliers
  • Channel partners
  • Industry experts
  • Strategic decision makers

Secondary sources

  • Industry journals and periodicals
  • Government data
  • Financial reports of key industry players
  • Historical data
  • Press releases

DATA ANALYSIS

Data Synthesis

  • Collation of data
  • Estimation of key figures
  • Analysis of derived insights

Data Validation

  • Triangulation with data models
  • Reference against proprietary databases
  • Corroboration with industry experts

REPORT WRITING

Qualitative

  • Market drivers
  • Market challenges
  • Market trends
  • Five forces analysis

Quantitative

  • Market size and forecast
  • Market segmentation
  • Geographical insights
  • Competitive landscape

Interested in this report?

Get your sample now to see our research methodology and insights!

Download Now

Frequently Asked Questions

Personal Flotation Devices market growth will increase by USD 2077.6 million during 2026-2030.

The Personal Flotation Devices market is expected to grow at a CAGR of 4.9% during 2026-2030.

Personal Flotation Devices market is segmented by Product (Type I, Type II, Type III, Type IV, Type V) End-user (Oil and gas industry, Aquaculture industry, Naval industry, Others) Distribution channel (Specialty stores, Online sales channels, Company-owned outlets, Others)

Astral Buoyancy Co., Baltic Safety Products AB, Helly Hansen AS, International Safety Products, Kent Safety Products, Kokatat Inc., Mullion PFD, Mustang Survival Corp., Newell Brands Inc., NRS Inc., Onyx Outdoor, Palm Equipment International Ltd, Plastimo Group, SeaSafe Systems Ltd., Spinlock Ltd., Stohlquist, Survitec Group Ltd., VIKING Life-Saving Equipment AS, Zodiac Nautic Group are a few of the key vendors in the Personal Flotation Devices market.

APAC will register the highest growth rate of 30% among the other regions. Therefore, the Personal Flotation Devices market in APAC is expected to garner significant business opportunities for the vendors during the forecast period.

US, Canada, Mexico, China, Japan, India, South Korea, Australia, Indonesia, Germany, UK, France, Italy, Spain, The Netherlands, Brazil, Argentina, Chile, Saudi Arabia, South Africa, UAE, Turkey, Israel

  • Rising participation in diverse water sports and adventure tourism is the driving factor this market.

The Personal Flotation Devices market vendors should focus on grabbing business opportunities from the Product segment as it accounted for the largest market share in the base year.
RIA - Research AI Assistant
Ask RIA