Pet Insurance Market Analysis, Size, and Forecast 2026-2030: North America (US, Canada, and Mexico), Europe (UK, Germany, and France), APAC (Japan, Australia, and China), South America (Brazil and Argentina), Middle East and Africa (South Africa, UAE, and Saudi Arabia), and Rest of World (ROW)

Pet Insurance Market Analysis, Size, and Forecast 2026-2030:
North America (US, Canada, and Mexico), Europe (UK, Germany, and France), APAC (Japan, Australia, and China), South America (Brazil and Argentina), Middle East and Africa (South Africa, UAE, and Saudi Arabia), and Rest of World (ROW)

Published: Mar 2026 282 Pages SKU: IRTNTR71603

Market Overview at a Glance

$85.88 B
Market Opportunity
45.5%
CAGR 2025 - 2030
58.4%
North America Growth
$5.73 B
Dogs segment 2024

Pet Insurance Market Size 2026-2030

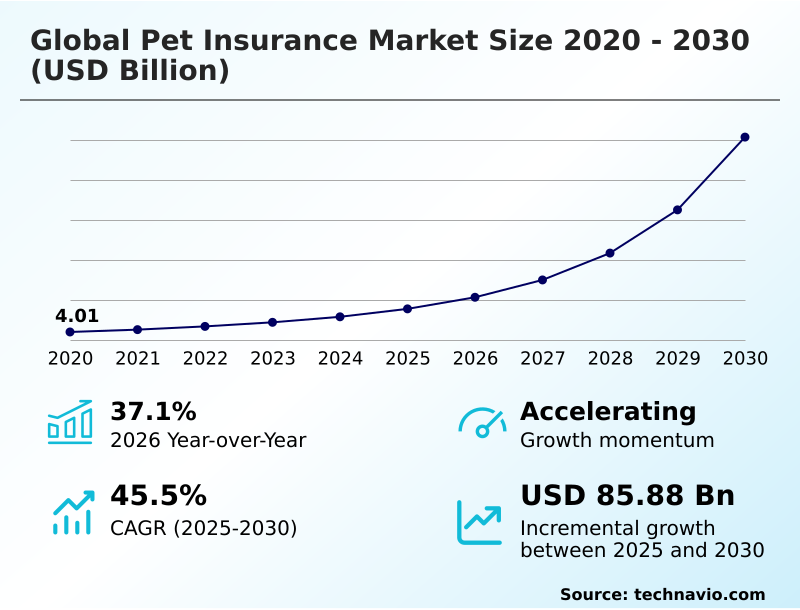
The pet insurance market size is valued to increase by USD 85.88 billion, at a CAGR of 45.5% from 2025 to 2030. Increasing cost and sophistication of veterinary care will drive the pet insurance market.

Major Market Trends & Insights

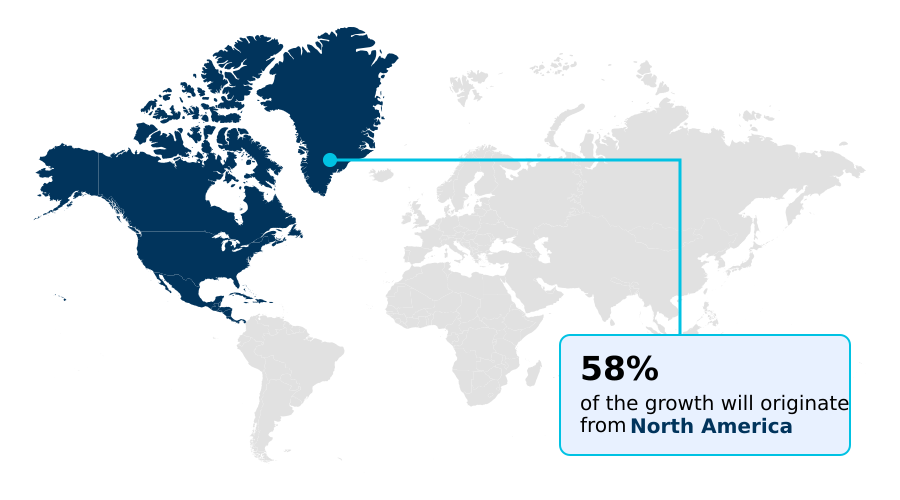
  • North America dominated the market and accounted for a 58.4% growth during the forecast period.
  • By Type - Dogs segment was valued at USD 5.73 billion in 2024
  • By Application - Accidents and illness segment accounted for the largest market revenue share in 2024

Market Size & Forecast

  • Market Opportunities: USD 97.45 billion
  • Market Future Opportunities: USD 85.88 billion
  • CAGR from 2025 to 2030 : 45.5%

Market Summary

  • The pet insurance market is undergoing a significant transformation, shaped by the humanization of pets and rising veterinary care costs. Owners increasingly view pets as family members, creating demand for advanced medical treatments that mirror human healthcare, which in turn strengthens the case for financial protection.
  • This has spurred a competitive landscape where insurers focus on product innovation, offering policies that range from basic accident coverage to comprehensive plans that include wellness and preventative care. A key trend is the integration of technology, where insurtech firms are revolutionizing the customer experience with digital platforms for policy management and rapid claims processing.
  • For example, a provider utilizing a claims automation system can process routine reimbursements in hours instead of weeks, a critical efficiency gain for both the business and the policyholder. However, the industry grapples with challenges like educating consumers on complex policy details, such as pre-existing condition exclusion clauses and deductible and copay structure, which can lead to confusion.
  • Navigating the varied regulatory compliance framework across different regions also presents operational hurdles for insurers aiming for global scale, impacting the development of standardized pet health protection plans.

What will be the Size of the Pet Insurance Market during the forecast period?

Get Key Insights on Market Forecast (PDF) Request Free Sample

How is the Pet Insurance Market Segmented?

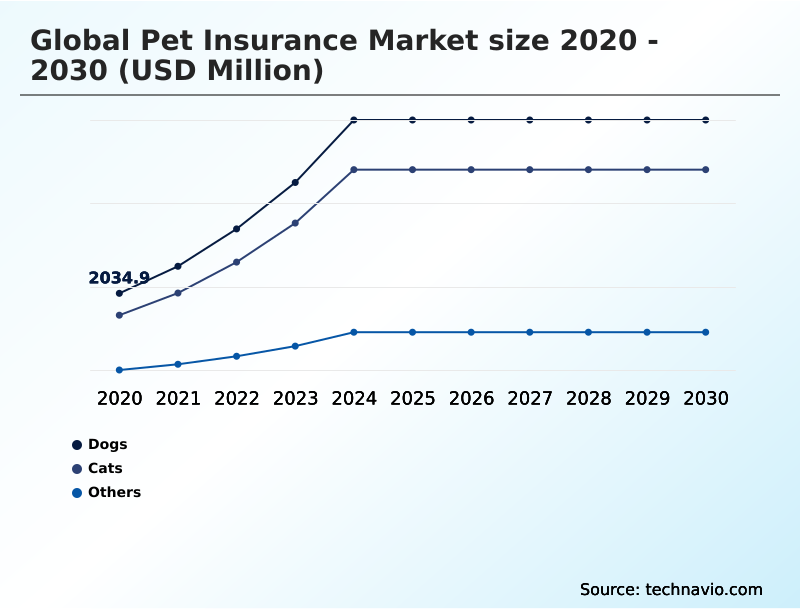
The pet insurance industry research report provides comprehensive data (region-wise segment analysis), with forecasts and estimates in "USD million" for the period 2026-2030, as well as historical data from 2020-2024 for the following segments.

  • Type
    • Dogs
    • Cats
    • Others
  • Application
    • Accidents and illness
    • Accidents only
    • Others
  • Channel
    • Direct sales
    • Broker or agency
    • Bancassurance
  • Geography
    • North America
      • US
      • Canada
      • Mexico
    • Europe
      • UK
      • Germany
      • France
    • APAC
      • Japan
      • Australia
      • China
    • South America
      • Brazil
      • Argentina
    • Middle East and Africa
      • South Africa
      • UAE
      • Saudi Arabia
    • Rest of World (ROW)

By Type Insights

The dogs segment is estimated to witness significant growth during the forecast period.

The dogs segment represents the most significant component of the pet insurance market, driven by high ownership rates and the substantial costs associated with veterinary care.

The financial logic for canine health coverage is compelling, as active lifestyles and genetic predispositions make dogs susceptible to accidents and chronic conditions.

Insurers utilize sophisticated breed-specific risk assessment to price policies, accounting for the likelihood of hereditary disorder coverage claims for conditions like hip dysplasia or cardiac disease.

While comprehensive accident and illness coverage is standard, there is growing demand for wellness and preventative care riders.

Consumers are increasingly focused on understanding pet insurance policies to find the best pet insurance for dogs, with providers developing tailored pet health protection plans that deliver clear value and mitigate the risk of high-cost events, where claim payouts have been shown to be 35% higher for certain purebreds.

Request Free Sample

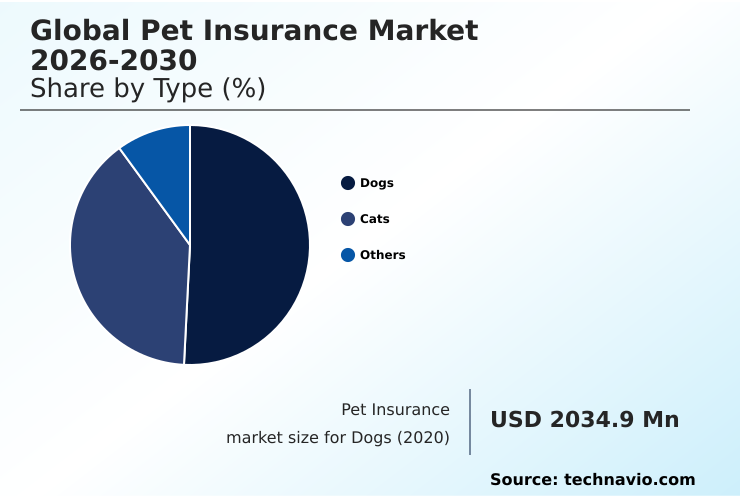
The Dogs segment was valued at USD 5.73 billion in 2024 and showed a gradual increase during the forecast period.

Request Free Sample

Regional Analysis

North America is estimated to contribute 58.4% to the growth of the global market during the forecast period.Technavio’s analysts have elaborately explained the regional trends and drivers that shape the market during the forecast period.

See How Pet Insurance Market Demand is Rising in North America Request Free Sample

The geographic landscape of the pet insurance market is led by North America, which accounts for over 58% of the incremental growth.

This dominance is driven by high veterinary care costs and a mature market for orthopedic surgery coverage and cancer treatment for pets. Europe follows, with high penetration rates in countries like the UK.

The APAC region is an emerging market with significant potential. Navigating varied pet insurance regulations and establishing a robust regulatory compliance framework are key for expansion.

The insurtech integration trend is global, improving the claims adjudication process and enabling features like direct-to-vet payments.

In North America, the cost for some advanced procedures is up to 40% higher than in European markets, amplifying the need for insurance as a pet emergency fund alternative and driving sophisticated underwriting and risk pooling strategies.

Market Dynamics

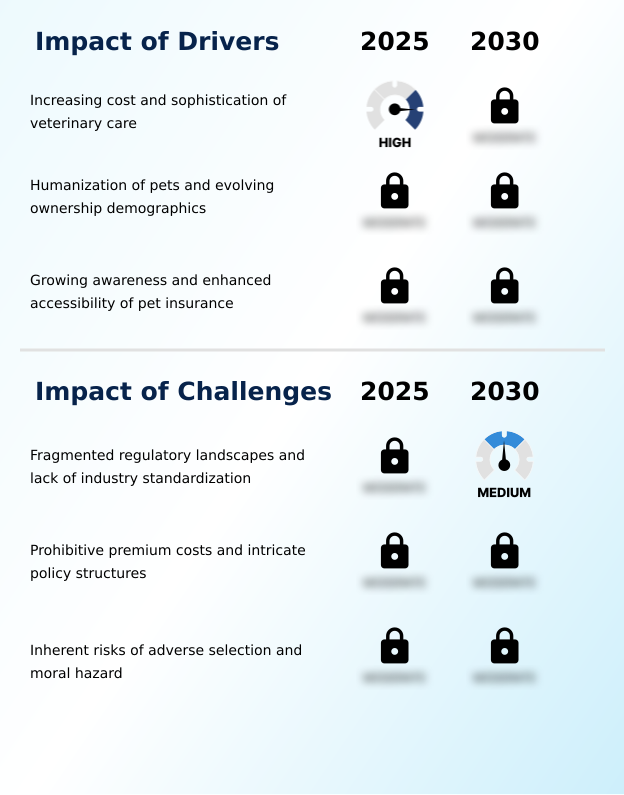
Our researchers analyzed the data with 2025 as the base year, along with the key drivers, trends, and challenges. A holistic analysis of drivers will help companies refine their marketing strategies to gain a competitive advantage.

  • Navigating the pet insurance market requires understanding its core components and consumer questions. A common query is how does pet insurance deductible work, which is fundamental to managing out-of-pocket costs. Consumers frequently compare accident and illness pet plans to balance coverage with affordability, while also considering the cost of pet insurance for large breeds, which can be significantly higher.
  • A key debate is is preventative care for pets worth it, with many providers now evaluating pet insurance wellness add-ons to meet this demand. A major point of contention for consumers is understanding what pre-existing conditions are not covered, which requires carefully navigating pet insurance policy exclusions.
  • The process of how to file a pet insurance claim online has been simplified by technology, addressing a historical pain point. Prospective buyers often want to know the benefits of pet insurance for puppies, which includes early coverage before conditions develop. They must decide between lifetime vs annual pet insurance policies, a critical choice for long-term care.
  • The challenge of finding pet insurance with no waiting period is another key consideration, as is sourcing pet insurance for senior cats with health issues. Policyholders need to be clear on understanding pet insurance reimbursement levels and can pet insurance be used for dental care. Ultimately, knowing how to choose a pet insurance provider is crucial.
  • A pivotal innovation is pet insurance with direct veterinarian payment, which can reduce administrative overhead for insurers by over 25% compared to traditional reimbursement models. This addresses what is adverse selection in pet insurance by fostering closer vet-insurer relationships and helps with using pet insurance for emergency vet visits.
  • Finally, strong pet insurance coverage for genetic conditions is a deciding factor for many, highlighting the role of insurtech in modern pet insurance in creating more transparent and accessible products.

What are the key market drivers leading to the rise in the adoption of Pet Insurance Industry?

  • The primary driver for market expansion is the concurrent escalation in the cost and sophistication of veterinary healthcare.

  • The primary market driver is the escalating cost of veterinary care, which strengthens the value of veterinary bill insurance.
  • As treatments for cancer for pets and other serious ailments become more advanced, their costs can be 5-10 times higher than for minor issues, making a comprehensive pet care plan essential.
  • This financial reality pushes consumers toward seeking accident and illness coverage to manage the risk of catastrophic expenses. Providers use sophisticated actuarial data analysis to design deductible and copay structure options that balance affordability with robust veterinary expense reimbursement.
  • Educating consumers on understanding pet insurance policies, particularly the nuances of pre-existing condition exclusion and coverage for pet insurance for chronic conditions, remains critical for market expansion and converting interest into sustained policy adoption.

What are the market trends shaping the Pet Insurance Industry?

  • A defining trend is the profound and accelerating integration of technology across the entire value chain, propelled by the disruptive influence of insurance technology (insurtech) firms.

  • A defining trend is the deep insurtech integration reshaping the market. The rise of the digital pet insurance provider has made digital claims submission standard, with platforms reporting a 60% reduction in submission errors compared to paper-based methods. This tech-first approach enables greater policy customization options and value-added services like telemedicine for pets.
  • Insurers are leveraging claims automation system technology, which has cut claims processing times by up to 45% in some cases, directly improving policyholder satisfaction. These insurtech pet wellness platforms often integrate pet telehealth services, boosting preventative care engagement.
  • As a result, consumers are increasingly using a pet insurance comparison tool to find providers that offer this enhanced digital experience, prioritizing convenience and speed in their selection process.

What challenges does the Pet Insurance Industry face during its growth?

  • A key challenge is the fragmented and inconsistent nature of regulatory frameworks across jurisdictions, compounded by a lack of industry standardization.

  • The market faces significant challenges in managing risk and ensuring transparency. Insurers grapple with adverse selection risk, as owners of high-risk animals are more likely to purchase an animal insurance policy, particularly for pet insurance for older pets. This can skew risk pools, leading to premium increases of up to 15% in some portfolios.
  • Establishing clear consumer protection standards is crucial, especially regarding annual coverage cap and lifetime policy limits, which are common sources of disputes. The lack of standardized definitions for policy terms can result in a 20% higher rate of claim rejections compared to other insurance lines.
  • Balancing these risks with strategies for moral hazard mitigation is essential for sustainable growth and building consumer trust in products like feline medical insurance.

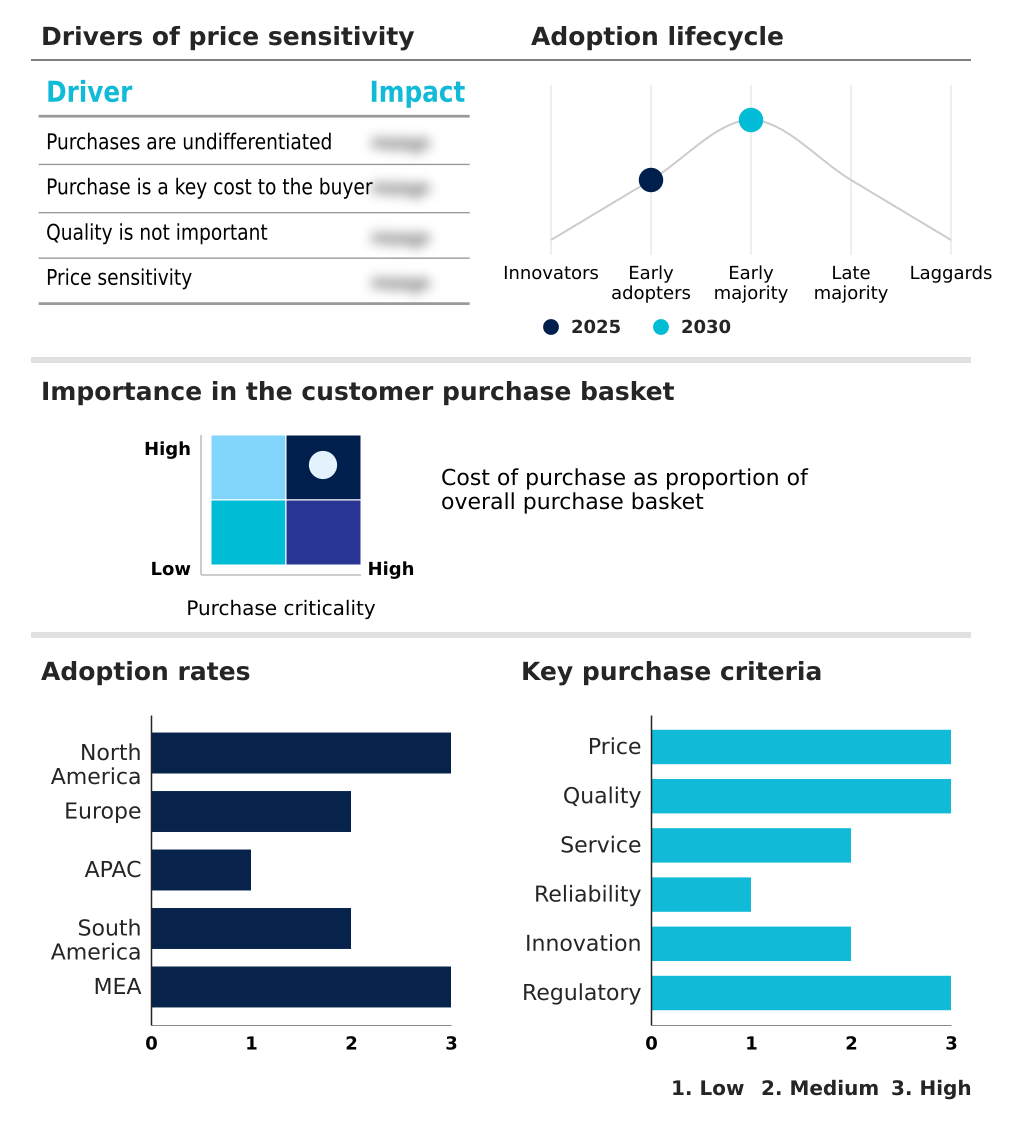
Exclusive Technavio Analysis on Customer Landscape

The pet insurance market forecasting report includes the adoption lifecycle of the market, covering from the innovator’s stage to the laggard’s stage. It focuses on adoption rates in different regions based on penetration. Furthermore, the pet insurance market report also includes key purchase criteria and drivers of price sensitivity to help companies evaluate and develop their market growth analysis strategies.

Customer Landscape of Pet Insurance Industry

Competitive Landscape

Companies are implementing various strategies, such as strategic alliances, pet insurance market forecast, partnerships, mergers and acquisitions, geographical expansion, and product/service launches, to enhance their presence in the industry.

Agria Pet Insurance Ltd. - Offers lifetime policies covering veterinary fees and specialized breeder plans for dogs, cats, and rabbits, ensuring comprehensive animal protection.

The industry research and growth report includes detailed analyses of the competitive landscape of the market and information about key companies, including:

  • Agria Pet Insurance Ltd.
  • Allianz SE
  • Anicom Holdings Inc.
  • Chubb Ltd.
  • Dotsure Ltd.
  • Embrace Pet Insurance LLC
  • Figo Pet Insurance LLC
  • HDFC ERGO General Insurance
  • Healthy Paws Pet Insurance LLC
  • Hollard Insurance Group
  • Independence Pet Group
  • ManyPets Ltd.
  • MetLife Pet Insurance LLC
  • Nationwide Mutual Insurance
  • Pets Best Insurance Services
  • Pumpkin Insurance Services
  • Spot Pet Insurance Services
  • Trupanion Inc.

Qualitative and quantitative analysis of companies has been conducted to help clients understand the wider business environment as well as the strengths and weaknesses of key industry players. Data is qualitatively analyzed to categorize companies as pure play, category-focused, industry-focused, and diversified; it is quantitatively analyzed to categorize companies as dominant, leading, strong, tentative, and weak.

Recent Development and News in Pet insurance market

  • In September 2024, Trupanion Inc. expanded its partnership with veterinary networks to roll out an AI-enabled claims automation system, designed to significantly reduce claims processing times.
  • In October 2024, Nationwide Mutual Insurance and Petco Health and Wellness Company Inc. deepened their partnership to deliver more integrated and accessible insurance products through Petco's retail and online ecosystem.
  • In November 2024, Independence Pet Group announced the acquisition of a prominent insurtech firm, a move aimed at enhancing its digital platform for policy management and digital claims submission.
  • In April 2025, the North American Pet Health Insurance Association (NAPHIA) released its annual State of the Industry report, confirming continued double-digit growth in insured pets and an increasing adoption of comprehensive plans.

Dive into Technavio’s robust research methodology, blending expert interviews, extensive data synthesis, and validated models for unparalleled Pet Insurance Market insights. See full methodology.

Market Scope
Page number 282
Base year 2025
Historic period 2020-2024
Forecast period 2026-2030
Growth momentum & CAGR Accelerate at a CAGR of 45.5%
Market growth 2026-2030 USD 85877.4 million
Market structure Fragmented
YoY growth 2025-2026(%) 37.1%
Key countries US, Canada, Mexico, UK, Germany, France, Italy, Spain, The Netherlands, Japan, Australia, China, India, South Korea, Indonesia, Brazil, Argentina, Chile, South Africa, UAE, Saudi Arabia, Nigeria and Egypt
Competitive landscape Leading Companies, Market Positioning of Companies, Competitive Strategies, and Industry Risks

Request Free Sample

Research Analyst Overview

  • The pet insurance market is defined by a push towards sophisticated risk management and enhanced consumer value. At the core, providers offer accident and illness coverage for veterinary expense reimbursement, but success hinges on balancing this with a clear pre-existing condition exclusion policy and a transparent deductible and copay structure.
  • A key boardroom decision revolves around the level of investment in insurtech integration. This strategic choice directly impacts the entire operational chain, from underwriting and risk pooling based on advanced actuarial data analysis and breed-specific risk assessment to the customer-facing digital claims submission and claims adjudication process.
  • Implementing a claims automation system has been shown to reduce adjudication overhead by over 30%, a compelling metric for operational efficiency. This technological shift also enables valuable services like telemedicine for pets and innovative policy customization options. As the industry matures, adherence to a stringent regulatory compliance framework and evolving consumer protection standards becomes paramount.
  • Providers are also developing strategies for moral hazard mitigation and managing adverse selection risk while innovating with features like direct-to-vet payments, diminishing deductible feature, and comprehensive pet health protection plans. These plans increasingly include hereditary disorder coverage, often subject to an annual coverage cap or lifetime policy limits, to create sustainable and attractive products.

What are the Key Data Covered in this Pet Insurance Market Research and Growth Report?

  • What is the expected growth of the Pet Insurance Market between 2026 and 2030?

    • USD 85.88 billion, at a CAGR of 45.5%

  • What segmentation does the market report cover?

    • The report is segmented by Type (Dogs, Cats, and Others), Application (Accidents and illness, Accidents only, and Others), Channel (Direct sales, Broker or agency, and Bancassurance) and Geography (North America, Europe, APAC, South America, Middle East and Africa)

  • Which regions are analyzed in the report?

    • North America, Europe, APAC, South America and Middle East and Africa

  • What are the key growth drivers and market challenges?

    • Increasing cost and sophistication of veterinary care, Fragmented regulatory landscapes and lack of industry standardization

  • Who are the major players in the Pet Insurance Market?

    • Agria Pet Insurance Ltd., Allianz SE, Anicom Holdings Inc., Chubb Ltd., Dotsure Ltd., Embrace Pet Insurance LLC, Figo Pet Insurance LLC, HDFC ERGO General Insurance, Healthy Paws Pet Insurance LLC, Hollard Insurance Group, Independence Pet Group, ManyPets Ltd., MetLife Pet Insurance LLC, Nationwide Mutual Insurance, Pets Best Insurance Services, Pumpkin Insurance Services, Spot Pet Insurance Services and Trupanion Inc.

Market Research Insights

  • The pet health insurance industry is evolving from a niche product to a mainstream financial tool, serving as a vital pet emergency fund alternative. Insurers are expanding beyond standard canine health coverage and feline medical insurance to include exotic pet coverage.
  • The core offering remains veterinary bill insurance, with plans covering everything from accidents to orthopedic surgery coverage and cancer treatment for pets. The rise of the digital pet insurance provider and insurtech pet wellness has transformed the landscape. Digital pet insurance comparison tool platforms show that providers offering pet telehealth services have a 20% higher customer retention rate.
  • More employers are now offering it as a pet insurance employee benefit, often with a multi-pet insurance discount. These offerings simplify understanding pet insurance policies and help consumers find the best pet insurance for dogs or manage cat insurance cost.
  • Adherence to pet insurance regulations is crucial, especially for pet insurance for older pets and those with pet insurance for chronic conditions. The accident-only pet insurance option provides a baseline of coverage for budget-conscious owners, with some plans reducing claim processing times by 45% through automation.

We can help! Our analysts can customize this pet insurance market research report to meet your requirements.

Get in touch

1. Executive Summary

1.1 Market overview

Executive Summary - Chart on Market Overview
Executive Summary - Data Table on Market Overview
Executive Summary - Chart on Global Market Characteristics
Executive Summary - Chart on Market by Geography
Executive Summary - Chart on Market Segmentation by Type
Executive Summary - Chart on Market Segmentation by Application
Executive Summary - Chart on Market Segmentation by Channel
Executive Summary - Chart on Incremental Growth
Executive Summary - Data Table on Incremental Growth
Executive Summary - Chart on Company Market Positioning

2. Technavio Analysis

2.1 Analysis of price sensitivity, lifecycle, customer purchase basket, adoption rates, and purchase criteria

2.2 Criticality of inputs and Factors of differentiation

Chart on Overview on criticality of inputs and factors of differentiation

2.3 Factors of disruption

Chart on Overview on factors of disruption

2.4 Impact of drivers and challenges

Chart on Impact of drivers and challenges in 2025 and 2030

3. Market Landscape

3.1 Market ecosystem

Chart on Parent Market
Data Table on - Parent Market

3.2 Market characteristics

Chart on Market characteristics analysis

3.3 Value chain analysis

Chart on Value chain analysis

4. Market Sizing

4.1 Market definition

Data Table on Offerings of companies included in the market definition

4.2 Market segment analysis

Market segments

4.3 Market size 2025

4.4 Market outlook: Forecast for 2025-2030

Chart on Global - Market size and forecast 2025-2030 ($ million)
Data Table on Global - Market size and forecast 2025-2030 ($ million)
Chart on Global Market: Year-over-year growth 2025-2030 (%)
Data Table on Global Market: Year-over-year growth 2025-2030 (%)

5. Historic Market Size

5.1 Global Pet Insurance Market 2020 - 2024

Historic Market Size - Data Table on Global Pet Insurance Market 2020 - 2024 ($ million)

5.2 Type segment analysis 2020 - 2024

Historic Market Size - Type Segment 2020 - 2024 ($ million)

5.3 Application segment analysis 2020 - 2024

Historic Market Size - Application Segment 2020 - 2024 ($ million)

5.4 Channel segment analysis 2020 - 2024

Historic Market Size - Channel Segment 2020 - 2024 ($ million)

5.5 Geography segment analysis 2020 - 2024

Historic Market Size - Geography Segment 2020 - 2024 ($ million)

5.6 Country segment analysis 2020 - 2024

Historic Market Size - Country Segment 2020 - 2024 ($ million)

6. Qualitative Analysis

6.1 The impact of AI on global pet insurance market

7. Five Forces Analysis

7.1 Five forces summary

Five forces analysis - Comparison between 2025 and 2030

7.2 Bargaining power of buyers

Bargaining power of buyers - Impact of key factors 2025 and 2030

7.3 Bargaining power of suppliers

Bargaining power of suppliers - Impact of key factors in 2025 and 2030

7.4 Threat of new entrants

Threat of new entrants - Impact of key factors in 2025 and 2030

7.5 Threat of substitutes

Threat of substitutes - Impact of key factors in 2025 and 2030

7.6 Threat of rivalry

Threat of rivalry - Impact of key factors in 2025 and 2030

7.7 Market condition

Chart on Market condition - Five forces 2025 and 2030

8. Market Segmentation by Type

8.1 Market segments

Chart on Type - Market share 2025-2030 (%)
Data Table on Type - Market share 2025-2030 (%)

8.2 Comparison by Type

Chart on Comparison by Type
Data Table on Comparison by Type

8.3 Dogs - Market size and forecast 2025-2030

Chart on Dogs - Market size and forecast 2025-2030 ($ million)
Data Table on Dogs - Market size and forecast 2025-2030 ($ million)
Chart on Dogs - Year-over-year growth 2025-2030 (%)
Data Table on Dogs - Year-over-year growth 2025-2030 (%)

8.4 Cats - Market size and forecast 2025-2030

Chart on Cats - Market size and forecast 2025-2030 ($ million)
Data Table on Cats - Market size and forecast 2025-2030 ($ million)
Chart on Cats - Year-over-year growth 2025-2030 (%)
Data Table on Cats - Year-over-year growth 2025-2030 (%)

8.5 Others - Market size and forecast 2025-2030

Chart on Others - Market size and forecast 2025-2030 ($ million)
Data Table on Others - Market size and forecast 2025-2030 ($ million)
Chart on Others - Year-over-year growth 2025-2030 (%)
Data Table on Others - Year-over-year growth 2025-2030 (%)

8.6 Market opportunity by Type

Market opportunity by Type ($ million)
Data Table on Market opportunity by Type ($ million)

9. Market Segmentation by Application

9.1 Market segments

Chart on Application - Market share 2025-2030 (%)
Data Table on Application - Market share 2025-2030 (%)

9.2 Comparison by Application

Chart on Comparison by Application
Data Table on Comparison by Application

9.3 Accidents and illness - Market size and forecast 2025-2030

Chart on Accidents and illness - Market size and forecast 2025-2030 ($ million)
Data Table on Accidents and illness - Market size and forecast 2025-2030 ($ million)
Chart on Accidents and illness - Year-over-year growth 2025-2030 (%)
Data Table on Accidents and illness - Year-over-year growth 2025-2030 (%)

9.4 Accidents only - Market size and forecast 2025-2030

Chart on Accidents only - Market size and forecast 2025-2030 ($ million)
Data Table on Accidents only - Market size and forecast 2025-2030 ($ million)
Chart on Accidents only - Year-over-year growth 2025-2030 (%)
Data Table on Accidents only - Year-over-year growth 2025-2030 (%)

9.5 Others - Market size and forecast 2025-2030

Chart on Others - Market size and forecast 2025-2030 ($ million)
Data Table on Others - Market size and forecast 2025-2030 ($ million)
Chart on Others - Year-over-year growth 2025-2030 (%)
Data Table on Others - Year-over-year growth 2025-2030 (%)

9.6 Market opportunity by Application

Market opportunity by Application ($ million)
Data Table on Market opportunity by Application ($ million)

10. Market Segmentation by Channel

10.1 Market segments

Chart on Channel - Market share 2025-2030 (%)
Data Table on Channel - Market share 2025-2030 (%)

10.2 Comparison by Channel

Chart on Comparison by Channel
Data Table on Comparison by Channel

10.3 Direct sales - Market size and forecast 2025-2030

Chart on Direct sales - Market size and forecast 2025-2030 ($ million)
Data Table on Direct sales - Market size and forecast 2025-2030 ($ million)
Chart on Direct sales - Year-over-year growth 2025-2030 (%)
Data Table on Direct sales - Year-over-year growth 2025-2030 (%)

10.4 Broker or agency - Market size and forecast 2025-2030

Chart on Broker or agency - Market size and forecast 2025-2030 ($ million)
Data Table on Broker or agency - Market size and forecast 2025-2030 ($ million)
Chart on Broker or agency - Year-over-year growth 2025-2030 (%)
Data Table on Broker or agency - Year-over-year growth 2025-2030 (%)

10.5 Bancassurance - Market size and forecast 2025-2030

Chart on Bancassurance - Market size and forecast 2025-2030 ($ million)
Data Table on Bancassurance - Market size and forecast 2025-2030 ($ million)
Chart on Bancassurance - Year-over-year growth 2025-2030 (%)
Data Table on Bancassurance - Year-over-year growth 2025-2030 (%)

10.6 Market opportunity by Channel

Market opportunity by Channel ($ million)
Data Table on Market opportunity by Channel ($ million)

11. Customer Landscape

11.1 Customer landscape overview

Analysis of price sensitivity, lifecycle, customer purchase basket, adoption rates, and purchase criteria

12. Geographic Landscape

12.1 Geographic segmentation

Chart on Market share by geography 2025-2030 (%)
Data Table on Market share by geography 2025-2030 (%)

12.2 Geographic comparison

Chart on Geographic comparison
Data Table on Geographic comparison

12.3 North America - Market size and forecast 2025-2030

Chart on North America - Market size and forecast 2025-2030 ($ million)
Data Table on North America - Market size and forecast 2025-2030 ($ million)
Chart on North America - Year-over-year growth 2025-2030 (%)
Data Table on North America - Year-over-year growth 2025-2030 (%)
Chart on Regional Comparison - North America
Data Table on Regional Comparison - North America

12.3.1 US - Market size and forecast 2025-2030

Chart on US - Market size and forecast 2025-2030 ($ million)
Data Table on US - Market size and forecast 2025-2030 ($ million)
Chart on US - Year-over-year growth 2025-2030 (%)
Data Table on US - Year-over-year growth 2025-2030 (%)

12.3.2 Canada - Market size and forecast 2025-2030

Chart on Canada - Market size and forecast 2025-2030 ($ million)
Data Table on Canada - Market size and forecast 2025-2030 ($ million)
Chart on Canada - Year-over-year growth 2025-2030 (%)
Data Table on Canada - Year-over-year growth 2025-2030 (%)

12.3.3 Mexico - Market size and forecast 2025-2030

Chart on Mexico - Market size and forecast 2025-2030 ($ million)
Data Table on Mexico - Market size and forecast 2025-2030 ($ million)
Chart on Mexico - Year-over-year growth 2025-2030 (%)
Data Table on Mexico - Year-over-year growth 2025-2030 (%)

12.4 Europe - Market size and forecast 2025-2030

Chart on Europe - Market size and forecast 2025-2030 ($ million)
Data Table on Europe - Market size and forecast 2025-2030 ($ million)
Chart on Europe - Year-over-year growth 2025-2030 (%)
Data Table on Europe - Year-over-year growth 2025-2030 (%)
Chart on Regional Comparison - Europe
Data Table on Regional Comparison - Europe

12.4.1 UK - Market size and forecast 2025-2030

Chart on UK - Market size and forecast 2025-2030 ($ million)
Data Table on UK - Market size and forecast 2025-2030 ($ million)
Chart on UK - Year-over-year growth 2025-2030 (%)
Data Table on UK - Year-over-year growth 2025-2030 (%)

12.4.2 Germany - Market size and forecast 2025-2030

Chart on Germany - Market size and forecast 2025-2030 ($ million)
Data Table on Germany - Market size and forecast 2025-2030 ($ million)
Chart on Germany - Year-over-year growth 2025-2030 (%)
Data Table on Germany - Year-over-year growth 2025-2030 (%)

12.4.3 France - Market size and forecast 2025-2030

Chart on France - Market size and forecast 2025-2030 ($ million)
Data Table on France - Market size and forecast 2025-2030 ($ million)
Chart on France - Year-over-year growth 2025-2030 (%)
Data Table on France - Year-over-year growth 2025-2030 (%)

12.4.4 Italy - Market size and forecast 2025-2030

Chart on Italy - Market size and forecast 2025-2030 ($ million)
Data Table on Italy - Market size and forecast 2025-2030 ($ million)
Chart on Italy - Year-over-year growth 2025-2030 (%)
Data Table on Italy - Year-over-year growth 2025-2030 (%)

12.4.5 Spain - Market size and forecast 2025-2030

Chart on Spain - Market size and forecast 2025-2030 ($ million)
Data Table on Spain - Market size and forecast 2025-2030 ($ million)
Chart on Spain - Year-over-year growth 2025-2030 (%)
Data Table on Spain - Year-over-year growth 2025-2030 (%)

12.4.6 The Netherlands - Market size and forecast 2025-2030

Chart on The Netherlands - Market size and forecast 2025-2030 ($ million)
Data Table on The Netherlands - Market size and forecast 2025-2030 ($ million)
Chart on The Netherlands - Year-over-year growth 2025-2030 (%)
Data Table on The Netherlands - Year-over-year growth 2025-2030 (%)

12.5 APAC - Market size and forecast 2025-2030

Chart on APAC - Market size and forecast 2025-2030 ($ million)
Data Table on APAC - Market size and forecast 2025-2030 ($ million)
Chart on APAC - Year-over-year growth 2025-2030 (%)
Data Table on APAC - Year-over-year growth 2025-2030 (%)
Chart on Regional Comparison - APAC
Data Table on Regional Comparison - APAC

12.5.1 Japan - Market size and forecast 2025-2030

Chart on Japan - Market size and forecast 2025-2030 ($ million)
Data Table on Japan - Market size and forecast 2025-2030 ($ million)
Chart on Japan - Year-over-year growth 2025-2030 (%)
Data Table on Japan - Year-over-year growth 2025-2030 (%)

12.5.2 Australia - Market size and forecast 2025-2030

Chart on Australia - Market size and forecast 2025-2030 ($ million)
Data Table on Australia - Market size and forecast 2025-2030 ($ million)
Chart on Australia - Year-over-year growth 2025-2030 (%)
Data Table on Australia - Year-over-year growth 2025-2030 (%)

12.5.3 China - Market size and forecast 2025-2030

Chart on China - Market size and forecast 2025-2030 ($ million)
Data Table on China - Market size and forecast 2025-2030 ($ million)
Chart on China - Year-over-year growth 2025-2030 (%)
Data Table on China - Year-over-year growth 2025-2030 (%)

12.5.4 India - Market size and forecast 2025-2030

Chart on India - Market size and forecast 2025-2030 ($ million)
Data Table on India - Market size and forecast 2025-2030 ($ million)
Chart on India - Year-over-year growth 2025-2030 (%)
Data Table on India - Year-over-year growth 2025-2030 (%)

12.5.5 South Korea - Market size and forecast 2025-2030

Chart on South Korea - Market size and forecast 2025-2030 ($ million)
Data Table on South Korea - Market size and forecast 2025-2030 ($ million)
Chart on South Korea - Year-over-year growth 2025-2030 (%)
Data Table on South Korea - Year-over-year growth 2025-2030 (%)

12.5.6 Indonesia - Market size and forecast 2025-2030

Chart on Indonesia - Market size and forecast 2025-2030 ($ million)
Data Table on Indonesia - Market size and forecast 2025-2030 ($ million)
Chart on Indonesia - Year-over-year growth 2025-2030 (%)
Data Table on Indonesia - Year-over-year growth 2025-2030 (%)

12.6 South America - Market size and forecast 2025-2030

Chart on South America - Market size and forecast 2025-2030 ($ million)
Data Table on South America - Market size and forecast 2025-2030 ($ million)
Chart on South America - Year-over-year growth 2025-2030 (%)
Data Table on South America - Year-over-year growth 2025-2030 (%)
Chart on Regional Comparison - South America
Data Table on Regional Comparison - South America

12.6.1 Brazil - Market size and forecast 2025-2030

Chart on Brazil - Market size and forecast 2025-2030 ($ million)
Data Table on Brazil - Market size and forecast 2025-2030 ($ million)
Chart on Brazil - Year-over-year growth 2025-2030 (%)
Data Table on Brazil - Year-over-year growth 2025-2030 (%)

12.6.2 Argentina - Market size and forecast 2025-2030

Chart on Argentina - Market size and forecast 2025-2030 ($ million)
Data Table on Argentina - Market size and forecast 2025-2030 ($ million)
Chart on Argentina - Year-over-year growth 2025-2030 (%)
Data Table on Argentina - Year-over-year growth 2025-2030 (%)

12.6.3 Chile - Market size and forecast 2025-2030

Chart on Chile - Market size and forecast 2025-2030 ($ million)
Data Table on Chile - Market size and forecast 2025-2030 ($ million)
Chart on Chile - Year-over-year growth 2025-2030 (%)
Data Table on Chile - Year-over-year growth 2025-2030 (%)

12.7 Middle East and Africa - Market size and forecast 2025-2030

Chart on Middle East and Africa - Market size and forecast 2025-2030 ($ million)
Data Table on Middle East and Africa - Market size and forecast 2025-2030 ($ million)
Chart on Middle East and Africa - Year-over-year growth 2025-2030 (%)
Data Table on Middle East and Africa - Year-over-year growth 2025-2030 (%)
Chart on Regional Comparison - Middle East and Africa
Data Table on Regional Comparison - Middle East and Africa

12.7.1 South Africa - Market size and forecast 2025-2030

Chart on South Africa - Market size and forecast 2025-2030 ($ million)
Data Table on South Africa - Market size and forecast 2025-2030 ($ million)
Chart on South Africa - Year-over-year growth 2025-2030 (%)
Data Table on South Africa - Year-over-year growth 2025-2030 (%)

12.7.2 UAE - Market size and forecast 2025-2030

Chart on UAE - Market size and forecast 2025-2030 ($ million)
Data Table on UAE - Market size and forecast 2025-2030 ($ million)
Chart on UAE - Year-over-year growth 2025-2030 (%)
Data Table on UAE - Year-over-year growth 2025-2030 (%)

12.7.3 Saudi Arabia - Market size and forecast 2025-2030

Chart on Saudi Arabia - Market size and forecast 2025-2030 ($ million)
Data Table on Saudi Arabia - Market size and forecast 2025-2030 ($ million)
Chart on Saudi Arabia - Year-over-year growth 2025-2030 (%)
Data Table on Saudi Arabia - Year-over-year growth 2025-2030 (%)

12.7.4 Nigeria - Market size and forecast 2025-2030

Chart on Nigeria - Market size and forecast 2025-2030 ($ million)
Data Table on Nigeria - Market size and forecast 2025-2030 ($ million)
Chart on Nigeria - Year-over-year growth 2025-2030 (%)
Data Table on Nigeria - Year-over-year growth 2025-2030 (%)

12.7.5 Egypt - Market size and forecast 2025-2030

Chart on Egypt - Market size and forecast 2025-2030 ($ million)
Data Table on Egypt - Market size and forecast 2025-2030 ($ million)
Chart on Egypt - Year-over-year growth 2025-2030 (%)
Data Table on Egypt - Year-over-year growth 2025-2030 (%)

12.8 Market opportunity by geography

Market opportunity by geography ($ million)
Data Tables on Market opportunity by geography ($ million)

13. Drivers, Challenges, and Opportunity

13.1 Market drivers

Increasing cost and sophistication of veterinary care
Humanization of pets and evolving ownership demographics
Growing awareness and enhanced accessibility of pet insurance

13.2 Market challenges

Fragmented regulatory landscapes and lack of industry standardization
Prohibitive premium costs and intricate policy structures
Inherent risks of adverse selection and moral hazard

13.3 Impact of drivers and challenges

Impact of drivers and challenges in 2025 and 2030

13.4 Market opportunities

Technological integration and rise of insurtech
Shift towards holistic coverage with wellness and preventative care plans
Growing emphasis on policy customization and personalization

14. Competitive Landscape

14.1 Overview

14.2

Overview on criticality of inputs and factors of differentiation

14.3 Landscape disruption

Overview on factors of disruption

14.4 Industry risks

Impact of key risks on business

15. Competitive Analysis

15.1 Companies profiled

Companies covered

15.2 Company ranking index

15.3 Market positioning of companies

Matrix on companies position and classification

15.4 Agria Pet Insurance Ltd.

Agria Pet Insurance Ltd. - Overview
Agria Pet Insurance Ltd. - Product / Service
Agria Pet Insurance Ltd. - Key offerings
SWOT

15.5 Allianz SE

Allianz SE - Overview
Allianz SE - Business segments
Allianz SE - Key news
Allianz SE - Key offerings
Allianz SE - Segment focus
SWOT

15.6 Anicom Holdings Inc.

Anicom Holdings Inc. - Overview
Anicom Holdings Inc. - Product / Service
Anicom Holdings Inc. - Key offerings
SWOT

15.7 Chubb Ltd.

Chubb Ltd. - Overview
Chubb Ltd. - Business segments
Chubb Ltd. - Key news
Chubb Ltd. - Key offerings
Chubb Ltd. - Segment focus
SWOT

15.8 Dotsure Ltd.

Dotsure Ltd. - Overview
Dotsure Ltd. - Product / Service
Dotsure Ltd. - Key offerings
SWOT

15.9 Embrace Pet Insurance LLC

Embrace Pet Insurance LLC - Overview
Embrace Pet Insurance LLC - Product / Service
Embrace Pet Insurance LLC - Key offerings
SWOT

15.10 Figo Pet Insurance LLC

Figo Pet Insurance LLC - Overview
Figo Pet Insurance LLC - Product / Service
Figo Pet Insurance LLC - Key offerings
SWOT

15.11 Healthy Paws Pet Insurance LLC

Healthy Paws Pet Insurance LLC - Overview
Healthy Paws Pet Insurance LLC - Product / Service
Healthy Paws Pet Insurance LLC - Key offerings
SWOT

15.12 Hollard Insurance Group

Hollard Insurance Group - Overview
Hollard Insurance Group - Product / Service
Hollard Insurance Group - Key offerings
SWOT

15.13 Independence Pet Group

Independence Pet Group - Overview
Independence Pet Group - Product / Service
Independence Pet Group - Key offerings
SWOT

15.14 MetLife Pet Insurance LLC

MetLife Pet Insurance LLC - Overview
MetLife Pet Insurance LLC - Product / Service
MetLife Pet Insurance LLC - Key offerings
SWOT

15.15 Nationwide Mutual Insurance

Nationwide Mutual Insurance - Overview
Nationwide Mutual Insurance - Product / Service
Nationwide Mutual Insurance - Key offerings
SWOT

15.16 Pets Best Insurance Services

Pets Best Insurance Services - Overview
Pets Best Insurance Services - Product / Service
Pets Best Insurance Services - Key offerings
SWOT

15.17 Spot Pet Insurance Services

Spot Pet Insurance Services - Overview
Spot Pet Insurance Services - Product / Service
Spot Pet Insurance Services - Key offerings
SWOT

15.18 Trupanion Inc.

Trupanion Inc. - Overview
Trupanion Inc. - Business segments
Trupanion Inc. - Key offerings
Trupanion Inc. - Segment focus
SWOT

16. Appendix

16.1 Scope of the report

Market definition
Objectives
Notes and caveats

16.2 Inclusions and exclusions checklist

Inclusions checklist
Exclusions checklist

16.3 Currency conversion rates for US$

16.4 Research methodology

16.5 Data procurement

Information sources

16.6 Data validation

16.7 Validation techniques employed for market sizing

16.8 Data synthesis

16.9 360 degree market analysis

16.10 List of abbreviations

Research Methodology

Technavio presents a detailed picture of the market by way of study, synthesis, and summation of data from multiple sources. The analysts have presented the various facets of the market with a particular focus on identifying the key industry influencers. The data thus presented is comprehensive, reliable, and the result of extensive research, both primary and secondary.

INFORMATION SOURCES

Primary sources

  • Manufacturers and suppliers
  • Channel partners
  • Industry experts
  • Strategic decision makers

Secondary sources

  • Industry journals and periodicals
  • Government data
  • Financial reports of key industry players
  • Historical data
  • Press releases

DATA ANALYSIS

Data Synthesis

  • Collation of data
  • Estimation of key figures
  • Analysis of derived insights

Data Validation

  • Triangulation with data models
  • Reference against proprietary databases
  • Corroboration with industry experts

REPORT WRITING

Qualitative

  • Market drivers
  • Market challenges
  • Market trends
  • Five forces analysis

Quantitative

  • Market size and forecast
  • Market segmentation
  • Geographical insights
  • Competitive landscape

Interested in this report?

Get your sample now to see our research methodology and insights!

Download Now

Frequently Asked Questions

Pet Insurance market growth will increase by USD 85877.4 million during 2026-2030.

The Pet Insurance market is expected to grow at a CAGR of 45.5% during 2026-2030.

Pet Insurance market is segmented by Type (Dogs, Cats, Others) Application (Accidents and illness, Accidents only, Others) Channel (Direct sales, Broker or agency, Bancassurance)

Agria Pet Insurance Ltd., Allianz SE, Anicom Holdings Inc., Chubb Ltd., Dotsure Ltd., Embrace Pet Insurance LLC, Figo Pet Insurance LLC, HDFC ERGO General Insurance, Healthy Paws Pet Insurance LLC, Hollard Insurance Group, Independence Pet Group, ManyPets Ltd., MetLife Pet Insurance LLC, Nationwide Mutual Insurance, Pets Best Insurance Services, Pumpkin Insurance Services, Spot Pet Insurance Services, Trupanion Inc. are a few of the key vendors in the Pet Insurance market.

North America will register the highest growth rate of 58.4% among the other regions. Therefore, the Pet Insurance market in North America is expected to garner significant business opportunities for the vendors during the forecast period.

US, Canada, Mexico, UK, Germany, France, Italy, Spain, The Netherlands, Japan, Australia, China, India, South Korea, Indonesia, Brazil, Argentina, Chile, South Africa, UAE, Saudi Arabia, Nigeria, Egypt

  • Increasing cost and sophistication of veterinary care is the driving factor this market.

The Pet Insurance market vendors should focus on grabbing business opportunities from the Type segment as it accounted for the largest market share in the base year.