PFC Capacitors Market Size 2024-2028
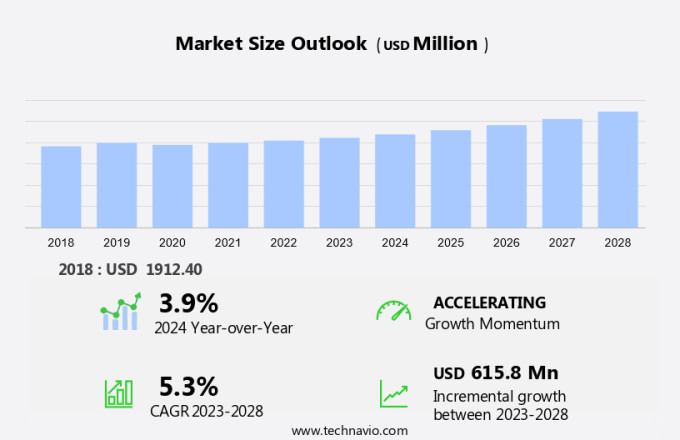
The PFC capacitors market size is forecast to increase by USD 615.8 million, at a CAGR of 5.3% between 2023 and 2028.
- The market is witnessing significant growth, driven by the increasing emphasis on cost savings and energy efficiency in various industries. Energy efficiency is a critical factor in reducing operational costs and minimizing environmental impact, leading companies to invest in power factor correction (PFC) capacitors to optimize energy usage. However, the market faces technical challenges that may hinder growth. PFC capacitors require precise design and manufacturing to ensure optimal performance, and their complex nature poses challenges in terms of reliability and longevity.
- Additionally, the integration of PFC capacitors into various applications, such as renewable energy systems and industrial power supplies, necessitates stringent regulatory compliance, further complicating the manufacturing process. Companies must navigate these challenges to capitalize on the market's potential and meet the growing demand for cost-effective, energy-efficient power solutions.
What will be the Size of the PFC Capacitors Market during the forecast period?
Explore in-depth regional segment analysis with market size data - historical 2018-2022 and forecasts 2024-2028 - in the full report.
Request Free Sample
The market continues to evolve, driven by the dynamic interplay of various factors. In energy storage and renewable energy sectors, the demand for PFC capacitors persists due to their role in reactive power compensation and system optimization. These capacitors are essential in power electronics, including switching power supplies and AC-DC converters, where they ensure power quality and safety regulations compliance. Moreover, the evolving needs of lighting systems and grid modernization projects necessitate the use of PFC capacitors. Capacitor reliability, high voltage, and capacitor recycling are critical aspects of the circular economy, as the industry strives for cost optimization and reduced environmental impact.
Capacitor manufacturers continue to innovate, offering solutions with improved current rating, temperature coefficient, and voltage rating. Polypropylene capacitors, for instance, offer enhanced energy management capabilities, while polyester and ceramic capacitors cater to specific applications such as impedance matching and RFI filtering. In the realm of power system design, PFC capacitors contribute to voltage regulation, power factor correction, and line impedance compensation. Capacitor life cycle and dissipation factor are crucial considerations in circuit design, ensuring efficient energy transfer and minimizing power losses. The market's continuous dynamism extends to applications in commercial and residential sectors, where cost optimization, energy efficiency, and carbon footprint reduction are key priorities.
Capacitor testing and voltage sags mitigation are essential aspects of maintaining power system stability and ensuring reliable power supply. In summary, the market is characterized by ongoing innovation and adaptation to the evolving needs of various sectors. From power electronics and energy storage to lighting systems and grid modernization, PFC capacitors play a vital role in optimizing power systems, enhancing energy efficiency, and ensuring power quality and safety.
How is this PFC Capacitors Industry segmented?
The pfc capacitors industry research report provides comprehensive data (region-wise segment analysis), with forecasts and estimates in "USD million" for the period 2024-2028, as well as historical data from 2018-2022 for the following segments.
- Type
- Automatic
- Fixed
- End-user
- Industrial
- Commercial
- Utilities
- Renewable energy
- Geography
- North America
- US
- Canada
- Europe
- France
- Germany
- UK
- APAC
- China
- India
- Japan
- Singapore
- South Korea
- Rest of World (ROW)
- North America
.
By Type Insights
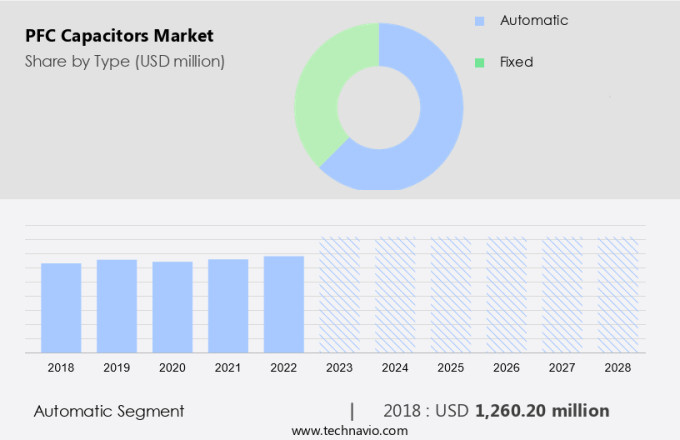
The automatic segment is estimated to witness significant growth during the forecast period.
The market for motor control capacitors, including electrolytic and automatic PFC capacitors, is experiencing notable growth due to the increasing demand for power factor management solutions that can adapt to complex and variable load patterns. Automatic PFC capacitors, which autonomously adjust reactive power compensation, are gaining popularity for their efficiency, lower maintenance requirements, and advanced protection features. These systems continuously monitor power factor and switch capacitor banks as needed, making them indispensable in modern electrical installations. Industries are shifting from fixed systems to automatic PFC solutions to optimize energy management, reduce operating costs, and enhance protection against overcompensation.
Capacitor manufacturers are responding to this trend by investing in research and development to produce high-performance capacitors that meet the evolving needs of power electronics applications. Additionally, the circular economy and renewable energy sectors are driving demand for energy storage solutions, further fueling the growth of the capacitor market. Capacitor standards and regulations, such as those related to power quality, safety, and environmental impact, are also influencing market dynamics. In the realm of power system design, capacitive reactance, impedance matching, and voltage regulation are critical considerations for optimizing power factor and ensuring reliable power delivery.
Capacitor distributors play a vital role in supplying these essential components to various industries, including lighting systems, commercial applications, and residential installations. Overall, the capacitor market is characterized by ongoing innovation, with a focus on improving energy efficiency, reducing carbon footprint, and enhancing system reliability.
The Automatic segment was valued at USD 1260.20 million in 2018 and showed a gradual increase during the forecast period.
Regional Analysis
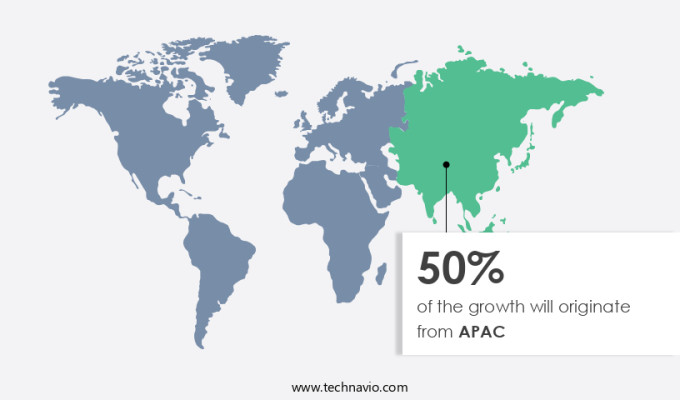
APAC is estimated to contribute 50% to the growth of the global market during the forecast period. Technavio's analysts have elaborately explained the regional trends and drivers that shape the market during the forecast period.
The Asia-Pacific (APAC) market for Power Factor Correction (PFC) capacitors is witnessing substantial growth due to the region's rapid industrialization and urbanization, resulting in increased electricity consumption. In July 2024, Swedfund, a Swedish development finance institution, invested USD10 million in equity in Xurya, an Indonesian solar rooftop company, as part of a USD 55 million financing round led by Norfund. This marks Swedfund's first investment in the Indonesian renewable energy sector. Countries like China, India, and Southeast Asian nations are expanding their industrial and commercial sectors, leading to a growing demand for energy-efficient power management solutions. PFC capacitors play a crucial role in power electronics applications, including motor control, electrolytic capacitors, system optimization, EMI filtering, reactive power compensation, AC-DC converters, and DC-DC converters.
They ensure power quality, safety regulations compliance, and improved energy efficiency. Capacitor manufacturers produce various types, such as polyester, polypropylene, and ceramic capacitors, catering to diverse applications, including energy storage, renewable energy, lighting systems, and grid modernization. Capacitor life cycle, voltage rating, current rating, temperature coefficient, dissipation factor, impedance matching, and capacitive reactance are essential factors in capacitor selection. Capacitor reliability, power factor correction, harmonic distortion, voltage regulation, and ripple current are critical aspects of power system design. Capacitor banks, circuit design, surge protection, and energy management systems are integral components of power electronics. The circular economy concept is gaining traction, with a focus on capacitor recycling and reducing electronic waste.
Capacitor distributors play a vital role in ensuring a steady supply of high-quality capacitors for various applications. Power factor correction, voltage regulation, and line impedance are essential for optimizing cost and energy efficiency in both residential and commercial applications. High voltage, smart grid, and power quality are essential considerations in grid modernization. Capacitor testing and voltage sags are crucial for ensuring reliable power delivery and preventing power interruptions. Capacitors are also used in various applications, such as surge protection, RFI filtering, and impedance matching, to ensure optimal performance and safety.
Market Dynamics
Our researchers analyzed the data with 2023 as the base year, along with the key drivers, trends, and challenges. A holistic analysis of drivers will help companies refine their marketing strategies to gain a competitive advantage.
What are the key market drivers leading to the rise in the adoption of PFC Capacitors Industry?
- The market is primarily driven by a heightened emphasis on cost-effective strategies and solutions.
- The market is experiencing significant growth due to the increasing focus on reducing operating costs in various industries. These capacitors are becoming a strategic investment for businesses as they offer long-term savings by decreasing electricity bills, minimizing utility penalties, and enhancing energy efficiency. With energy expenses being a substantial portion of operating costs, companies are actively seeking solutions to optimize power consumption and improve electrical system performance. PFC capacitors provide a compelling value proposition by effectively decreasing reactive power consumption, minimizing distribution losses, and increasing overall system capacity.
- The relatively short payback period, ranging from 6 to 24 months depending on the installation size and utility rates, makes PFC capacitors an attractive option for cost-conscious industrial and commercial users. By investing in PFC capacitors, businesses can improve their bottom line while also contributing to a more efficient and sustainable energy landscape.
What are the market trends shaping the PFC Capacitors Industry?
- Market trends indicate a heightened emphasis on energy efficiency. It is a mandatory and professional approach for businesses to prioritize this aspect in their operations.
- PFC capacitors have gained significant importance in the industrial and commercial sectors due to the increasing emphasis on energy efficiency and sustainable practices. The global drive towards energy optimization and reducing carbon emissions has led to a substantial increase in the demand for PFC capacitors. For instance, the Ministry of Energy and Natural Resources of Turkiye announced plans to invest around USD 20 billion in energy efficiency by 2030, which involves collaboration between the public and private sectors to enhance energy savings and reduce CO2 emissions. Businesses are adopting PFC capacitors to mitigate power losses, avoid utility penalties, and optimize their electrical systems.
- These capacitors are essential in correcting the power factor by offsetting reactive power consumption in electrical setups, particularly in environments with numerous inductive loads such as motors, transformers, and fluorescent lighting. PFC capacitors play a vital role in motor control applications, ensuring optimal performance and power quality. Moreover, they are crucial components in AC-DC and DC-DC converters, ensuring impedance matching and efficient energy conversion. EMI filtering is another critical application of PFC capacitors, ensuring power quality and safety regulations compliance. The circular economy concept is gaining momentum, and the recycling and reuse of PFC capacitors are becoming increasingly important.
- The dissipation factor of PFC capacitors is a crucial parameter, as it affects their efficiency and performance. In conclusion, the demand for PFC capacitors is expected to continue growing due to their role in energy efficiency, power quality, and regulatory compliance.
What challenges does the PFC Capacitors Industry face during its growth?
- The growth of the industry is significantly impacted by the complex technical issues surrounding Power Factor Correction (PFC) capacitors. These challenges, which are a common concern for professionals in the field, require ongoing attention and innovation to overcome.
- The market faces technical challenges that may impede its expansion. Harmonic distortion, a growing issue due to the proliferation of non-linear loads and power electronic devices, can cause PFC capacitors to overheat and shorten their lifespan. This harmonic distortion can lead to system failures if not addressed through detuned or filtered solutions. The complexity of modern electrical systems, characterized by fluctuating load patterns and dynamic power requirements, complicates the accurate sizing and design of PFC systems. Furthermore, the risk of system resonance, which arises from the interaction between capacitors and the inductance of the power system, necessitates meticulous analysis and specialized design considerations.
- Energy storage applications, including renewable energy and energy management systems, as well as switching power supplies, lighting systems, grid modernization, and high voltage systems, rely on PFC capacitors for efficient energy conversion and reliability. Ensuring capacitor reliability and adherence to capacitor standards are crucial to mitigating these challenges and maximizing the potential of the market. Capacitor recycling also plays a vital role in minimizing environmental impact and reducing the demand for raw materials.
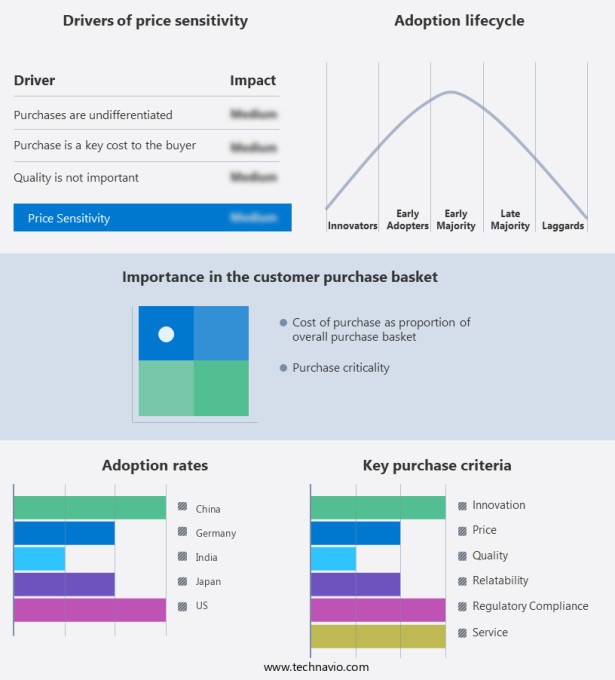
Exclusive Customer Landscape
The PFC capacitors market forecasting report includes the adoption lifecycle of the market, covering from the innovator's stage to the laggard's stage. It focuses on adoption rates in different regions based on penetration. Furthermore, the PFC capacitors market report also includes key purchase criteria and drivers of price sensitivity to help companies evaluate and develop their market growth analysis strategies.
Customer Landscape
Key Companies & Market Insights
Companies are implementing various strategies, such as strategic alliances, PFC capacitors market forecast, partnerships, mergers and acquisitions, geographical expansion, and product/service launches, to enhance their presence in the industry.
Alpha Power Solutions - This company specializes in three-phase PFC capacitors, engineered for swift integration into capacitor banks.
The industry research and growth report includes detailed analyses of the competitive landscape of the market and information about key companies, including:
- Alpha Power Solutions
- BCH Electric Ltd.
- DongGuan Xuansn Electronic Tech
- Eaton Corp plc
- Galco Industrial Electronics
- Hydra a.s.
- Indtech Capacitors
- Johnson and Phillips Ltd.
- LOVATO Electric Spa
- PS Power Controls
- RONK ELECTRICAL INDUSTRIES
- Schneider Electric SE
- TIBREWALA ELECTRONICS LTD
- Vishay Intertechnology Inc.
- WEG S.A
- YashEnergy Capacitors Pvt. Ltd.
- ZEZ SILKO s.r.o.
- ZHIYUE GROUP CO. LTD.
Qualitative and quantitative analysis of companies has been conducted to help clients understand the wider business environment as well as the strengths and weaknesses of key industry players. Data is qualitatively analyzed to categorize companies as pure play, category-focused, industry-focused, and diversified; it is quantitatively analyzed to categorize companies as dominant, leading, strong, tentative, and weak.
Recent Development and News in PFC Capacitors Market
- In February 2023, Panasonic Corporation announced the launch of its new line of high-performance Power Factor Correction (PFC) capacitors, featuring advanced technologies for improved energy efficiency and reliability. These new capacitors are designed to meet the growing demand for energy-efficient power electronics in various industries, including renewable energy and industrial automation (Panasonic Corporation, 2023).
- In March 2024, Siemens Energy and LG Chem signed a strategic partnership to jointly develop and commercialize energy storage solutions integrated with PFC capacitors. This collaboration aims to address the increasing need for grid stability and energy efficiency in the renewable energy sector (Siemens Energy, 2024).
- In May 2024, NGK Insulators, Ltd. completed the acquisition of the PFC capacitor business unit of Hitachi Chemical Co., Ltd. This acquisition significantly expanded NGK's market presence and product portfolio, enabling the company to offer a broader range of PFC capacitor solutions to its customers (NGK Insulators, Ltd., 2024).
Research Analyst Overview
- The PFC capacitor industry continues to evolve, driven by stringent standards and the need for high-performance capacitors. Capacitor selection becomes increasingly crucial as market trends favor energy efficiency and reliability. PFC capacitor testing plays a pivotal role in ensuring compliance with regulations and maintaining optimal capacitor performance. Capacitor development is focused on enhancing efficiency, life, and innovation through advanced technology and simulation. Capacitor applications span various industries, from power electronics to renewable energy. Capacitor software tools facilitate capacitor modeling, optimization, and maintenance, enabling cost-effective and efficient operations. Capacitor regulations, such as those related to safety and efficiency, are shaping the industry landscape.
- Capacitor performance is a critical concern, with ongoing research and innovation aimed at improving capacitor efficiency and extending life. The future of PFC capacitors lies in advanced technology and design, offering improved reliability and cost savings for businesses. Capacitor services and optimization strategies further contribute to the industry's growth and competitiveness.
Dive into Technavio's robust research methodology, blending expert interviews, extensive data synthesis, and validated models for unparalleled PFC Capacitors Market insights. See full methodology.
|
Market Scope |
|
|
Report Coverage |
Details |
|
Page number |
201 |
|
Base year |
2023 |
|
Historic period |
2018-2022 |
|
Forecast period |
2024-2028 |
|
Growth momentum & CAGR |
Accelerate at a CAGR of 5.3% |
|
Market growth 2024-2028 |
USD 615.8 million |
|
Market structure |
Fragmented |
|
YoY growth 2023-2024(%) |
3.9 |
|
Key countries |
China, US, Germany, Japan, India, South Korea, UK, Singapore, France, and Canada |
|
Competitive landscape |
Leading Companies, Market Positioning of Companies, Competitive Strategies, and Industry Risks |
What are the Key Data Covered in this PFC Capacitors Market Research and Growth Report?
- CAGR of the PFC Capacitors industry during the forecast period
- Detailed information on factors that will drive the growth and forecasting between 2024 and 2028
- Precise estimation of the size of the market and its contribution of the industry in focus to the parent market
- Accurate predictions about upcoming growth and trends and changes in consumer behaviour
- Growth of the market across APAC, Europe, North America, Middle East and Africa, and South America
- Thorough analysis of the market's competitive landscape and detailed information about companies
- Comprehensive analysis of factors that will challenge the pfc capacitors market growth of industry companies
We can help! Our analysts can customize this pfc capacitors market research report to meet your requirements.


