Pharmaceutical Logistics Market Analysis, Size, and Forecast 2025-2029: APAC (China, India, and Japan), North America (US, Canada, and Mexico), Europe (Germany, UK, and France), Middle East and Africa (Saudi Arabia, UAE, and South Africa), South America (Brazil, Argentina, and Colombia), and Rest of World (ROW)

Pharmaceutical Logistics Market Analysis, Size, and Forecast 2025-2029:
APAC (China, India, and Japan), North America (US, Canada, and Mexico), Europe (Germany, UK, and France), Middle East and Africa (Saudi Arabia, UAE, and South Africa), South America (Brazil, Argentina, and Colombia), and Rest of World (ROW)

Published: Dec 2025 291 Pages SKU: IRTNTR76725

Market Overview at a Glance

$44.36 B
Market Opportunity
8%
CAGR 2024 - 2029
42.6%
APAC Growth
$74.30 B
Non cold chain segment 2023

Pharmaceutical Logistics Market Size 2025-2029

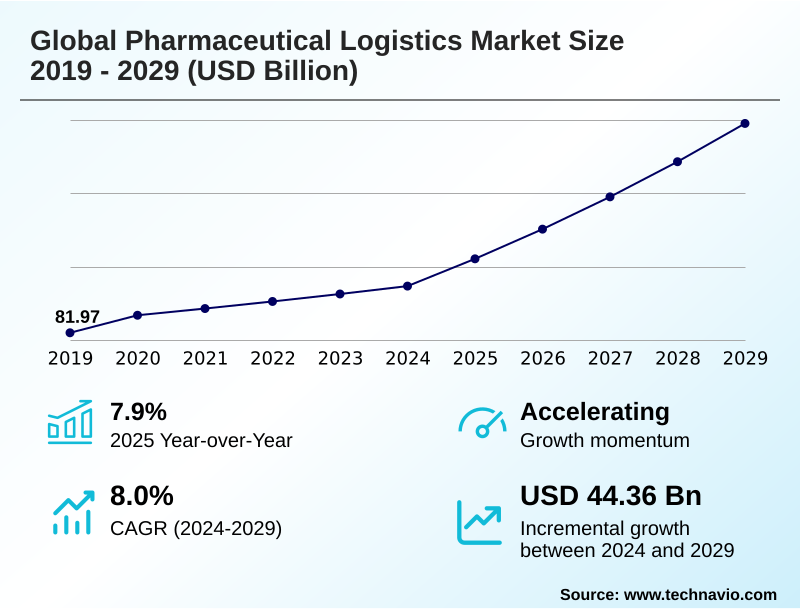
The pharmaceutical logistics market size is valued to increase by USD 44.36 billion, at a CAGR of 8% from 2024 to 2029. Ascendancy of biologics and temperature-sensitive pharmaceuticals will drive the pharmaceutical logistics market.

Major Market Trends & Insights

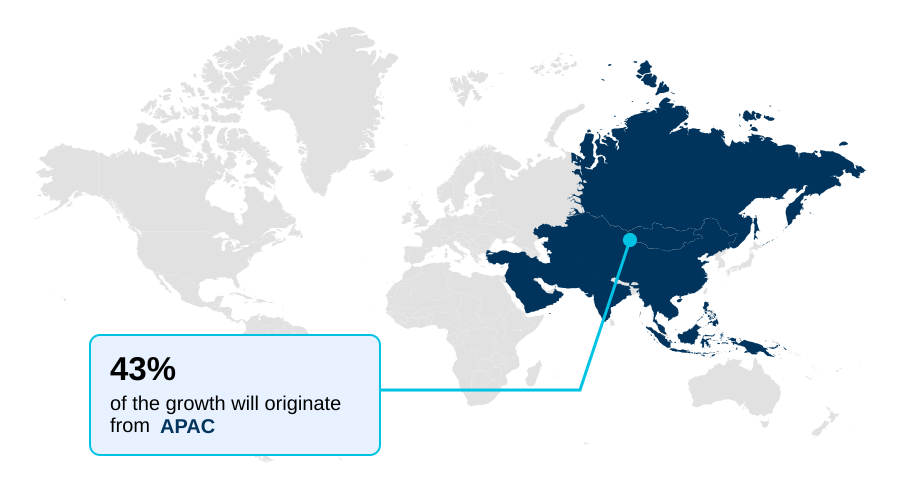
  • APAC dominated the market and accounted for a 42.6% growth during the forecast period.
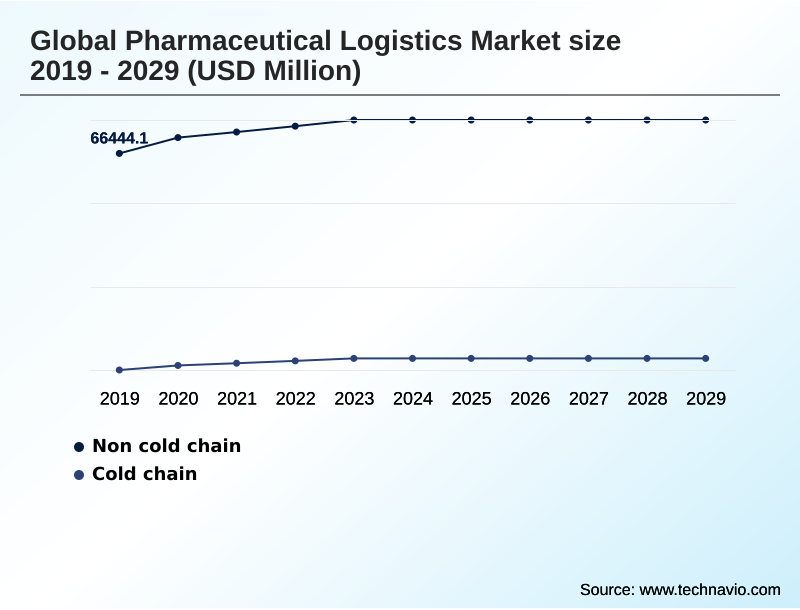
  • By Type - Non cold chain segment was valued at USD 74.30 billion in 2023
  • By Application - Storage segment accounted for the largest market revenue share in 2023

Market Size & Forecast

  • Market Opportunities: USD 57.09 billion
  • Market Future Opportunities: USD 44.36 billion
  • CAGR from 2024 to 2029 : 8%

Market Summary

  • The pharmaceutical logistics market is undergoing a significant transformation, driven by the shift towards high-value biologics and personalized medicines that demand impeccable supply chain execution. Core to this evolution is the expansion of cold chain logistics, which is no longer a niche service but a fundamental requirement for a growing portion of the pharmaceutical pipeline.
  • This necessitates substantial investment in temperature-controlled infrastructure and real-time monitoring technologies to ensure product integrity. A key trend is the digitalization of the supply chain, where technologies like AI and blockchain are being deployed to enhance traceability and predictive capabilities.
  • For instance, a logistics provider can use AI-powered analytics to model transportation routes, identifying potential weather-related risks and proactively rerouting a critical shipment of vaccines, thereby preventing a costly temperature excursion. However, navigating the complex web of global regulations and mitigating security risks like theft and counterfeiting remain persistent challenges.
  • Success in this market hinges on a provider's ability to integrate advanced technology with deep regulatory expertise to deliver secure, compliant, and efficient services.

What will be the Size of the Pharmaceutical Logistics Market during the forecast period?

Get Key Insights on Market Forecast (PDF) Request Free Sample

How is the Pharmaceutical Logistics Market Segmented?

The pharmaceutical logistics industry research report provides comprehensive data (region-wise segment analysis), with forecasts and estimates in "USD million" for the period 2025-2029, as well as historical data from 2019-2023 for the following segments.

  • Type
    • Non cold chain
    • Cold chain
  • Application
    • Storage
    • Transportation
  • Mode of transportation
    • Road
    • Sea
    • Air
    • Rail
  • Geography
    • APAC
      • China
      • India
      • Japan
    • North America
      • US
      • Canada
      • Mexico
    • Europe
      • Germany
      • UK
      • France
    • Middle East and Africa
      • Saudi Arabia
      • UAE
      • South Africa
    • South America
      • Brazil
      • Argentina
      • Colombia
    • Rest of World (ROW)

By Type Insights

The non cold chain segment is estimated to witness significant growth during the forecast period.

The non-cold chain segment, governed by good storage practices (gsp), forms a substantial part of the market, focusing on products stable at controlled room temperatures.

While distinct from cold chain logistics, this area still demands rigorous quality control to maintain the chain of custody and prevent deviations.

Logistics providers are enhancing security and visibility, with some achieving a 15% reduction in handling errors through advanced systems.

The principles of unit-level electronic traceability are increasingly applied to high-value ambient products to bolster supply chain resilience and uphold the chain of identity from manufacturer to patient.

This ensures end-to-end visibility and mitigates risks, even for products not requiring cryogenic storage facilities, reflecting a holistic approach to quality and patient-centric logistics.

Request Free Sample

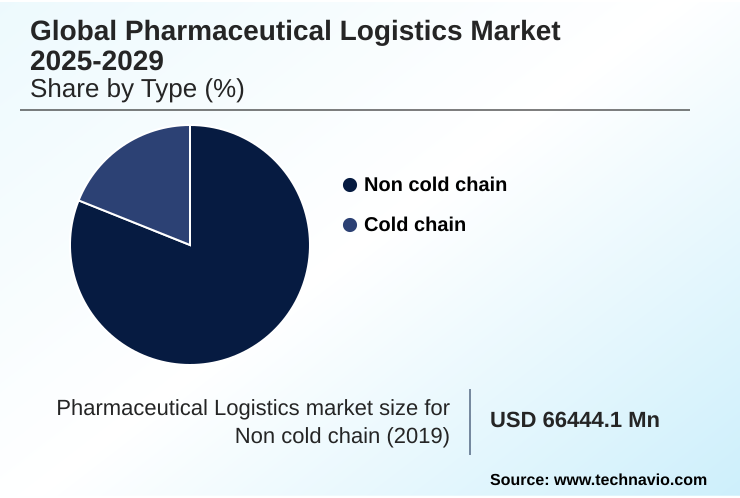
The Non cold chain segment was valued at USD 74.30 billion in 2023 and showed a gradual increase during the forecast period.

Request Free Sample

Regional Analysis

APAC is estimated to contribute 42.6% to the growth of the global market during the forecast period.Technavio’s analysts have elaborately explained the regional trends and drivers that shape the market during the forecast period.

See How Pharmaceutical Logistics Market Demand is Rising in APAC Request Free Sample

The geographic landscape is characterized by diverse regional dynamics, with APAC emerging as the fastest-growing market, while North America remains the largest in terms of value.

In APAC, rapid infrastructure development is underway to support its expanding role as a manufacturing hub, though challenges in last-mile delivery persist.

In contrast, North America and Europe focus on optimizing mature networks through technology, with an emphasis on good distribution practices (gdp).

The adoption of automated storage and retrieval systems (asrs) in these regions has improved warehouse efficiency by up to 25%. Across all regions, multi-modal transportation strategies are crucial for balancing cost and speed.

The implementation of sustainable logistics solutions is also gaining traction globally, influenced by regulations like the carbon border adjustment mechanism (cbam), pushing firms towards greener temperature-controlled packaging and logistics cost optimization.

Market Dynamics

Our researchers analyzed the data with 2024 as the base year, along with the key drivers, trends, and challenges. A holistic analysis of drivers will help companies refine their marketing strategies to gain a competitive advantage.

  • Strategic decision-making in the pharmaceutical logistics market is increasingly focused on specialized operational challenges. A core concern is effectively managing temperature excursions in cold chain, which requires robust protocols and technologies. Concurrently, optimizing last-mile specialty drug delivery is critical for patient-centric models, especially with the rise of decentralized clinical trial logistics solutions.
  • This shift necessitates a fresh cost analysis of active versus passive packaging to balance expense and risk. For compliance, understanding the nuances of DSCSA compliance for third-party logistics is non-negotiable in the US market, while on a global scale, navigating fragmented global regulatory landscapes remains a constant.
  • Securing high-value pharmaceutical shipments through advanced supply chain security protocols is paramount, often involving a combination of technology and physical security measures. The debate over blockchain implementation for drug traceability continues, with many seeing it as the future for ensuring data integrity in pharmaceutical serialization.
  • AI-powered predictive logistics analytics is transforming risk management, helping to foresee issues from geopolitical impacts on pharmaceutical transport to potential delays. This technology is crucial for optimizing multi-modal API logistics and validating temperature-controlled shipping lanes. Efficiently handling pharma returns and reverse logistics management has also become a key focus for cost control and compliance.
  • In parallel, warehouse automation for pharma distribution and addressing cryogenic supply chain management challenges are key investment areas. Firms that successfully integrate these strategies, such as using AI to improve route reliability by 20% over manual planning, are setting new industry benchmarks.

What are the key market drivers leading to the rise in the adoption of Pharmaceutical Logistics Industry?

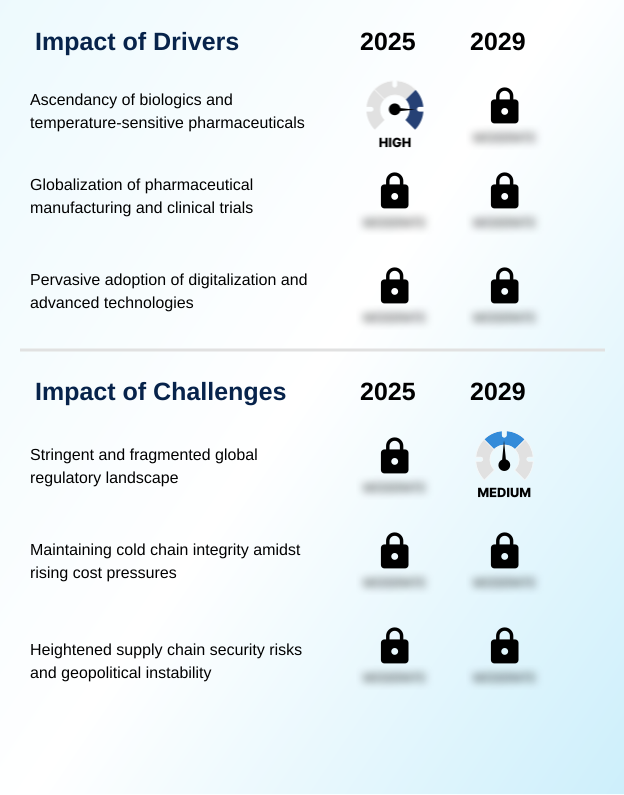
  • The ascendancy of biologics and other temperature-sensitive pharmaceuticals is a key driver compelling significant growth and innovation within the market.

  • The globalization of pharmaceutical manufacturing and clinical trials is a primary market driver, fueling demand for advanced clinical trial logistics to manage investigational medicinal products.
  • This creates a complex biologics supply chain that requires deep cross-border logistics expertise and robust supply chain resilience.
  • The adoption of real-time monitoring technology, including remote temperature monitoring, provides critical oversight and has reduced product loss from temperature deviations by over 25% for early adopters.
  • Furthermore, regulatory mandates are compelling the industry-wide adoption of serialization data exchange using standards like gs1 electronic product code information services (epcis).
  • This requirement for data aggregation and reporting, combined with the use of demand forecasting algorithms, is enhancing supply chain visibility and predictability, making operations more efficient.

What are the market trends shaping the Pharmaceutical Logistics Industry?

  • A significant market trend is the move toward hyper-specialization in logistics, particularly for products requiring cryogenic and ultra-low temperature conditions. This shift addresses the complex needs of advanced therapies.

  • Market trends are pivoting towards hyper-specialization, driven by the complex needs of advanced therapy medicinal products (atmps) and cell and gene therapies (cgts). This shift necessitates investment in cryogenic shipping and ultra-low temperature (ult) storage capabilities.
  • To manage these sensitive supply chains, companies are adopting digital control towers powered by predictive analytics, which have been shown to improve on-time delivery rates by up to 15%. This technological adoption supports a move towards more patient-centric logistics models.
  • The integration of digital twin modeling creates a proactive intervention capability, allowing for the simulation of shipment routes and stress-testing of packaging solutions. Building a gxp-compliant network supported by interoperable electronic systems is crucial for ensuring both regulatory adherence and operational excellence in this evolving landscape.

What challenges does the Pharmaceutical Logistics Industry face during its growth?

  • The stringent and fragmented nature of the global regulatory landscape presents a significant challenge to market growth and operational efficiency.

  • Navigating stringent global regulations remains a significant market challenge, demanding sophisticated regulatory compliance management. Mandates like the drug supply chain security act (dscsa) require the creation of a seamless, auditable trail, pushing firms towards technologies like blockchain traceability. Simultaneously, heightened security threats necessitate advanced supply chain security protocols.
  • To combat cargo theft, companies are deploying secure truck convoys, often supported by geofencing alarms and dual-driver teams, which has been shown to reduce in-transit theft incidents by up to 60% in high-risk corridors. Mitigating temperature excursion risk across increasingly complex validated shipping lanes is another critical hurdle.
  • Even with advanced technology, the operational and financial pressures of managing a secure and compliant network, including efficient reverse logistics, are substantial for all service providers.

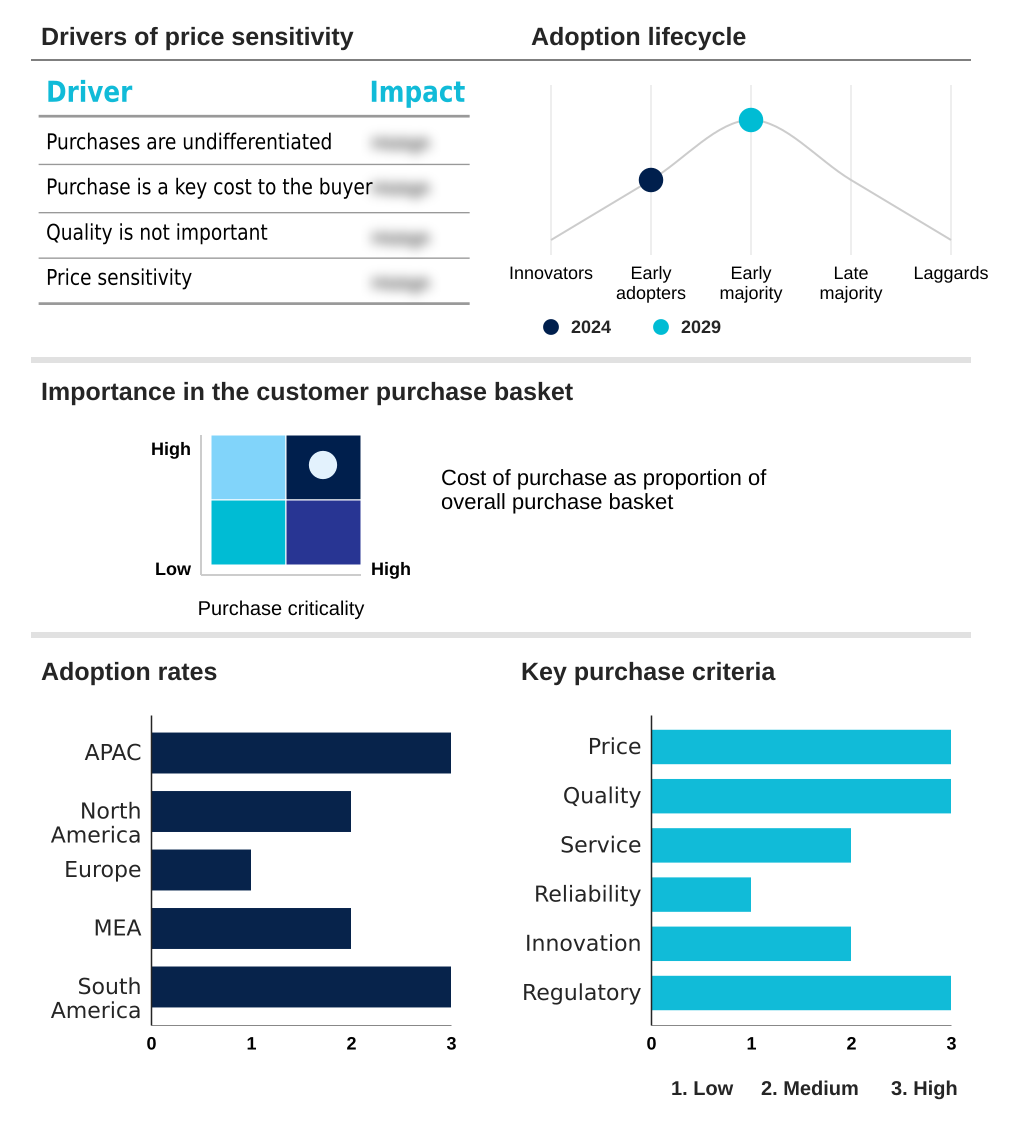
Exclusive Technavio Analysis on Customer Landscape

The pharmaceutical logistics market forecasting report includes the adoption lifecycle of the market, covering from the innovator’s stage to the laggard’s stage. It focuses on adoption rates in different regions based on penetration. Furthermore, the pharmaceutical logistics market report also includes key purchase criteria and drivers of price sensitivity to help companies evaluate and develop their market growth analysis strategies.

Customer Landscape of Pharmaceutical Logistics Industry

Competitive Landscape

Companies are implementing various strategies, such as strategic alliances, pharmaceutical logistics market forecast, partnerships, mergers and acquisitions, geographical expansion, and product/service launches, to enhance their presence in the industry.

AP Moller Maersk AS - Offerings include international, temperature-controlled freight forwarding and comprehensive hub management solutions designed specifically for global pharmaceutical product distribution.

The industry research and growth report includes detailed analyses of the competitive landscape of the market and information about key companies, including:

  • AP Moller Maersk AS
  • AWL India Pvt. Ltd.
  • Bollore Logistics
  • CEVA Logistics SA
  • CJ CheilJedang Corp.
  • CMA CGM Group
  • DACHSER SE
  • DHL International GmbH
  • DSV AS
  • FedEx Corp.
  • Gemadept Corp.
  • GEODIS
  • Kuehne Nagel Management AG
  • Rhenus SE and Co. KG
  • Schenker AG
  • SF Express Co. Ltd.
  • Tiong Nam Logistics Holdings Berhad
  • United Parcel Service Inc.
  • YCH Group
  • YUSEN LOGISTICS CO. LTD.

Qualitative and quantitative analysis of companies has been conducted to help clients understand the wider business environment as well as the strengths and weaknesses of key industry players. Data is qualitatively analyzed to categorize companies as pure play, category-focused, industry-focused, and diversified; it is quantitatively analyzed to categorize companies as dominant, leading, strong, tentative, and weak.

Recent Development and News in Pharmaceutical logistics market

  • In September, 2024, Kuehne + Nagel Management AG announced a strategic partnership with a leading technology firm to implement a blockchain-based platform, enhancing the traceability of cell and gene therapies across its global network.
  • In November, 2024, United Parcel Service Inc. launched its enhanced UPS Premier Platinum service, integrating next-generation sensor technology and priority handling to offer near real-time monitoring and intervention for critical cryogenic shipments.
  • In February, 2025, DHL International GmbH completed the acquisition of a specialized European last-mile delivery provider, expanding its direct-to-patient service capabilities and strengthening its temperature-controlled ground network.
  • In April, 2025, CEVA Logistics SA received IATA CEIV Pharma certification for its new 10,000 square meter life sciences facility at a major Asian airport, boosting its capacity for handling temperature-sensitive biologics and vaccines in the region.

Dive into Technavio’s robust research methodology, blending expert interviews, extensive data synthesis, and validated models for unparalleled Pharmaceutical Logistics Market insights. See full methodology.

Market Scope
Page number 291
Base year 2024
Historic period 2019-2023
Forecast period 2025-2029
Growth momentum & CAGR Accelerate at a CAGR of 8%
Market growth 2025-2029 USD 44356.8 million
Market structure Fragmented
YoY growth 2024-2025(%) 7.9%
Key countries China, India, Japan, Australia, South Korea, Indonesia, US, Canada, Mexico, Germany, UK, France, Italy, Spain, The Netherlands, Saudi Arabia, UAE, South Africa, Israel, Turkey, Brazil, Argentina and Colombia
Competitive landscape Leading Companies, Market Positioning of Companies, Competitive Strategies, and Industry Risks

Request Free Sample

Research Analyst Overview

  • The pharmaceutical logistics market is defined by a sophisticated interplay of technology, regulation, and specialized services. The ascent of cell and gene therapies (cgts) has intensified the need for flawless cold chain logistics, including cryogenic shipping and a verifiable chain of custody.
  • Compliance with mandates like the drug supply chain security act (dscsa) is driving the adoption of unit-level electronic traceability and robust serialization data exchange, with platforms enabling a 40% faster verification process. This necessitates a secure digital infrastructure capable of supporting technologies like blockchain traceability.
  • To manage the biologics supply chain, firms utilize digital control towers with predictive analytics for overseeing investigational medicinal products in clinical trial logistics. Execution relies on validated shipping lanes, advanced temperature-controlled packaging, and both active temperature control containers and passive thermal packaging.
  • At the facility level, adherence to good distribution practices (gdp) and good storage practices (gsp) is critical, with automated storage and retrieval systems (asrs) enhancing efficiency.
  • Boardroom decisions increasingly center on capital expenditure for these technologies to mitigate risk and ensure compliance, as security threats demand solutions from secure truck convoys to comprehensive reverse logistics protocols to maintain the chain of identity.

What are the Key Data Covered in this Pharmaceutical Logistics Market Research and Growth Report?

  • What is the expected growth of the Pharmaceutical Logistics Market between 2025 and 2029?

    • USD 44.36 billion, at a CAGR of 8%

  • What segmentation does the market report cover?

    • The report is segmented by Type (Non cold chain, and Cold chain), Application (Storage, and Transportation), Mode of Transportation (Road, Sea, Air, and Rail) and Geography (APAC, North America, Europe, Middle East and Africa, South America)

  • Which regions are analyzed in the report?

    • APAC, North America, Europe, Middle East and Africa and South America

  • What are the key growth drivers and market challenges?

    • Ascendancy of biologics and temperature-sensitive pharmaceuticals, Stringent and fragmented global regulatory landscape

  • Who are the major players in the Pharmaceutical Logistics Market?

    • AP Moller Maersk AS, AWL India Pvt. Ltd., Bollore Logistics, CEVA Logistics SA, CJ CheilJedang Corp., CMA CGM Group, DACHSER SE, DHL International GmbH, DSV AS, FedEx Corp., Gemadept Corp., GEODIS, Kuehne Nagel Management AG, Rhenus SE and Co. KG, Schenker AG, SF Express Co. Ltd., Tiong Nam Logistics Holdings Berhad, United Parcel Service Inc., YCH Group and YUSEN LOGISTICS CO. LTD.

Market Research Insights

  • The market's dynamics are increasingly shaped by a focus on end-to-end visibility and proactive risk management, driven by advanced technologies. Implementing digital twin modeling allows firms to simulate supply chain disruptions, improving contingency planning effectiveness by over 40%.
  • The adoption of robust warehouse management systems (wms) integrated with demand forecasting algorithms has led to a 15% reduction in inventory holding costs while enhancing supply chain resilience. Furthermore, a commitment to sustainable logistics solutions is becoming a competitive differentiator, with some operators achieving a 10% reduction in carbon emissions on key trade lanes.
  • These advancements in proactive intervention capability and logistics cost optimization are critical for maintaining a competitive edge in a market defined by complex regulatory compliance management and the need for high-integrity, patient-centric logistics.

We can help! Our analysts can customize this pharmaceutical logistics market research report to meet your requirements.

Get in touch

1. Executive Summary

1.1 Market overview

Executive Summary - Chart on Market Overview
Executive Summary - Data Table on Market Overview
Executive Summary - Chart on Global Market Characteristics
Executive Summary - Chart on Market by Geography
Executive Summary - Chart on Market Segmentation by Type
Executive Summary - Chart on Market Segmentation by Application
Executive Summary - Chart on Market Segmentation by Mode of Transportation
Executive Summary - Chart on Incremental Growth
Executive Summary - Data Table on Incremental Growth
Executive Summary - Chart on Company Market Positioning

2. Technavio Analysis

2.1 Analysis of price sensitivity, lifecycle, customer purchase basket, adoption rates, and purchase criteria

2.2 Criticality of inputs and Factors of differentiation

Chart on Overview on criticality of inputs and factors of differentiation

2.3 Factors of disruption

Chart on Overview on factors of disruption

2.4 Impact of drivers and challenges

Chart on Impact of drivers and challenges in 2024 and 2029

3. Market Landscape

3.1 Market ecosystem

Chart on Parent Market
Data Table on - Parent Market

3.2 Market characteristics

Chart on Market characteristics analysis

3.3 Value chain analysis

Chart on Value chain analysis

4. Market Sizing

4.1 Market definition

Data Table on Offerings of companies included in the market definition

4.2 Market segment analysis

Market segments

4.3 Market size 2024

4.4 Market outlook: Forecast for 2024-2029

Chart on Global - Market size and forecast 2024-2029 ($ million)
Data Table on Global - Market size and forecast 2024-2029 ($ million)
Chart on Global Market: Year-over-year growth 2024-2029 (%)
Data Table on Global Market: Year-over-year growth 2024-2029 (%)

5. Historic Market Size

5.1 Global Pharmaceutical Logistics Market 2019 - 2023

Historic Market Size - Data Table on Global Pharmaceutical Logistics Market 2019 - 2023 ($ million)

5.2 Type segment analysis 2019 - 2023

Historic Market Size - Type Segment 2019 - 2023 ($ million)

5.3 Application segment analysis 2019 - 2023

Historic Market Size - Application Segment 2019 - 2023 ($ million)

5.4 Mode of Transportation segment analysis 2019 - 2023

Historic Market Size - Mode of Transportation Segment 2019 - 2023 ($ million)

5.5 Geography segment analysis 2019 - 2023

Historic Market Size - Geography Segment 2019 - 2023 ($ million)

5.6 Country segment analysis 2019 - 2023

Historic Market Size - Country Segment 2019 - 2023 ($ million)

6. Qualitative Analysis

6.1 The AI impact on Global Pharmaceutical Logistics Market

7. Five Forces Analysis

7.1 Five forces summary

Five forces analysis - Comparison between 2024 and 2029

7.2 Bargaining power of buyers

Bargaining power of buyers - Impact of key factors 2024 and 2029

7.3 Bargaining power of suppliers

Bargaining power of suppliers - Impact of key factors in 2024 and 2029

7.4 Threat of new entrants

Threat of new entrants - Impact of key factors in 2024 and 2029

7.5 Threat of substitutes

Threat of substitutes - Impact of key factors in 2024 and 2029

7.6 Threat of rivalry

Threat of rivalry - Impact of key factors in 2024 and 2029

7.7 Market condition

Chart on Market condition - Five forces 2024 and 2029

8. Market Segmentation by Type

8.1 Market segments

Chart on Type - Market share 2024-2029 (%)
Data Table on Type - Market share 2024-2029 (%)

8.2 Comparison by Type

Chart on Comparison by Type
Data Table on Comparison by Type

8.3 Non cold chain - Market size and forecast 2024-2029

Chart on Non cold chain - Market size and forecast 2024-2029 ($ million)
Data Table on Non cold chain - Market size and forecast 2024-2029 ($ million)
Chart on Non cold chain - Year-over-year growth 2024-2029 (%)
Data Table on Non cold chain - Year-over-year growth 2024-2029 (%)

8.4 Cold chain - Market size and forecast 2024-2029

Chart on Cold chain - Market size and forecast 2024-2029 ($ million)
Data Table on Cold chain - Market size and forecast 2024-2029 ($ million)
Chart on Cold chain - Year-over-year growth 2024-2029 (%)
Data Table on Cold chain - Year-over-year growth 2024-2029 (%)

8.5 Market opportunity by Type

Market opportunity by Type ($ million)
Data Table on Market opportunity by Type ($ million)

9. Market Segmentation by Application

9.1 Market segments

Chart on Application - Market share 2024-2029 (%)
Data Table on Application - Market share 2024-2029 (%)

9.2 Comparison by Application

Chart on Comparison by Application
Data Table on Comparison by Application

9.3 Storage - Market size and forecast 2024-2029

Chart on Storage - Market size and forecast 2024-2029 ($ million)
Data Table on Storage - Market size and forecast 2024-2029 ($ million)
Chart on Storage - Year-over-year growth 2024-2029 (%)
Data Table on Storage - Year-over-year growth 2024-2029 (%)

9.4 Transportation - Market size and forecast 2024-2029

Chart on Transportation - Market size and forecast 2024-2029 ($ million)
Data Table on Transportation - Market size and forecast 2024-2029 ($ million)
Chart on Transportation - Year-over-year growth 2024-2029 (%)
Data Table on Transportation - Year-over-year growth 2024-2029 (%)

9.5 Market opportunity by Application

Market opportunity by Application ($ million)
Data Table on Market opportunity by Application ($ million)

10. Market Segmentation by Mode of Transportation

10.1 Market segments

Chart on Mode of Transportation - Market share 2024-2029 (%)
Data Table on Mode of Transportation - Market share 2024-2029 (%)

10.2 Comparison by Mode of Transportation

Chart on Comparison by Mode of Transportation
Data Table on Comparison by Mode of Transportation

10.3 Road - Market size and forecast 2024-2029

Chart on Road - Market size and forecast 2024-2029 ($ million)
Data Table on Road - Market size and forecast 2024-2029 ($ million)
Chart on Road - Year-over-year growth 2024-2029 (%)
Data Table on Road - Year-over-year growth 2024-2029 (%)

10.4 Sea - Market size and forecast 2024-2029

Chart on Sea - Market size and forecast 2024-2029 ($ million)
Data Table on Sea - Market size and forecast 2024-2029 ($ million)
Chart on Sea - Year-over-year growth 2024-2029 (%)
Data Table on Sea - Year-over-year growth 2024-2029 (%)

10.5 Air - Market size and forecast 2024-2029

Chart on Air - Market size and forecast 2024-2029 ($ million)
Data Table on Air - Market size and forecast 2024-2029 ($ million)
Chart on Air - Year-over-year growth 2024-2029 (%)
Data Table on Air - Year-over-year growth 2024-2029 (%)

10.6 Rail - Market size and forecast 2024-2029

Chart on Rail - Market size and forecast 2024-2029 ($ million)
Data Table on Rail - Market size and forecast 2024-2029 ($ million)
Chart on Rail - Year-over-year growth 2024-2029 (%)
Data Table on Rail - Year-over-year growth 2024-2029 (%)

10.7 Market opportunity by Mode of Transportation

Market opportunity by Mode of Transportation ($ million)
Data Table on Market opportunity by Mode of Transportation ($ million)

11. Customer Landscape

11.1 Customer landscape overview

Analysis of price sensitivity, lifecycle, customer purchase basket, adoption rates, and purchase criteria

12. Geographic Landscape

12.1 Geographic segmentation

Chart on Market share by geography 2024-2029 (%)
Data Table on Market share by geography 2024-2029 (%)

12.2 Geographic comparison

Chart on Geographic comparison
Data Table on Geographic comparison

12.3 APAC - Market size and forecast 2024-2029

Chart on APAC - Market size and forecast 2024-2029 ($ million)
Data Table on APAC - Market size and forecast 2024-2029 ($ million)
Chart on APAC - Year-over-year growth 2024-2029 (%)
Data Table on APAC - Year-over-year growth 2024-2029 (%)
Chart on Regional Comparison - APAC
Data Table on Regional Comparison - APAC

12.3.1 China - Market size and forecast 2024-2029

Chart on China - Market size and forecast 2024-2029 ($ million)
Data Table on China - Market size and forecast 2024-2029 ($ million)
Chart on China - Year-over-year growth 2024-2029 (%)
Data Table on China - Year-over-year growth 2024-2029 (%)

12.3.2 India - Market size and forecast 2024-2029

Chart on India - Market size and forecast 2024-2029 ($ million)
Data Table on India - Market size and forecast 2024-2029 ($ million)
Chart on India - Year-over-year growth 2024-2029 (%)
Data Table on India - Year-over-year growth 2024-2029 (%)

12.3.3 Japan - Market size and forecast 2024-2029

Chart on Japan - Market size and forecast 2024-2029 ($ million)
Data Table on Japan - Market size and forecast 2024-2029 ($ million)
Chart on Japan - Year-over-year growth 2024-2029 (%)
Data Table on Japan - Year-over-year growth 2024-2029 (%)

12.3.4 Australia - Market size and forecast 2024-2029

Chart on Australia - Market size and forecast 2024-2029 ($ million)
Data Table on Australia - Market size and forecast 2024-2029 ($ million)
Chart on Australia - Year-over-year growth 2024-2029 (%)
Data Table on Australia - Year-over-year growth 2024-2029 (%)

12.3.5 South Korea - Market size and forecast 2024-2029

Chart on South Korea - Market size and forecast 2024-2029 ($ million)
Data Table on South Korea - Market size and forecast 2024-2029 ($ million)
Chart on South Korea - Year-over-year growth 2024-2029 (%)
Data Table on South Korea - Year-over-year growth 2024-2029 (%)

12.3.6 Indonesia - Market size and forecast 2024-2029

Chart on Indonesia - Market size and forecast 2024-2029 ($ million)
Data Table on Indonesia - Market size and forecast 2024-2029 ($ million)
Chart on Indonesia - Year-over-year growth 2024-2029 (%)
Data Table on Indonesia - Year-over-year growth 2024-2029 (%)

12.4 North America - Market size and forecast 2024-2029

Chart on North America - Market size and forecast 2024-2029 ($ million)
Data Table on North America - Market size and forecast 2024-2029 ($ million)
Chart on North America - Year-over-year growth 2024-2029 (%)
Data Table on North America - Year-over-year growth 2024-2029 (%)
Chart on Regional Comparison - North America
Data Table on Regional Comparison - North America

12.4.1 US - Market size and forecast 2024-2029

Chart on US - Market size and forecast 2024-2029 ($ million)
Data Table on US - Market size and forecast 2024-2029 ($ million)
Chart on US - Year-over-year growth 2024-2029 (%)
Data Table on US - Year-over-year growth 2024-2029 (%)

12.4.2 Canada - Market size and forecast 2024-2029

Chart on Canada - Market size and forecast 2024-2029 ($ million)
Data Table on Canada - Market size and forecast 2024-2029 ($ million)
Chart on Canada - Year-over-year growth 2024-2029 (%)
Data Table on Canada - Year-over-year growth 2024-2029 (%)

12.4.3 Mexico - Market size and forecast 2024-2029

Chart on Mexico - Market size and forecast 2024-2029 ($ million)
Data Table on Mexico - Market size and forecast 2024-2029 ($ million)
Chart on Mexico - Year-over-year growth 2024-2029 (%)
Data Table on Mexico - Year-over-year growth 2024-2029 (%)

12.5 Europe - Market size and forecast 2024-2029

Chart on Europe - Market size and forecast 2024-2029 ($ million)
Data Table on Europe - Market size and forecast 2024-2029 ($ million)
Chart on Europe - Year-over-year growth 2024-2029 (%)
Data Table on Europe - Year-over-year growth 2024-2029 (%)
Chart on Regional Comparison - Europe
Data Table on Regional Comparison - Europe

12.5.1 Germany - Market size and forecast 2024-2029

Chart on Germany - Market size and forecast 2024-2029 ($ million)
Data Table on Germany - Market size and forecast 2024-2029 ($ million)
Chart on Germany - Year-over-year growth 2024-2029 (%)
Data Table on Germany - Year-over-year growth 2024-2029 (%)

12.5.2 UK - Market size and forecast 2024-2029

Chart on UK - Market size and forecast 2024-2029 ($ million)
Data Table on UK - Market size and forecast 2024-2029 ($ million)
Chart on UK - Year-over-year growth 2024-2029 (%)
Data Table on UK - Year-over-year growth 2024-2029 (%)

12.5.3 France - Market size and forecast 2024-2029

Chart on France - Market size and forecast 2024-2029 ($ million)
Data Table on France - Market size and forecast 2024-2029 ($ million)
Chart on France - Year-over-year growth 2024-2029 (%)
Data Table on France - Year-over-year growth 2024-2029 (%)

12.5.4 Italy - Market size and forecast 2024-2029

Chart on Italy - Market size and forecast 2024-2029 ($ million)
Data Table on Italy - Market size and forecast 2024-2029 ($ million)
Chart on Italy - Year-over-year growth 2024-2029 (%)
Data Table on Italy - Year-over-year growth 2024-2029 (%)

12.5.5 Spain - Market size and forecast 2024-2029

Chart on Spain - Market size and forecast 2024-2029 ($ million)
Data Table on Spain - Market size and forecast 2024-2029 ($ million)
Chart on Spain - Year-over-year growth 2024-2029 (%)
Data Table on Spain - Year-over-year growth 2024-2029 (%)

12.5.6 The Netherlands - Market size and forecast 2024-2029

Chart on The Netherlands - Market size and forecast 2024-2029 ($ million)
Data Table on The Netherlands - Market size and forecast 2024-2029 ($ million)
Chart on The Netherlands - Year-over-year growth 2024-2029 (%)
Data Table on The Netherlands - Year-over-year growth 2024-2029 (%)

12.6 Middle East and Africa - Market size and forecast 2024-2029

Chart on Middle East and Africa - Market size and forecast 2024-2029 ($ million)
Data Table on Middle East and Africa - Market size and forecast 2024-2029 ($ million)
Chart on Middle East and Africa - Year-over-year growth 2024-2029 (%)
Data Table on Middle East and Africa - Year-over-year growth 2024-2029 (%)
Chart on Regional Comparison - Middle East and Africa
Data Table on Regional Comparison - Middle East and Africa

12.6.1 Saudi Arabia - Market size and forecast 2024-2029

Chart on Saudi Arabia - Market size and forecast 2024-2029 ($ million)
Data Table on Saudi Arabia - Market size and forecast 2024-2029 ($ million)
Chart on Saudi Arabia - Year-over-year growth 2024-2029 (%)
Data Table on Saudi Arabia - Year-over-year growth 2024-2029 (%)

12.6.2 UAE - Market size and forecast 2024-2029

Chart on UAE - Market size and forecast 2024-2029 ($ million)
Data Table on UAE - Market size and forecast 2024-2029 ($ million)
Chart on UAE - Year-over-year growth 2024-2029 (%)
Data Table on UAE - Year-over-year growth 2024-2029 (%)

12.6.3 South Africa - Market size and forecast 2024-2029

Chart on South Africa - Market size and forecast 2024-2029 ($ million)
Data Table on South Africa - Market size and forecast 2024-2029 ($ million)
Chart on South Africa - Year-over-year growth 2024-2029 (%)
Data Table on South Africa - Year-over-year growth 2024-2029 (%)

12.6.4 Israel - Market size and forecast 2024-2029

Chart on Israel - Market size and forecast 2024-2029 ($ million)
Data Table on Israel - Market size and forecast 2024-2029 ($ million)
Chart on Israel - Year-over-year growth 2024-2029 (%)
Data Table on Israel - Year-over-year growth 2024-2029 (%)

12.6.5 Turkey - Market size and forecast 2024-2029

Chart on Turkey - Market size and forecast 2024-2029 ($ million)
Data Table on Turkey - Market size and forecast 2024-2029 ($ million)
Chart on Turkey - Year-over-year growth 2024-2029 (%)
Data Table on Turkey - Year-over-year growth 2024-2029 (%)

12.7 South America - Market size and forecast 2024-2029

Chart on South America - Market size and forecast 2024-2029 ($ million)
Data Table on South America - Market size and forecast 2024-2029 ($ million)
Chart on South America - Year-over-year growth 2024-2029 (%)
Data Table on South America - Year-over-year growth 2024-2029 (%)
Chart on Regional Comparison - South America
Data Table on Regional Comparison - South America

12.7.1 Brazil - Market size and forecast 2024-2029

Chart on Brazil - Market size and forecast 2024-2029 ($ million)
Data Table on Brazil - Market size and forecast 2024-2029 ($ million)
Chart on Brazil - Year-over-year growth 2024-2029 (%)
Data Table on Brazil - Year-over-year growth 2024-2029 (%)

12.7.2 Argentina - Market size and forecast 2024-2029

Chart on Argentina - Market size and forecast 2024-2029 ($ million)
Data Table on Argentina - Market size and forecast 2024-2029 ($ million)
Chart on Argentina - Year-over-year growth 2024-2029 (%)
Data Table on Argentina - Year-over-year growth 2024-2029 (%)

12.7.3 Colombia - Market size and forecast 2024-2029

Chart on Colombia - Market size and forecast 2024-2029 ($ million)
Data Table on Colombia - Market size and forecast 2024-2029 ($ million)
Chart on Colombia - Year-over-year growth 2024-2029 (%)
Data Table on Colombia - Year-over-year growth 2024-2029 (%)

12.8 Market opportunity by geography

Market opportunity by geography ($ million)
Data Tables on Market opportunity by geography ($ million)

13. Drivers, Challenges, and Opportunity

13.1 Market drivers

Ascendancy of biologics and temperature-sensitive pharmaceuticals
Globalization of pharmaceutical manufacturing and clinical trials
Pervasive adoption of digitalization and advanced technologies

13.2 Market challenges

Stringent and fragmented global regulatory landscape
Maintaining cold chain integrity amidst rising cost pressures
Heightened supply chain security risks and geopolitical instability

13.3 Impact of drivers and challenges

Impact of drivers and challenges in 2024 and 2029

13.4 Market opportunities

Hyper-specialization in cryogenic and ultra-low temperature logistics
Proliferation of AI-powered predictive analytics and digital control towers
Ascendancy of direct-to-patient and decentralized clinical trial logistics

14. Competitive Landscape

14.1 Overview

14.2

Overview on criticality of inputs and factors of differentiation

14.3 Landscape disruption

Overview on factors of disruption

14.4 Industry risks

Impact of key risks on business

15. Competitive Analysis

15.1 Companies profiled

Companies covered

15.2 Company ranking index

15.3 Market positioning of companies

Matrix on companies position and classification

15.4 Bollore Logistics

Bollore Logistics - Overview
Bollore Logistics - Product / Service
Bollore Logistics - Key offerings
SWOT

15.5 CJ CheilJedang Corp.

CJ CheilJedang Corp. - Overview
CJ CheilJedang Corp. - Business segments
CJ CheilJedang Corp. - Key news
CJ CheilJedang Corp. - Key offerings
CJ CheilJedang Corp. - Segment focus
SWOT

15.6 CMA CGM Group

CMA CGM Group - Overview
CMA CGM Group - Product / Service
CMA CGM Group - Key news
CMA CGM Group - Key offerings
SWOT

15.7 DHL International GmbH

DHL International GmbH - Overview
DHL International GmbH - Business segments
DHL International GmbH - Key news
DHL International GmbH - Key offerings
DHL International GmbH - Segment focus
SWOT

15.8 DSV AS

DSV AS - Overview
DSV AS - Business segments
DSV AS - Key offerings
DSV AS - Segment focus
SWOT

15.9 FedEx Corp.

FedEx Corp. - Overview
FedEx Corp. - Business segments
FedEx Corp. - Key news
FedEx Corp. - Key offerings
FedEx Corp. - Segment focus
SWOT

15.10 Gemadept Corp.

Gemadept Corp. - Overview
Gemadept Corp. - Product / Service
Gemadept Corp. - Key offerings
SWOT

15.11 GEODIS

GEODIS - Overview
GEODIS - Product / Service
GEODIS - Key offerings
SWOT

15.12 Kuehne Nagel Management AG

Kuehne Nagel Management AG - Overview
Kuehne Nagel Management AG - Business segments
Kuehne Nagel Management AG - Key news
Kuehne Nagel Management AG - Key offerings
Kuehne Nagel Management AG - Segment focus
SWOT

15.13 Schenker AG

Schenker AG - Overview
Schenker AG - Product / Service
Schenker AG - Key offerings
SWOT

15.14 SF Express Co. Ltd.

SF Express Co. Ltd. - Overview
SF Express Co. Ltd. - Business segments
SF Express Co. Ltd. - Key offerings
SF Express Co. Ltd. - Segment focus
SWOT

15.15 Tiong Nam Logistics Holdings Berhad

Tiong Nam Logistics Holdings Berhad - Overview
Tiong Nam Logistics Holdings Berhad - Product / Service
Tiong Nam Logistics Holdings Berhad - Key offerings
SWOT

15.16 United Parcel Service Inc.

United Parcel Service Inc. - Overview
United Parcel Service Inc. - Business segments
United Parcel Service Inc. - Key news
United Parcel Service Inc. - Key offerings
United Parcel Service Inc. - Segment focus
SWOT

15.17 YCH Group

YCH Group - Overview
YCH Group - Product / Service
YCH Group - Key offerings
SWOT

15.18 YUSEN LOGISTICS CO. LTD.

YUSEN LOGISTICS CO. LTD. - Overview
YUSEN LOGISTICS CO. LTD. - Product / Service
YUSEN LOGISTICS CO. LTD. - Key offerings
SWOT

16. Appendix

16.1 Scope of the report

Market definition
Objectives
Notes and caveats

16.2 Inclusions and exclusions checklist

Inclusions checklist
Exclusions checklist

16.3 Currency conversion rates for US$

16.4 Research methodology

16.5 Data procurement

Information sources

16.6 Data validation

16.7 Validation techniques employed for market sizing

16.8 Data synthesis

16.9 360 degree market analysis

16.10 List of abbreviations

Research Methodology

Technavio presents a detailed picture of the market by way of study, synthesis, and summation of data from multiple sources. The analysts have presented the various facets of the market with a particular focus on identifying the key industry influencers. The data thus presented is comprehensive, reliable, and the result of extensive research, both primary and secondary.

INFORMATION SOURCES

Primary sources

  • Manufacturers and suppliers
  • Channel partners
  • Industry experts
  • Strategic decision makers

Secondary sources

  • Industry journals and periodicals
  • Government data
  • Financial reports of key industry players
  • Historical data
  • Press releases

DATA ANALYSIS

Data Synthesis

  • Collation of data
  • Estimation of key figures
  • Analysis of derived insights

Data Validation

  • Triangulation with data models
  • Reference against proprietary databases
  • Corroboration with industry experts

REPORT WRITING

Qualitative

  • Market drivers
  • Market challenges
  • Market trends
  • Five forces analysis

Quantitative

  • Market size and forecast
  • Market segmentation
  • Geographical insights
  • Competitive landscape

Interested in this report?

Get your sample now to see our research methodology and insights!

Download Now

Frequently Asked Questions

Pharmaceutical Logistics market growth will increase by USD 44356.8 million during 2025-2029.

The Pharmaceutical Logistics market is expected to grow at a CAGR of 8% during 2025-2029.

Pharmaceutical Logistics market is segmented by Type (Non cold chain, Cold chain) Application (Storage, Transportation) Mode of transportation (Road, Sea, Air, Rail)

AP Moller Maersk AS, AWL India Pvt. Ltd., Bollore Logistics, CEVA Logistics SA, CJ CheilJedang Corp., CMA CGM Group, DACHSER SE, DHL International GmbH, DSV AS, FedEx Corp., Gemadept Corp., GEODIS, Kuehne Nagel Management AG, Rhenus SE and Co. KG, Schenker AG, SF Express Co. Ltd., Tiong Nam Logistics Holdings Berhad, United Parcel Service Inc., YCH Group, YUSEN LOGISTICS CO. LTD. are a few of the key vendors in the Pharmaceutical Logistics market.

APAC will register the highest growth rate of 42.6% among the other regions. Therefore, the Pharmaceutical Logistics market in APAC is expected to garner significant business opportunities for the vendors during the forecast period.

China, India, Japan, Australia, South Korea, Indonesia, US, Canada, Mexico, Germany, UK, France, Italy, Spain, The Netherlands, Saudi Arabia, UAE, South Africa, Israel, Turkey, Brazil, Argentina, Colombia

  • Ascendancy of biologics and temperature-sensitive pharmaceuticals is the driving factor this market.

The Pharmaceutical Logistics market vendors should focus on grabbing business opportunities from the Type segment as it accounted for the largest market share in the base year.