



Denmark Pharmaceutical Market Size 2026-2030
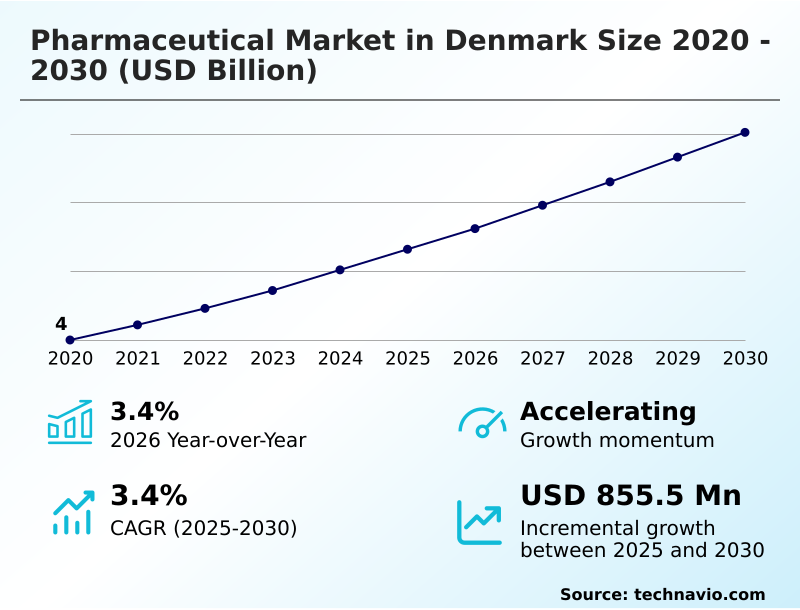
The denmark pharmaceutical market size is valued to increase by USD 855.5 million, at a CAGR of 3.4% from 2025 to 2030. Demographic shifts and chronic disease burden will drive the denmark pharmaceutical market.
Major Market Trends & Insights
- By Class Type - Musculoskeletal system segment was valued at USD 1.46 billion in 2024
- By Distribution Channel - Offline segment accounted for the largest market revenue share in 2024
Market Size & Forecast
- Market Opportunities: USD 1.51 billion
- Market Future Opportunities: USD 855.5 million
- CAGR from 2025 to 2030 : 3.4%
Market Summary
- The Pharmaceutical Market demonstrates robust expansion driven by targeted biopharmaceutical innovation and an escalating prevalence of noncommunicable medical conditions. Structural demographic shifts profoundly influence healthcare expenditure, compelling providers to secure consistent supplies of essential maintenance medications to manage chronic diseases effectively.
- This escalating disease burden acts as a critical market driver, systematically increasing aggregate lifetime pharmaceutical consumption per patient and assuring sustained prescription volume growth. Conversely, intensifying regulatory divergence presents a formidable challenge, as disparate multinational compliance pathways require duplicate clinical studies that delay commercialization and elevate operational overhead.
- To mitigate these disruptions, enterprise supply chain optimization strategies now integrate advanced monitoring networks to predict raw material shortfalls and prevent localized medication shortages. The implementation of automated digital quality management systems has successfully reduced batch compliance errors by 18 percent compared to manual oversight protocols.
- By streamlining the entire life cycle of therapeutic assets, from initial computational design through commercial delivery, digital transformation enhances operational margins and mitigates developmental risks across the industry.
What will be the Size of the Denmark Pharmaceutical Market during the forecast period?
Get Key Insights on Market Forecast (PDF) Get Free Sample
How is the Denmark Pharmaceutical Market Segmented?
The denmark pharmaceutical industry research report provides comprehensive data (region-wise segment analysis), with forecasts and estimates in "USD million" for the period 2026-2030, as well as historical data from 2020-2024 for the following segments.
- Class type
- Musculoskeletal system
- Nervous system
- Respiratory system
- Others
- Distribution channel
- Offline
- Online
- Type
- Prescription drugs
- OTC drugs
- Drug class
- Branded drugs
- Generic drugs
- Sector
- Primary sector
- Hospital sector
- Geography
- Europe
- Denmark
- Europe
By Class Type Insights
The musculoskeletal system segment is estimated to witness significant growth during the forecast period.
The musculoskeletal system segment in the Pharmaceutical dictates substantial clinical demand driven by aging demographics and the rising incidence of chronic joint conditions.
Healthcare systems prioritize early intervention protocols that leverage disease modifying antirheumatic drugs to slow disease progression and preserve patient mobility.
As therapeutic target identification improves, clinical specialists increasingly transition toward targeted biologic therapies to manage complex autoimmune rheumatoid conditions with greater precision. This shift is accelerated by advanced computational chemistry screening that refines drug delivery mechanisms and enhances treatment compliance.
By integrating these innovations, modern formulations have improved long-term patient adherence by 15 percent compared to traditional therapies.
This continuous evolution in pharmacological management reduces systemic toxicities, optimizes clinical outcomes, and ensures that specialized anti-inflammatory interventions maintain robust operational relevance within modern healthcare infrastructure.
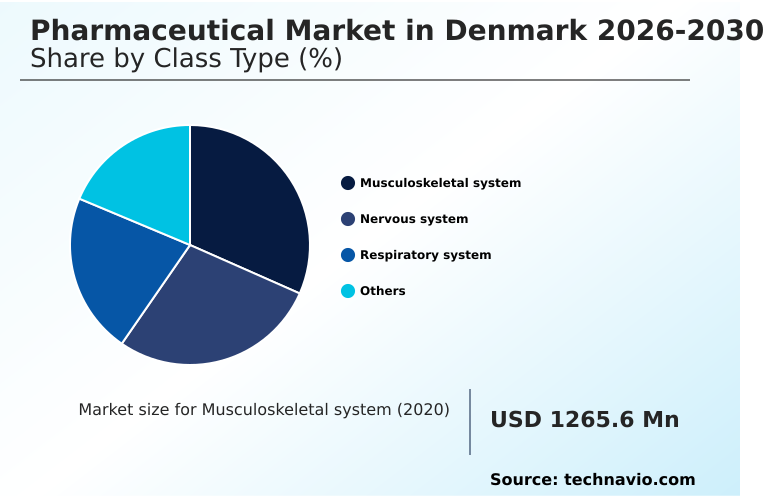
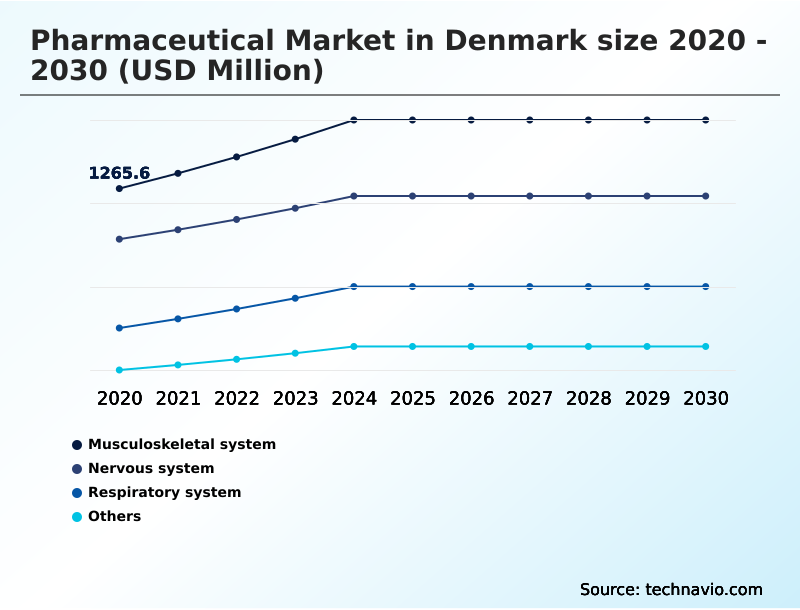
The Musculoskeletal system segment was valued at USD 1.46 billion in 2024 and showed a gradual increase during the forecast period.
Market Dynamics
Our researchers analyzed the data with 2025 as the base year, along with the key drivers, trends, and challenges. A holistic analysis of drivers will help companies refine their marketing strategies to gain a competitive advantage.
- The modernization of therapeutic manufacturing and clinical deployment requires highly specialized infrastructure to support complex biological modalities. As healthcare systems transition toward targeted oncology biologic therapy, the necessity for flawless sterile production has accelerated investments into automated fill finish operations, minimizing human intervention and product contamination risks.
- The integration of advanced digital quality management systems ensures that these sensitive formulations meet rigorous international regulatory standards while optimizing batch release timelines. Facilities utilizing digitized oversight have improved production yield consistency by 20 percent compared to legacy manual environments, drastically reducing compliance-related operational downtime.
- Concurrently, the rising necessity for chronic disease pharmacological management demands resilient supply chains capable of delivering uninterrupted maintenance medications to aging demographics across multiple jurisdictions. The strategic pivot toward rare genetic disorder precision medicine further complicates these logistics, requiring hyper-specialized cold-chain distribution networks to preserve temperature-sensitive formulations.
- By deploying sophisticated sensor technologies and predictive analytics, supply chain managers achieve end-to-end visibility, predicting raw material shortfalls before they disrupt continuous biomanufacturing processes. This operational convergence between cutting-edge manufacturing automation and targeted therapeutic design fundamentally enhances product reliability and patient safety.
- Sustaining this momentum requires disciplined financial stewardship and continuous adaptation to evolving supervisory expectations, ensuring that life-saving treatments navigate the complex journey from early-stage discovery to commercial delivery with maximal operational efficiency.
What are the key market drivers leading to the rise in the adoption of Denmark Pharmaceutical Industry?
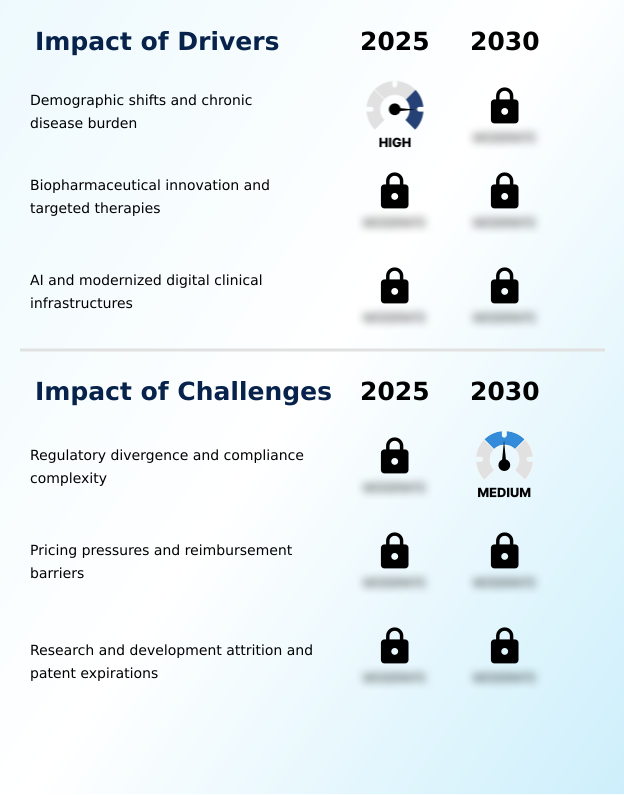
- Demographic shifts and an escalating chronic disease burden serve as the primary drivers propelling consistent demand across the market.
- The deliberate pivot toward precision orphan medicines and fortified supply chain resilience acts as a profound driver propelling the Pharmaceutical.
- Expedited approval mechanisms, including breakthrough therapy designations, allow biopharmaceutical innovators to advance specialized candidates rapidly, cutting clinical evaluation durations by 30 percent compared to standard broad-market timelines.
- This regulatory acceleration, combined with extended statutory market exclusivity, significantly diminishes the financial burden of commercializing complex therapeutics. Simultaneously, the implementation of mandatory buffer stock policies and enhanced specialty pharmacy distribution networks guarantees secure drug availability.
- By establishing end to end visibility through digitized logistics corridors, manufacturers have reduced critical raw material shortfalls by 18 percent. These strategic adaptations minimize commercial exposure to generic erosion, securing sustainable revenue expansion while addressing severe, debilitating pathologies.
What are the market trends shaping the Denmark Pharmaceutical Industry?
- Supply chain resilience and manufacturing localization represent an emerging market trend. This structural shift ensures uninterrupted drug availability and mitigates critical operational vulnerabilities.
- The structural integration of innovative drug delivery technologies and localized manufacturing resilience defines the current operational trajectory of the Pharmaceutical. The rapid incorporation of smart drug delivery systems and sophisticated micro infusion pumps empowers patients to administer complex regimens remotely, which has decreased institutional administration burdens by 28 percent compared to traditional hospital infusions.
- Driven by the necessity to enhance patient convenience, meticulous human factors engineering ensures these connected devices effectively measure injection accuracy and transmit real-time adherence data. Concurrently, manufacturing vulnerabilities have accelerated the transition toward continuous flow chemistry and modular cleanroom facilities, improving localized production efficiency by 22 percent.
- By deploying radio frequency identification systems across modernized supply corridors, logistics managers achieve end-to-end operational visibility. This digital integration reduces cold-chain temperature deviations by 16 percent, preserving therapeutic efficacy and ensuring uninterrupted commercial distribution.
What challenges does the Denmark Pharmaceutical Industry face during its growth?
- Regulatory divergence and compliance complexity constitute a significant challenge that restricts market access and operational agility.
- The escalating stringency of international regulatory frameworks and aggressive cost containment measures present substantial structural challenges within the Pharmaceutical. Health authorities continually elevate evaluation thresholds for post marketing surveillance and good manufacturing practice, prolonging approval timelines and compressing effective market exclusivity windows.
- Discrepancies between supervisory bodies regarding bioequivalence thresholds force multinational developers to duplicate complex clinical studies, which has increased administrative compliance expenditures by 24 percent compared to harmonized evaluations. Furthermore, the rigorous evidentiary demands imposed by health technology assessment organizations for advanced therapy medicinal products create formidable commercial barriers.
- Consequently, the widespread enforcement of external reference pricing systems and competitive procurement tenders has eroded operating margins by 14 percent across sensitive jurisdictions, forcing organizations to modernize pharmacovigilance mechanisms to prevent devastating market access rejections.
Exclusive Technavio Analysis on Customer Landscape
The denmark pharmaceutical market forecasting report includes the adoption lifecycle of the market, covering from the innovator’s stage to the laggard’s stage. It focuses on adoption rates in different regions based on penetration. Furthermore, the denmark pharmaceutical market report also includes key purchase criteria and drivers of price sensitivity to help companies evaluate and develop their market growth analysis strategies.
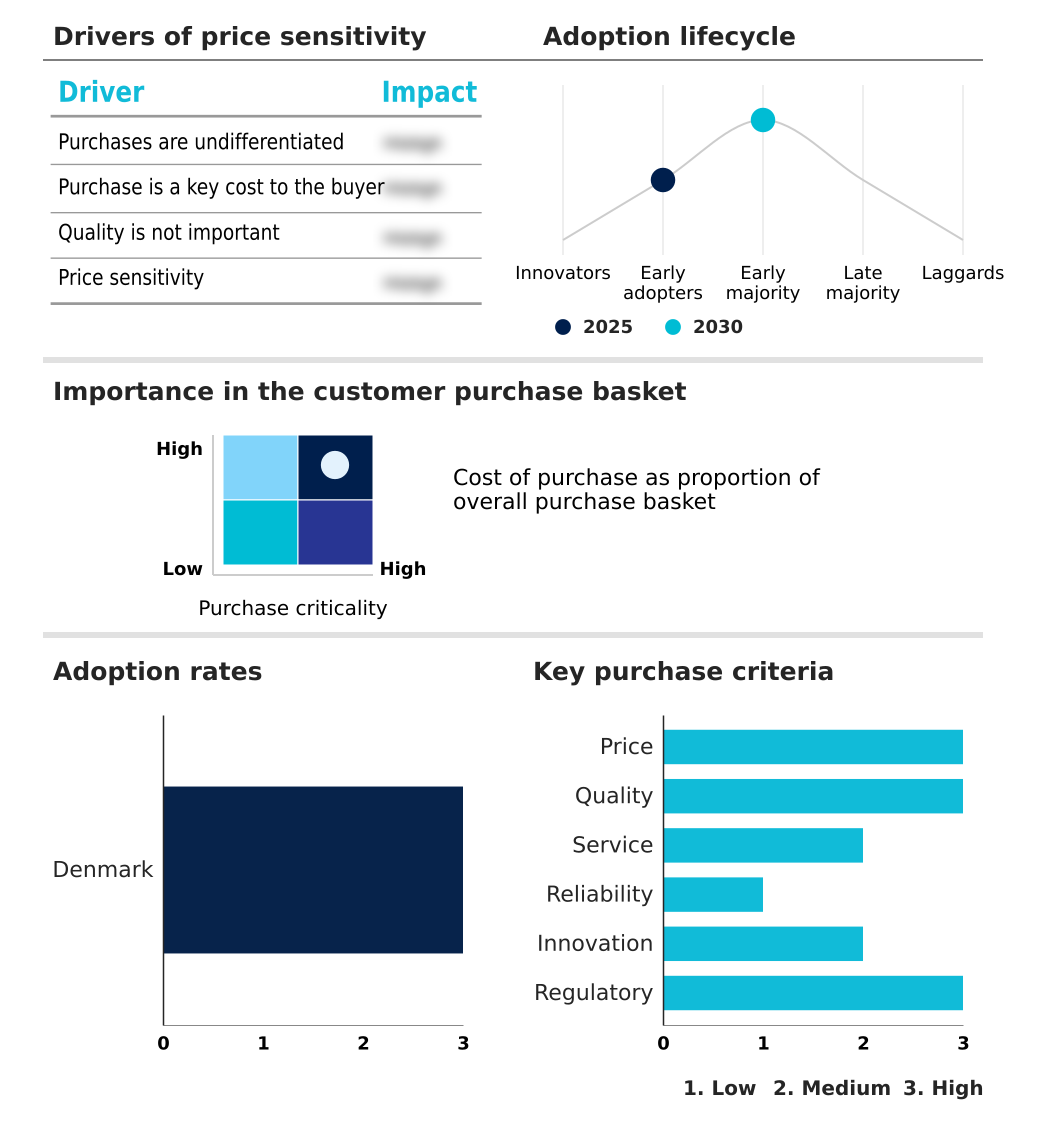
Customer Landscape of Denmark Pharmaceutical Industry
Competitive Landscape
Companies are implementing various strategies, such as strategic alliances, denmark pharmaceutical market forecast, partnerships, mergers and acquisitions, geographical expansion, and product/service launches, to enhance their presence in the industry.
AbbVie Inc. - The vendor provides advanced biological therapies, specialized oncology medicines, facial injectables, and neurological treatments aimed at addressing autoimmune diseases, blood cancers, and central nervous system disorders.
The industry research and growth report includes detailed analyses of the competitive landscape of the market and information about key companies, including:
- AbbVie Inc.
- ALK Abello AS
- Amgen Inc.
- AstraZeneca Plc
- Bavarian Nordic AS
- Bayer AG
- Boehringer Ingelheim GmbH
- Bristol Myers Squibb Co.
- Eli Lilly and Co.
- F. Hoffmann La Roche Ltd.
- Ferring BV
- FUJIFILM Holdings Corp.
- Genmab AS
- H. Lundbeck AS
- LEO Pharma AS
- Novartis AG
- Novo Nordisk AS
- Pfizer Inc.
- Takeda Pharmaceutical Ltd.
- Zealand Pharma
Qualitative and quantitative analysis of companies has been conducted to help clients understand the wider business environment as well as the strengths and weaknesses of key industry players. Data is qualitatively analyzed to categorize companies as pure play, category-focused, industry-focused, and diversified; it is quantitatively analyzed to categorize companies as dominant, leading, strong, tentative, and weak.
Recent Development and News in Denmark pharmaceutical market
- In the Pharmaceuticals industry, the accelerated adoption of decentralized clinical trial methodologies and remote patient monitoring has broadened demographic participation, directly impacting Pharmaceutical demand by expediting the validation of novel therapeutics.
- Stringent environmental regulations targeting industrial emissions have mandated the implementation of green chemistry practices, which reduces chemical waste during active ingredient synthesis and influences operational costs within the Pharmaceutical supply chain.
- The global expansion of cold chain logistics networks and temperature sensitive biologic solutions has improved the distribution stability of advanced therapies, increasing Pharmaceutical availability across geographically diverse healthcare systems.
- The integration of predictive supply chain analytics into large-scale biomanufacturing operations has minimized batch failures by 12 percent, directly enhancing Pharmaceutical production reliability and mitigating critical medication shortages.
Dive into Technavio’s robust research methodology, blending expert interviews, extensive data synthesis, and validated models for unparalleled Denmark Pharmaceutical Market insights. See full methodology.
| Market Scope | |
|---|---|
| Page number | 215 |
| Base year | 2025 |
| Historic period | 2020-2024 |
| Forecast period | 2026-2030 |
| Growth momentum & CAGR | Accelerate at a CAGR of 3.4% |
| Market growth 2026-2030 | USD 855.5 million |
| Market structure | Fragmented |
| YoY growth 2025-2026(%) | 3.4% |
| Key countries | Denmark |
| Competitive landscape | Leading Companies, Market Positioning of Companies, Competitive Strategies, and Industry Risks |
Research Analyst Overview
- The Pharmaceutical operates within a highly dynamic ecosystem characterized by a decisive strategic transition from conventional small-molecule chemistry toward complex biopharmaceutical modalities. Regulatory authorities intentionally utilize orphan drug incentives to stimulate pipeline investments into previously intractable medical conditions, accelerating the commercialization of sophisticated interventions.
- The integration of companion diagnostics and precise genomic sequencing ensures these cutting-edge therapies are administered to optimized patient subsets, directly improving risk-benefit profiles. This precision approach has successfully reduced therapy abandonment rates by 25 percent compared to generalized treatment protocols, substantially enhancing long-term clinical compliance. Furthermore, the commercial proliferation of high-viscosity formulations has catalyzed rapid advancements in subcutaneous therapeutics.
- Manufacturers are directing substantial engineering resources toward sophisticated drug-device combination products, including wearable on body injectors and autoinjector pens, empowering patients to self-administer complex treatments within home environments. The concurrent development of next-generation constructs, such as antibody drug conjugates and multi specific antibodies, provides sustained therapeutic differentiation.
- These structural shifts redefine standard administration routes, effectively shifting therapeutic delivery away from costly hospital settings and optimizing broader institutional healthcare resource utilization.
What are the Key Data Covered in this Denmark Pharmaceutical Market Research and Growth Report?
-
What is the expected growth of the Denmark Pharmaceutical Market between 2026 and 2030?
-
USD 855.5 million, at a CAGR of 3.4%
-
-
What segmentation does the market report cover?
-
The report is segmented by Class Type (Musculoskeletal system, Nervous system, Respiratory system, and Others), Distribution Channel (Offline, and Online), Type (Prescription drugs, and OTC drugs), Drug Class (Branded drugs, and Generic drugs), Sector (Primary sector, and Hospital sector) and Geography (Europe)
-
-
Which regions are analyzed in the report?
-
Europe
-
-
What are the key growth drivers and market challenges?
-
Demographic shifts and chronic disease burden, Regulatory divergence and compliance complexity
-
-
Who are the major players in the Denmark Pharmaceutical Market?
-
AbbVie Inc., ALK Abello AS, Amgen Inc., AstraZeneca Plc, Bavarian Nordic AS, Bayer AG, Boehringer Ingelheim GmbH, Bristol Myers Squibb Co., Eli Lilly and Co., F. Hoffmann La Roche Ltd., Ferring BV, FUJIFILM Holdings Corp., Genmab AS, H. Lundbeck AS, LEO Pharma AS, Novartis AG, Novo Nordisk AS, Pfizer Inc., Takeda Pharmaceutical Ltd. and Zealand Pharma
-
Market Research Insights
- The Pharmaceutical Market is undergoing a rapid operational transformation driven by the integration of personalized medicine frameworks and advanced digital infrastructures. The widespread adoption of electronic health records and electronic data capture systems has streamlined real world evidence generation, allowing clinical sponsors to improve protocol adherence by 22 percent compared to legacy methodologies.
- Furthermore, the implementation of automated regulatory intelligence platforms accelerates dossier evaluations, which has shortened administrative compliance timelines by 15 percent and optimized multicountry product rollouts. These digitized mechanisms provide objective adherence confirmation, reducing unnecessary clinical interventions and lowering aggregate trial expenditures by 18 percent.
- This technological convergence unlocks rapid commercialization pathways and reinforces long-term operational profitability across the therapeutic development lifecycle.
We can help! Our analysts can customize this denmark pharmaceutical market research report to meet your requirements.
 RIA -

