Pharmaceutical Packaging Market Analysis, Size, and Forecast 2026-2030: North America (US, Canada, and Mexico), Europe (Germany, France, and UK), APAC (China, India, and Japan), Middle East and Africa (Saudi Arabia, Turkey, and South Africa), South America (Brazil, Argentina, and Chile), and Rest of World (ROW)

Pharmaceutical Packaging Market Analysis, Size, and Forecast 2026-2030:
North America (US, Canada, and Mexico), Europe (Germany, France, and UK), APAC (China, India, and Japan), Middle East and Africa (Saudi Arabia, Turkey, and South Africa), South America (Brazil, Argentina, and Chile), and Rest of World (ROW)

Published: May 2026 322 Pages SKU: IRTNTR45279

Market Overview at a Glance

$91.61 B
Market Opportunity
10.3%
CAGR 2025 - 2030
32.3%
Europe Growth
$39.66 B
Rigid plastic segment 2024

Pharmaceutical Packaging Market Size 2026-2030

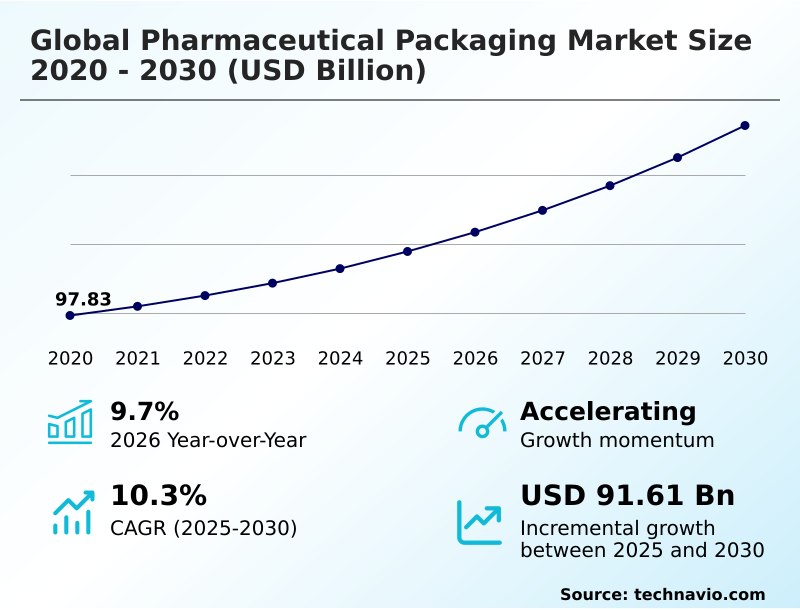
The pharmaceutical packaging market size is valued to increase by USD 91.61 billion, at a CAGR of 10.3% from 2025 to 2030. Rapid global expansion of complex biologics and injectable therapeutics will drive the pharmaceutical packaging market.

Major Market Trends & Insights

  • Europe dominated the market and accounted for a 32.3% growth during the forecast period.
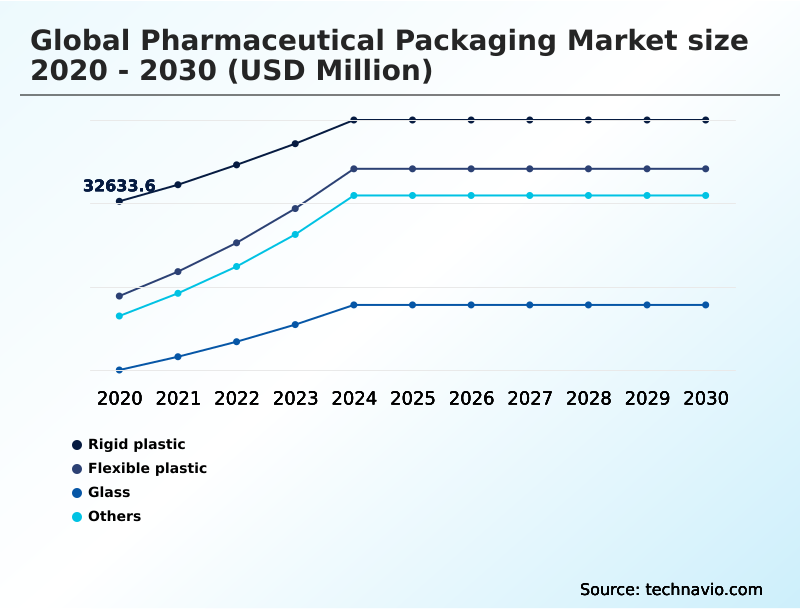
  • By Material - Rigid plastic segment was valued at USD 39.66 billion in 2024
  • By Product - Plastic bottles segment accounted for the largest market revenue share in 2024

Market Size & Forecast

  • Market Opportunities: USD 138.16 billion
  • Market Future Opportunities: USD 91.61 billion
  • CAGR from 2025 to 2030 : 10.3%

Market Summary

  • The Pharmaceutical Packaging exhibits profound structural intensification, propelled by the escalating complexity of advanced therapeutic formulations and strict regulatory compliance mandates. As modern drug development heavily prioritizes biologically sensitive large-molecule therapies, the necessity for premium parenteral containment systems has surged dramatically.
  • This shift drives specialized contract manufacturing organizations to optimize supply chain resilience by integrating automated high-speed filling lines, which reduces operational processing time by 18% compared to legacy manual workflows. The expansion of complex biologics acts as a primary market driver, compelling packaging providers to engineer sophisticated prefillable delivery mechanisms that eliminate clinical reconstitution errors.
  • Conversely, navigating the friction between absolute sterility requirements and zero-waste environmental objectives presents a severe operational challenge. Manufacturers face immense difficulty executing comprehensive extractables and leachables profiling when transitioning to recycled polymers, often delaying commercialization timelines. The continuous adoption of automated decentralized hospital dispensing further dictates strict adherence to standardized unit-dose formats, ensuring secure medication administration.

What will be the Size of the Pharmaceutical Packaging Market during the forecast period?

Get Key Insights on Market Forecast (PDF) Get Free Sample

How is the Pharmaceutical Packaging Market Segmented?

The pharmaceutical packaging industry research report provides comprehensive data (region-wise segment analysis), with forecasts and estimates in "USD million" for the period 2026-2030, as well as historical data from 2020-2024 for the following segments.

  • Material
    • Rigid plastic
    • Flexible plastic
    • Glass
    • Others
  • Product
    • Plastic bottles
    • Caps and closures
    • Blister packs
    • Pre-fillable syringes
    • Others
  • Route of administration
    • Oral drugs
    • Injectables
    • Topical
    • Nasal
    • Others
  • Geography
    • North America
      • US
      • Canada
      • Mexico
    • Europe
      • Germany
      • France
      • UK
      • Italy
      • Spain
      • Switzerland
    • APAC
      • China
      • India
      • Japan
      • South Korea
      • Australia
      • Indonesia
    • Middle East and Africa
      • Saudi Arabia
      • Turkey
      • South Africa
      • UAE
      • Egypt
    • South America
      • Brazil
      • Argentina
      • Chile

By Material Insights

The rigid plastic segment is estimated to witness significant growth during the forecast period.

The rigid plastic segment within the Pharmaceutical Packaging framework serves as a foundational component for securing solid oral dosages and diagnostic materials.

Utilizing advanced cyclic olefin polymers and high-density polyethylene resins, manufacturers engineer highly durable tablet bottles and integrated device components. This structural integrity guarantees absolute primary containment protection against ambient moisture and physical impacts during transit.

As the industry transitions toward high-speed automated filling lines, rigid containers demonstrate exceptional dimensional uniformity, reducing production downtime by 15% compared to flexible alternatives.

Incorporating active oxygen scavengers directly into the plastic matrix extends shelf life and ensures biologic drug stability. Furthermore, precision-engineered child-resistant closures enhance patient safety while optimizing active pharmaceutical ingredient preservation.

This material transition allows pharmaceutical operators to achieve a 20% improvement in supply chain efficiency through reduced product loss and enhanced structural resilience.

Get Free Sample

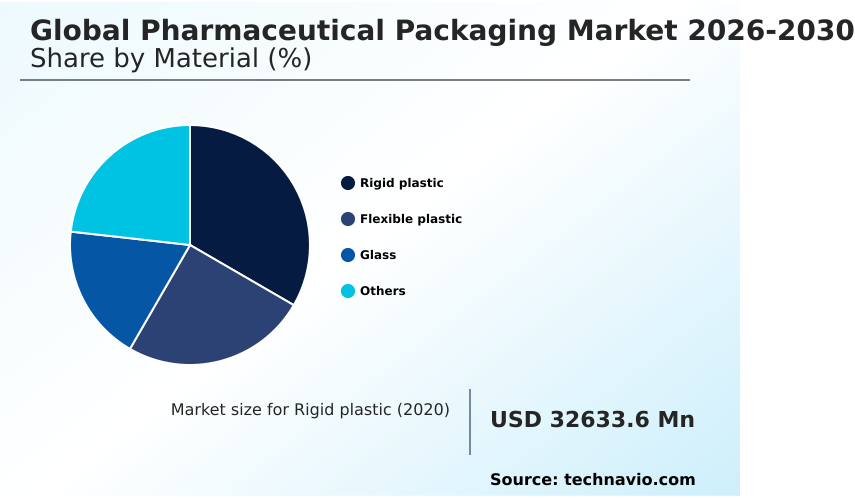
The Rigid plastic segment was valued at USD 39.66 billion in 2024 and showed a gradual increase during the forecast period.

Get Free Sample

Regional Analysis

Europe is estimated to contribute 32.3% to the growth of the global market during the forecast period.Technavio’s analysts have elaborately explained the regional trends and drivers that shape the market during the forecast period.

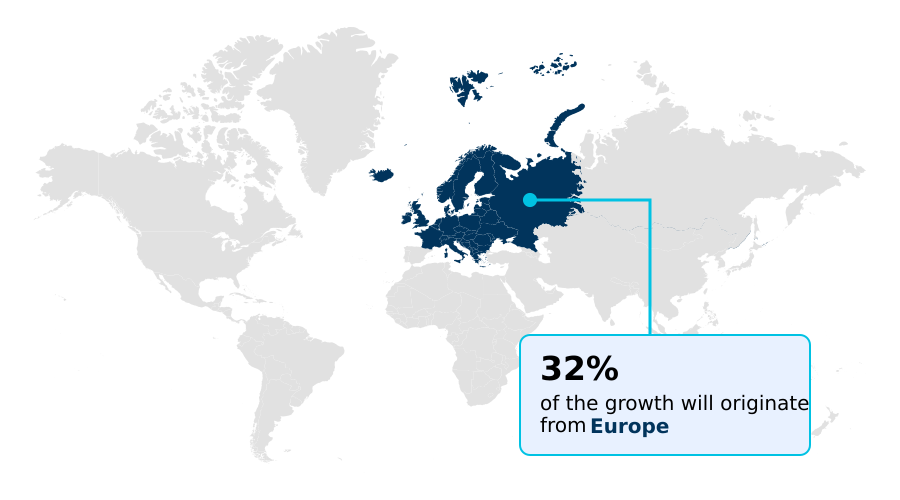
See How Pharmaceutical Packaging Market Demand is Rising in Europe Get Free Sample

Regional dynamics within the Pharmaceutical Packaging sector reveal sharp contrasts in regulatory maturity and supply chain execution between North America and APAC.

North America maintains strict serialization mandates, driving a 35% higher adoption rate of smart connected secondary cartons compared to developing Asian markets. This advanced infrastructure actively supports patient medication adherence and precise pharmaceutical compounding integration.

In contrast, APAC functions as the dominant manufacturing hub for generic oral solids, yet it is rapidly upgrading its capabilities to process advanced therapy medicinal products.

Facilities in Europe demonstrate superior operational efficiency, achieving a 20% reduction in packaging waste through early compliance with circular economy directives.

The demand for ultra-pure borosilicate glass vials and inert fluoropolymer coatings remains concentrated in Western markets, where stringent biological stability testing dictates primary container selection.

These distinct geographical priorities compel packaging manufacturers to customize localized facility investments, thereby optimizing distribution resilience and mitigating material shortage risks.

Market Dynamics

Our researchers analyzed the data with 2025 as the base year, along with the key drivers, trends, and challenges. A holistic analysis of drivers will help companies refine their marketing strategies to gain a competitive advantage.

  • The ongoing structural transformation of the Pharmaceutical Packaging landscape heavily emphasizes absolute product integrity and operational optimization across highly regulated supply networks. As pharmaceutical laboratories shift their pipelines toward complex biologics and targeted therapies, the demand for highly specialized containment solutions has fundamentally altered procurement strategies.
  • Companies are heavily investing in sterile injectable delivery systems that prevent chemical degradation and ensure safe subcutaneous administration. Simultaneously, legislative pressure to adopt sustainable practices has triggered a massive transition toward eco-friendly mono-material blister packaging, which allows manufacturers to achieve up to a 25% improvement in post-consumer recycling efficiency compared to legacy multi-layer PVC structures.
  • This sustainability push is complemented by the integration of high-barrier active gas-scavenging polymers that continuously trap residual oxygen, dramatically extending the shelf life of highly sensitive therapeutic compounds. To maintain compliance with international traceability mandates, operators are deploying smart connected pharmaceutical secondary cartons equipped with digital identification markers.
  • This technological upgrade secures the physical supply chain and facilitates direct communication regarding dosage instructions. Furthermore, managing the quality control of these complex formats requires flawless execution, leading facilities to implement automated machine vision inspection lines capable of detecting microscopic cosmetic anomalies at extreme line speeds.
  • This comprehensive alignment of advanced materials, digital connectivity, and precision engineering guarantees that pharmaceutical packagers can securely deliver life-saving medications while adapting to evolving environmental and commercial requirements.

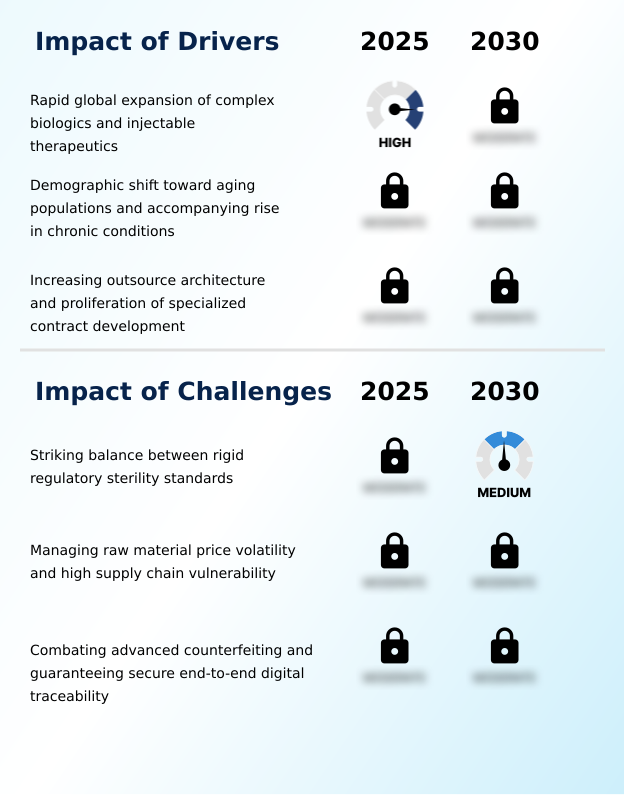
What are the key market drivers leading to the rise in the adoption of Pharmaceutical Packaging Industry?

  • The rapid expansion of complex biologics and advanced injectable therapeutics serves as a primary driver, compelling the development of highly engineered containment systems to prevent chemical degradation.

  • The unprecedented expansion of complex biologic pipelines and self-administered therapeutics functions as a formidable driver propelling Pharmaceutical Packaging innovations. This structural shift forces manufacturers to secure advanced cyclic olefin copolymers to prevent harmful chemical interactions with volatile liquid formulations.
  • The immense demand for prolonged shelf-life stability accelerates the utilization of high-performance polyvinylidene chloride barrier films, optimizing the hermetic seal integrity of sensitive solid oral dosages.
  • Consequently, operators upgrading to continuous automated blow-molding systems have improved overall production efficiency by 22% while simultaneously lowering energy consumption by 12%. The ongoing transition toward patient-centric unit-dose blister cards ensures exact dosage delivery and minimizes contamination risks.
  • This relentless pursuit of absolute biochemical containment directly empowers healthcare providers to safely distribute highly reactive medications globally.

What are the market trends shaping the Pharmaceutical Packaging Industry?

  • The accelerated deployment of intelligent connected smart packaging solutions represents a defining trend reshaping modern healthcare distribution. This technological integration transforms passive containers into active digital nodes to enhance patient engagement and supply chain security.

  • The integration of digital connectivity and deep-learning visual analytics represents a transformative trend fundamentally altering Pharmaceutical Packaging architecture. As international health authorities mandate comprehensive traceability, packaging facilities are systematically embedding serialization data matrix codes and radio frequency identification tags directly into secondary cartons.
  • This data-driven evolution enhances supply chain transparency, improving inventory reconciliation accuracy by 18% over traditional manual barcode scanning. Concurrently, the accelerated commercialization of advanced gene therapies necessitates the deployment of highly specialized cryogenic storage vials capable of maintaining structural integrity at extreme sub-zero temperatures.
  • To support these complex biological products, manufacturers are automating sterile fill-finish operations, which has successfully reduced microscopic container defect rates by 25%. Additionally, innovations in transdermal delivery matrices are optimizing patient comfort and controlled drug release, demonstrating how targeted material engineering directly elevates therapeutic delivery and clinical adherence.

What challenges does the Pharmaceutical Packaging Industry face during its growth?

  • Striking a viable balance between rigid regulatory sterility standards and increasing legislative pressure for environmental sustainability remains a formidable challenge constraining rapid material innovation.

  • Balancing rigid biological sterility mandates with intensifying environmental legislation constitutes a severe operational challenge disrupting standard Pharmaceutical Packaging workflows. Transitioning away from legacy composite plastics toward highly recyclable mono-material blister configurations introduces immense technical friction, often increasing material validation times by 30% due to comprehensive regulatory stability testing requirements. Furthermore, extreme pricing volatility for specialized polymers directly compresses operational margins.
  • Manufacturers face substantial difficulties integrating active oxygen scavengers into recycled resin matrices without compromising drug purity. The critical necessity to secure biopharmaceutical cold-chain shippers with precise tamper-evident tear bands and ultra-pure elastomeric vial stoppers adds significant manufacturing complexity.
  • Resolving these conflicting priorities frequently elevates baseline production costs by 15%, forcing packaging converters to heavily subsidize advanced material research to prevent widespread commercialization delays.

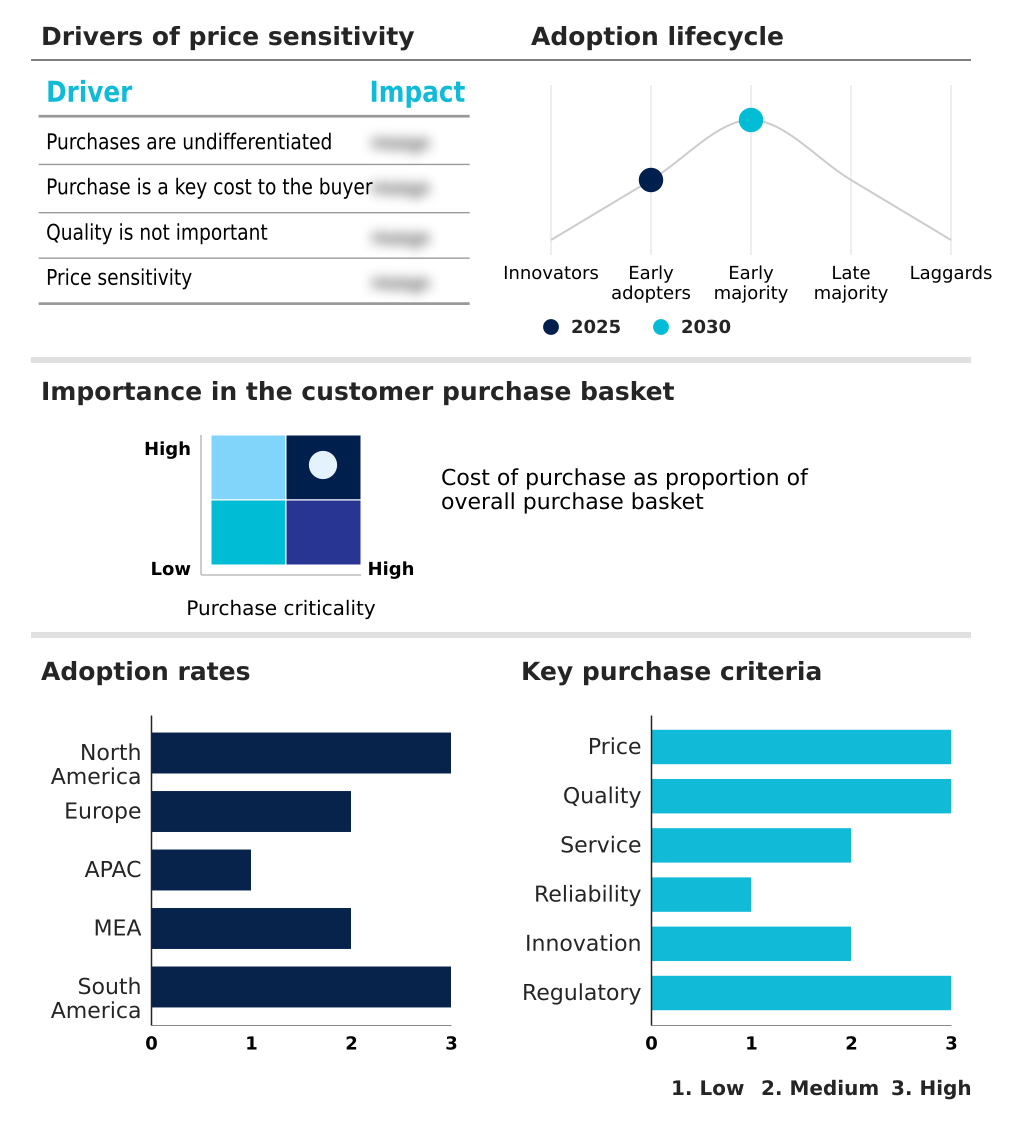
Exclusive Technavio Analysis on Customer Landscape

The pharmaceutical packaging market forecasting report includes the adoption lifecycle of the market, covering from the innovator’s stage to the laggard’s stage. It focuses on adoption rates in different regions based on penetration. Furthermore, the pharmaceutical packaging market report also includes key purchase criteria and drivers of price sensitivity to help companies evaluate and develop their market growth analysis strategies.

Customer Landscape of Pharmaceutical Packaging Industry

Competitive Landscape

Companies are implementing various strategies, such as strategic alliances, pharmaceutical packaging market forecast, partnerships, mergers and acquisitions, geographical expansion, and product/service launches, to enhance their presence in the industry.

ACG Group - Delivers specialized pharmaceutical packaging solutions, including high-barrier blister configurations, flexible sachets, pouches, and sterile medical containment systems designed to ensure drug stability and regulatory compliance.

The industry research and growth report includes detailed analyses of the competitive landscape of the market and information about key companies, including:

  • ACG Group
  • Amcor Plc
  • AptarGroup Inc.
  • Becton Dickinson and Co.
  • Catalent Inc.
  • Datwyler Holding Inc.
  • Dow Chemical Co.
  • Drug Plastics Group
  • DS Smith Plc
  • DuPont de Nemours Inc.
  • Gerresheimer AG
  • International Paper Co.
  • Jabil Inc.
  • KP Holding GmbH and Co. KG
  • Perlen Packaging AG
  • Smurfit Westrock plc
  • Sonoco Products Co.
  • Stevanato Group S.p.A
  • Vitro SAB De CV
  • West Pharma Services Inc.

Qualitative and quantitative analysis of companies has been conducted to help clients understand the wider business environment as well as the strengths and weaknesses of key industry players. Data is qualitatively analyzed to categorize companies as pure play, category-focused, industry-focused, and diversified; it is quantitatively analyzed to categorize companies as dominant, leading, strong, tentative, and weak.

Recent Development and News in Pharmaceutical packaging market

  • In the Metal, Glass and Plastic Containers industry, the accelerated implementation of the European Packaging and Packaging Waste Regulation has mandated a strict circular economy material transition, directly impacting Pharmaceutical Packaging demand by forcing a 40% substitution of multi-layer laminates with recyclable mono-materials to ensure regulatory stability testing compliance while supporting single-use plastic reduction.
  • The integration of advanced deep-learning vision systems in primary glass manufacturing has elevated zero-defect manufacturing inspection capabilities, directly impacting Pharmaceutical Packaging by reducing structural anomalies by 25% and enhancing glass delamination prevention for highly sensitive sterile barrier systems.
  • The widespread adoption of blockchain-backed serialization protocols across major polymer conversion facilities has established new standards for unit-level electronic traceability, directly impacting Pharmaceutical Packaging demand by requiring the integration of anti-counterfeiting digital watermarks to maintain strict global track-and-trace compliance.
  • The deployment of vacuum-insulated panel technology in container logistics has optimized the biopharmaceutical supply chain, directly impacting Pharmaceutical Packaging by improving thermal retention during temperature-controlled transit by 30% and enabling seamless continuous real-time monitoring for high-value injectable therapeutics.

Dive into Technavio’s robust research methodology, blending expert interviews, extensive data synthesis, and validated models for unparalleled Pharmaceutical Packaging Market insights. See full methodology.

Market Scope
Page number 322
Base year 2025
Historic period 2020-2024
Forecast period 2026-2030
Growth momentum & CAGR Accelerate at a CAGR of 10.3%
Market growth 2026-2030 USD 91611.6 million
Market structure Fragmented
YoY growth 2025-2026(%) 9.7%
Key countries US, Canada, Mexico, Germany, France, UK, Italy, Spain, Switzerland, China, India, Japan, South Korea, Australia, Indonesia, Saudi Arabia, Turkey, South Africa, UAE, Egypt, Brazil, Argentina and Chile
Competitive landscape Leading Companies, Market Positioning of Companies, Competitive Strategies, and Industry Risks

Request Free Sample

Research Analyst Overview

  • The Pharmaceutical Packaging environment requires unparalleled precision, compelling corporate leadership to align containment strategies directly with stringent therapeutic risk profiles. The industry is experiencing a massive pivot toward biologic drug administration, which fundamentally reshapes procurement and product safety parameters.
  • To address the acute sensitivity of large-molecule formulations, operators utilize pre-sterilized ready-to-use nested syringes, effectively streamlining aseptic fill-finish operations and minimizing cross-contamination risks. This specific architectural upgrade enables filling facilities to achieve a 30% reduction in processing time by eliminating intermediate washing and depyrogenation steps.
  • Maintaining absolute hermetic seal integrity remains critical for solid oral medications, driving the rapid adoption of advanced unit-dose blister cards optimized for low moisture vapor transmission rate profiles. Packaging engineers continuously leverage multi-layer co-injection techniques to embed active moisture barriers seamlessly into primary structures. Furthermore, the strategic deployment of automated blow-molding equipment ensures high-dimensional uniformity across massive production batches.
  • These operational investments secure critical biological stability while allowing pharmaceutical developers to confidently scale up their manufacturing output across highly regulated international distribution networks.

What are the Key Data Covered in this Pharmaceutical Packaging Market Research and Growth Report?

  • What is the expected growth of the Pharmaceutical Packaging Market between 2026 and 2030?

    • USD 91.61 billion, at a CAGR of 10.3%

  • What segmentation does the market report cover?

    • The report is segmented by Material (Rigid plastic, Flexible plastic, Glass, and Others), Product (Plastic bottles, Caps and closures, Blister packs, Pre-fillable syringes, and Others), Route of Administration (Oral drugs, Injectables, Topical, Nasal, and Others) and Geography (North America, Europe, APAC, Middle East and Africa, South America)

  • Which regions are analyzed in the report?

    • North America, Europe, APAC, Middle East and Africa and South America

  • What are the key growth drivers and market challenges?

    • Rapid global expansion of complex biologics and injectable therapeutics, Striking balance between rigid regulatory sterility standards

  • Who are the major players in the Pharmaceutical Packaging Market?

    • ACG Group, Amcor Plc, AptarGroup Inc., Becton Dickinson and Co., Catalent Inc., Datwyler Holding Inc., Dow Chemical Co., Drug Plastics Group, DS Smith Plc, DuPont de Nemours Inc., Gerresheimer AG, International Paper Co., Jabil Inc., KP Holding GmbH and Co. KG, Perlen Packaging AG, Smurfit Westrock plc, Sonoco Products Co., Stevanato Group S.p.A, Vitro SAB De CV and West Pharma Services Inc.

Market Research Insights

  • The Pharmaceutical Packaging framework operates as a critical defense mechanism, ensuring therapeutic efficacy and supply chain transparency. Modern facilities prioritize advanced material science to maintain track-and-trace compliance and safeguard sensitive biologics against external degradation. By optimizing thermal barriers for temperature-controlled transit, manufacturers have improved cold-chain delivery reliability by 22%, significantly reducing the spoilage of high-value vaccines.
  • Furthermore, the integration of standardized unit-dose formats supports automated decentralized hospital dispensing, accelerating clinical administration speeds by 15% compared to bulk dispensing methods. Adhering to rigorous regulatory stability testing allows specialized converters to deploy robust primary containers, lowering the incidence of chemical leaching and ensuring that critical drug formulations remain entirely uncompromised throughout extended logistical lifecycles.

We can help! Our analysts can customize this pharmaceutical packaging market research report to meet your requirements.

Get in touch

1. Executive Summary

1.1 Market overview

Executive Summary - Chart on Market Overview
Executive Summary - Data Table on Market Overview
Executive Summary - Chart on Global Market Characteristics
Executive Summary - Chart on Market by Geography
Executive Summary - Chart on Market Segmentation by Material
Executive Summary - Chart on Market Segmentation by Product
Executive Summary - Chart on Market Segmentation by Route of Administration
Executive Summary - Chart on Incremental Growth
Executive Summary - Data Table on Incremental Growth
Executive Summary - Chart on Company Market Positioning

2. Technavio Analysis

2.1 Analysis of price sensitivity, lifecycle, customer purchase basket, adoption rates, and purchase criteria

2.2 Criticality of inputs and Factors of differentiation

Chart on Overview on criticality of inputs and factors of differentiation

2.3 Factors of disruption

Chart on Overview on factors of disruption

2.4 Impact of drivers and challenges

Chart on Impact of drivers and challenges in 2025 and 2030

3. Market Landscape

3.1 Market ecosystem

Chart on Parent Market
Data Table on - Parent Market

3.2 Market characteristics

Chart on Market characteristics analysis

3.3 Value chain analysis

Chart on Value chain analysis

4. Market Sizing

4.1 Market definition

Data Table on Offerings of companies included in the market definition

4.2 Market segment analysis

Market segments

4.3 Market size 2025

4.4 Market outlook: Forecast for 2025-2030

Chart on Global - Market size and forecast 2025-2030 ($ million)
Data Table on Global - Market size and forecast 2025-2030 ($ million)
Chart on Global Market: Year-over-year growth 2025-2030 (%)
Data Table on Global Market: Year-over-year growth 2025-2030 (%)

5. Historic Market Size

5.1 Global Pharmaceutical Packaging Market 2020 - 2024

Historic Market Size - Data Table on Global Pharmaceutical Packaging Market 2020 - 2024 ($ million)

5.2 Material segment analysis 2020 - 2024

Historic Market Size - Material Segment 2020 - 2024 ($ million)

5.3 Product segment analysis 2020 - 2024

Historic Market Size - Product Segment 2020 - 2024 ($ million)

5.4 Route of Administration segment analysis 2020 - 2024

Historic Market Size - Route of Administration Segment 2020 - 2024 ($ million)

5.5 Geography segment analysis 2020 - 2024

Historic Market Size - Geography Segment 2020 - 2024 ($ million)

5.6 Country segment analysis 2020 - 2024

Historic Market Size - Country Segment 2020 - 2024 ($ million)

6. Qualitative Analysis

6.1 Impact of AI on global pharmaceutical packaging market

6.2 Impact of geopolitical conflicts on global pharmaceutical packaging market

7. Five Forces Analysis

7.1 Five forces summary

Five forces analysis - Comparison between 2025 and 2030

7.2 Bargaining power of buyers

Bargaining power of buyers - Impact of key factors 2025 and 2030

7.3 Bargaining power of suppliers

Bargaining power of suppliers - Impact of key factors in 2025 and 2030

7.4 Threat of new entrants

Threat of new entrants - Impact of key factors in 2025 and 2030

7.5 Threat of substitutes

Threat of substitutes - Impact of key factors in 2025 and 2030

7.6 Threat of rivalry

Threat of rivalry - Impact of key factors in 2025 and 2030

7.7 Market condition

Chart on Market condition - Five forces 2025 and 2030

8. Market Segmentation by Material

8.1 Market segments

Chart on Material - Market share 2025-2030 (%)
Data Table on Material - Market share 2025-2030 (%)

8.2 Comparison by Material

Chart on Comparison by Material
Data Table on Comparison by Material

8.3 Rigid plastic - Market size and forecast 2025-2030

Chart on Rigid plastic - Market size and forecast 2025-2030 ($ million)
Data Table on Rigid plastic - Market size and forecast 2025-2030 ($ million)
Chart on Rigid plastic - Year-over-year growth 2025-2030 (%)
Data Table on Rigid plastic - Year-over-year growth 2025-2030 (%)

8.4 Flexible plastic - Market size and forecast 2025-2030

Chart on Flexible plastic - Market size and forecast 2025-2030 ($ million)
Data Table on Flexible plastic - Market size and forecast 2025-2030 ($ million)
Chart on Flexible plastic - Year-over-year growth 2025-2030 (%)
Data Table on Flexible plastic - Year-over-year growth 2025-2030 (%)

8.5 Glass - Market size and forecast 2025-2030

Chart on Glass - Market size and forecast 2025-2030 ($ million)
Data Table on Glass - Market size and forecast 2025-2030 ($ million)
Chart on Glass - Year-over-year growth 2025-2030 (%)
Data Table on Glass - Year-over-year growth 2025-2030 (%)

8.6 Others - Market size and forecast 2025-2030

Chart on Others - Market size and forecast 2025-2030 ($ million)
Data Table on Others - Market size and forecast 2025-2030 ($ million)
Chart on Others - Year-over-year growth 2025-2030 (%)
Data Table on Others - Year-over-year growth 2025-2030 (%)

8.7 Market opportunity by Material

Market opportunity by Material ($ million)
Data Table on Market opportunity by Material ($ million)

9. Market Segmentation by Product

9.1 Market segments

Chart on Product - Market share 2025-2030 (%)
Data Table on Product - Market share 2025-2030 (%)

9.2 Comparison by Product

Chart on Comparison by Product
Data Table on Comparison by Product

9.3 Plastic bottles - Market size and forecast 2025-2030

Chart on Plastic bottles - Market size and forecast 2025-2030 ($ million)
Data Table on Plastic bottles - Market size and forecast 2025-2030 ($ million)
Chart on Plastic bottles - Year-over-year growth 2025-2030 (%)
Data Table on Plastic bottles - Year-over-year growth 2025-2030 (%)

9.4 Caps and closures - Market size and forecast 2025-2030

Chart on Caps and closures - Market size and forecast 2025-2030 ($ million)
Data Table on Caps and closures - Market size and forecast 2025-2030 ($ million)
Chart on Caps and closures - Year-over-year growth 2025-2030 (%)
Data Table on Caps and closures - Year-over-year growth 2025-2030 (%)

9.5 Blister packs - Market size and forecast 2025-2030

Chart on Blister packs - Market size and forecast 2025-2030 ($ million)
Data Table on Blister packs - Market size and forecast 2025-2030 ($ million)
Chart on Blister packs - Year-over-year growth 2025-2030 (%)
Data Table on Blister packs - Year-over-year growth 2025-2030 (%)

9.6 Pre-fillable syringes - Market size and forecast 2025-2030

Chart on Pre-fillable syringes - Market size and forecast 2025-2030 ($ million)
Data Table on Pre-fillable syringes - Market size and forecast 2025-2030 ($ million)
Chart on Pre-fillable syringes - Year-over-year growth 2025-2030 (%)
Data Table on Pre-fillable syringes - Year-over-year growth 2025-2030 (%)

9.7 Others - Market size and forecast 2025-2030

Chart on Others - Market size and forecast 2025-2030 ($ million)
Data Table on Others - Market size and forecast 2025-2030 ($ million)
Chart on Others - Year-over-year growth 2025-2030 (%)
Data Table on Others - Year-over-year growth 2025-2030 (%)

9.8 Market opportunity by Product

Market opportunity by Product ($ million)
Data Table on Market opportunity by Product ($ million)

10. Market Segmentation by Route of Administration

10.1 Market segments

Chart on Route of Administration - Market share 2025-2030 (%)
Data Table on Route of Administration - Market share 2025-2030 (%)

10.2 Comparison by Route of Administration

Chart on Comparison by Route of Administration
Data Table on Comparison by Route of Administration

10.3 Oral drugs - Market size and forecast 2025-2030

Chart on Oral drugs - Market size and forecast 2025-2030 ($ million)
Data Table on Oral drugs - Market size and forecast 2025-2030 ($ million)
Chart on Oral drugs - Year-over-year growth 2025-2030 (%)
Data Table on Oral drugs - Year-over-year growth 2025-2030 (%)

10.4 Injectables - Market size and forecast 2025-2030

Chart on Injectables - Market size and forecast 2025-2030 ($ million)
Data Table on Injectables - Market size and forecast 2025-2030 ($ million)
Chart on Injectables - Year-over-year growth 2025-2030 (%)
Data Table on Injectables - Year-over-year growth 2025-2030 (%)

10.5 Topical - Market size and forecast 2025-2030

Chart on Topical - Market size and forecast 2025-2030 ($ million)
Data Table on Topical - Market size and forecast 2025-2030 ($ million)
Chart on Topical - Year-over-year growth 2025-2030 (%)
Data Table on Topical - Year-over-year growth 2025-2030 (%)

10.6 Nasal - Market size and forecast 2025-2030

Chart on Nasal - Market size and forecast 2025-2030 ($ million)
Data Table on Nasal - Market size and forecast 2025-2030 ($ million)
Chart on Nasal - Year-over-year growth 2025-2030 (%)
Data Table on Nasal - Year-over-year growth 2025-2030 (%)

10.7 Others - Market size and forecast 2025-2030

Chart on Others - Market size and forecast 2025-2030 ($ million)
Data Table on Others - Market size and forecast 2025-2030 ($ million)
Chart on Others - Year-over-year growth 2025-2030 (%)
Data Table on Others - Year-over-year growth 2025-2030 (%)

10.8 Market opportunity by Route of Administration

Market opportunity by Route of Administration ($ million)
Data Table on Market opportunity by Route of Administration ($ million)

11. Customer Landscape

11.1 Customer landscape overview

Analysis of price sensitivity, lifecycle, customer purchase basket, adoption rates, and purchase criteria

12. Geographic Landscape

12.1 Geographic segmentation

Chart on Market share by geography 2025-2030 (%)
Data Table on Market share by geography 2025-2030 (%)

12.2 Geographic comparison

Chart on Geographic comparison
Data Table on Geographic comparison

12.3 North America - Market size and forecast 2025-2030

Chart on North America - Market size and forecast 2025-2030 ($ million)
Data Table on North America - Market size and forecast 2025-2030 ($ million)
Chart on North America - Year-over-year growth 2025-2030 (%)
Data Table on North America - Year-over-year growth 2025-2030 (%)
Chart on Regional Comparison - North America
Data Table on Regional Comparison - North America

12.3.1 US - Market size and forecast 2025-2030

Chart on US - Market size and forecast 2025-2030 ($ million)
Data Table on US - Market size and forecast 2025-2030 ($ million)
Chart on US - Year-over-year growth 2025-2030 (%)
Data Table on US - Year-over-year growth 2025-2030 (%)

12.3.2 Canada - Market size and forecast 2025-2030

Chart on Canada - Market size and forecast 2025-2030 ($ million)
Data Table on Canada - Market size and forecast 2025-2030 ($ million)
Chart on Canada - Year-over-year growth 2025-2030 (%)
Data Table on Canada - Year-over-year growth 2025-2030 (%)

12.3.3 Mexico - Market size and forecast 2025-2030

Chart on Mexico - Market size and forecast 2025-2030 ($ million)
Data Table on Mexico - Market size and forecast 2025-2030 ($ million)
Chart on Mexico - Year-over-year growth 2025-2030 (%)
Data Table on Mexico - Year-over-year growth 2025-2030 (%)

12.4 Europe - Market size and forecast 2025-2030

Chart on Europe - Market size and forecast 2025-2030 ($ million)
Data Table on Europe - Market size and forecast 2025-2030 ($ million)
Chart on Europe - Year-over-year growth 2025-2030 (%)
Data Table on Europe - Year-over-year growth 2025-2030 (%)
Chart on Regional Comparison - Europe
Data Table on Regional Comparison - Europe

12.4.1 Germany - Market size and forecast 2025-2030

Chart on Germany - Market size and forecast 2025-2030 ($ million)
Data Table on Germany - Market size and forecast 2025-2030 ($ million)
Chart on Germany - Year-over-year growth 2025-2030 (%)
Data Table on Germany - Year-over-year growth 2025-2030 (%)

12.4.2 France - Market size and forecast 2025-2030

Chart on France - Market size and forecast 2025-2030 ($ million)
Data Table on France - Market size and forecast 2025-2030 ($ million)
Chart on France - Year-over-year growth 2025-2030 (%)
Data Table on France - Year-over-year growth 2025-2030 (%)

12.4.3 UK - Market size and forecast 2025-2030

Chart on UK - Market size and forecast 2025-2030 ($ million)
Data Table on UK - Market size and forecast 2025-2030 ($ million)
Chart on UK - Year-over-year growth 2025-2030 (%)
Data Table on UK - Year-over-year growth 2025-2030 (%)

12.4.4 Italy - Market size and forecast 2025-2030

Chart on Italy - Market size and forecast 2025-2030 ($ million)
Data Table on Italy - Market size and forecast 2025-2030 ($ million)
Chart on Italy - Year-over-year growth 2025-2030 (%)
Data Table on Italy - Year-over-year growth 2025-2030 (%)

12.4.5 Spain - Market size and forecast 2025-2030

Chart on Spain - Market size and forecast 2025-2030 ($ million)
Data Table on Spain - Market size and forecast 2025-2030 ($ million)
Chart on Spain - Year-over-year growth 2025-2030 (%)
Data Table on Spain - Year-over-year growth 2025-2030 (%)

12.4.6 Switzerland - Market size and forecast 2025-2030

Chart on Switzerland - Market size and forecast 2025-2030 ($ million)
Data Table on Switzerland - Market size and forecast 2025-2030 ($ million)
Chart on Switzerland - Year-over-year growth 2025-2030 (%)
Data Table on Switzerland - Year-over-year growth 2025-2030 (%)

12.5 APAC - Market size and forecast 2025-2030

Chart on APAC - Market size and forecast 2025-2030 ($ million)
Data Table on APAC - Market size and forecast 2025-2030 ($ million)
Chart on APAC - Year-over-year growth 2025-2030 (%)
Data Table on APAC - Year-over-year growth 2025-2030 (%)
Chart on Regional Comparison - APAC
Data Table on Regional Comparison - APAC

12.5.1 China - Market size and forecast 2025-2030

Chart on China - Market size and forecast 2025-2030 ($ million)
Data Table on China - Market size and forecast 2025-2030 ($ million)
Chart on China - Year-over-year growth 2025-2030 (%)
Data Table on China - Year-over-year growth 2025-2030 (%)

12.5.2 India - Market size and forecast 2025-2030

Chart on India - Market size and forecast 2025-2030 ($ million)
Data Table on India - Market size and forecast 2025-2030 ($ million)
Chart on India - Year-over-year growth 2025-2030 (%)
Data Table on India - Year-over-year growth 2025-2030 (%)

12.5.3 Japan - Market size and forecast 2025-2030

Chart on Japan - Market size and forecast 2025-2030 ($ million)
Data Table on Japan - Market size and forecast 2025-2030 ($ million)
Chart on Japan - Year-over-year growth 2025-2030 (%)
Data Table on Japan - Year-over-year growth 2025-2030 (%)

12.5.4 South Korea - Market size and forecast 2025-2030

Chart on South Korea - Market size and forecast 2025-2030 ($ million)
Data Table on South Korea - Market size and forecast 2025-2030 ($ million)
Chart on South Korea - Year-over-year growth 2025-2030 (%)
Data Table on South Korea - Year-over-year growth 2025-2030 (%)

12.5.5 Australia - Market size and forecast 2025-2030

Chart on Australia - Market size and forecast 2025-2030 ($ million)
Data Table on Australia - Market size and forecast 2025-2030 ($ million)
Chart on Australia - Year-over-year growth 2025-2030 (%)
Data Table on Australia - Year-over-year growth 2025-2030 (%)

12.5.6 Indonesia - Market size and forecast 2025-2030

Chart on Indonesia - Market size and forecast 2025-2030 ($ million)
Data Table on Indonesia - Market size and forecast 2025-2030 ($ million)
Chart on Indonesia - Year-over-year growth 2025-2030 (%)
Data Table on Indonesia - Year-over-year growth 2025-2030 (%)

12.6 Middle East and Africa - Market size and forecast 2025-2030

Chart on Middle East and Africa - Market size and forecast 2025-2030 ($ million)
Data Table on Middle East and Africa - Market size and forecast 2025-2030 ($ million)
Chart on Middle East and Africa - Year-over-year growth 2025-2030 (%)
Data Table on Middle East and Africa - Year-over-year growth 2025-2030 (%)
Chart on Regional Comparison - Middle East and Africa
Data Table on Regional Comparison - Middle East and Africa

12.6.1 Saudi Arabia - Market size and forecast 2025-2030

Chart on Saudi Arabia - Market size and forecast 2025-2030 ($ million)
Data Table on Saudi Arabia - Market size and forecast 2025-2030 ($ million)
Chart on Saudi Arabia - Year-over-year growth 2025-2030 (%)
Data Table on Saudi Arabia - Year-over-year growth 2025-2030 (%)

12.6.2 Turkey - Market size and forecast 2025-2030

Chart on Turkey - Market size and forecast 2025-2030 ($ million)
Data Table on Turkey - Market size and forecast 2025-2030 ($ million)
Chart on Turkey - Year-over-year growth 2025-2030 (%)
Data Table on Turkey - Year-over-year growth 2025-2030 (%)

12.6.3 South Africa - Market size and forecast 2025-2030

Chart on South Africa - Market size and forecast 2025-2030 ($ million)
Data Table on South Africa - Market size and forecast 2025-2030 ($ million)
Chart on South Africa - Year-over-year growth 2025-2030 (%)
Data Table on South Africa - Year-over-year growth 2025-2030 (%)

12.6.4 UAE - Market size and forecast 2025-2030

Chart on UAE - Market size and forecast 2025-2030 ($ million)
Data Table on UAE - Market size and forecast 2025-2030 ($ million)
Chart on UAE - Year-over-year growth 2025-2030 (%)
Data Table on UAE - Year-over-year growth 2025-2030 (%)

12.6.5 Egypt - Market size and forecast 2025-2030

Chart on Egypt - Market size and forecast 2025-2030 ($ million)
Data Table on Egypt - Market size and forecast 2025-2030 ($ million)
Chart on Egypt - Year-over-year growth 2025-2030 (%)
Data Table on Egypt - Year-over-year growth 2025-2030 (%)

12.7 South America - Market size and forecast 2025-2030

Chart on South America - Market size and forecast 2025-2030 ($ million)
Data Table on South America - Market size and forecast 2025-2030 ($ million)
Chart on South America - Year-over-year growth 2025-2030 (%)
Data Table on South America - Year-over-year growth 2025-2030 (%)
Chart on Regional Comparison - South America
Data Table on Regional Comparison - South America

12.7.1 Brazil - Market size and forecast 2025-2030

Chart on Brazil - Market size and forecast 2025-2030 ($ million)
Data Table on Brazil - Market size and forecast 2025-2030 ($ million)
Chart on Brazil - Year-over-year growth 2025-2030 (%)
Data Table on Brazil - Year-over-year growth 2025-2030 (%)

12.7.2 Argentina - Market size and forecast 2025-2030

Chart on Argentina - Market size and forecast 2025-2030 ($ million)
Data Table on Argentina - Market size and forecast 2025-2030 ($ million)
Chart on Argentina - Year-over-year growth 2025-2030 (%)
Data Table on Argentina - Year-over-year growth 2025-2030 (%)

12.7.3 Chile - Market size and forecast 2025-2030

Chart on Chile - Market size and forecast 2025-2030 ($ million)
Data Table on Chile - Market size and forecast 2025-2030 ($ million)
Chart on Chile - Year-over-year growth 2025-2030 (%)
Data Table on Chile - Year-over-year growth 2025-2030 (%)

12.8 Market opportunity by geography

Market opportunity by geography ($ million)
Data Tables on Market opportunity by geography ($ million)

13. Drivers, Challenges, and Opportunity

13.1 Market drivers

Rapid global expansion of complex biologics and injectable therapeutics
Demographic shift toward aging populations and accompanying rise in chronic conditions
Increasing outsource architecture and proliferation of specialized contract development

13.2 Market challenges

Striking balance between rigid regulatory sterility standards
Managing raw material price volatility and high supply chain vulnerability
Combating advanced counterfeiting and guaranteeing secure end-to-end digital traceability

13.3 Impact of drivers and challenges

Impact of drivers and challenges in 2025 and 2030

13.4 Market opportunities

Accelerated deployment of intelligent connected smart packaging solutions
Systematic integration of multimodal AI and machine vision into packaging inspection lines
Pervasive implementation of eco-friendly active and intelligent gas-scavenging packaging architectures

14. Competitive Landscape

14.1 Overview

14.2

Overview on criticality of inputs and factors of differentiation

14.3 Landscape disruption

Overview on factors of disruption

14.4 Industry risks

Impact of key risks on business

15. Competitive Analysis

15.1 Companies profiled

Companies covered

15.2 Company ranking index

15.3 Market positioning of companies

Matrix on companies position and classification

15.4 Amcor Plc

Amcor Plc - Overview
Amcor Plc - Business segments
Amcor Plc - Key offerings
Amcor Plc - Segment focus
SWOT

15.5 AptarGroup Inc.

AptarGroup Inc. - Overview
AptarGroup Inc. - Business segments
AptarGroup Inc. - Key news
AptarGroup Inc. - Key offerings
AptarGroup Inc. - Segment focus
SWOT

15.6 Becton Dickinson and Co.

Becton Dickinson and Co. - Overview
Becton Dickinson and Co. - Business segments
Becton Dickinson and Co. - Key news
Becton Dickinson and Co. - Key offerings
Becton Dickinson and Co. - Segment focus
SWOT

15.7 Datwyler Holding Inc.

Datwyler Holding Inc. - Overview
Datwyler Holding Inc. - Business segments
Datwyler Holding Inc. - Key offerings
Datwyler Holding Inc. - Segment focus
SWOT

15.8 Dow Chemical Co.

Dow Chemical Co. - Overview
Dow Chemical Co. - Business segments
Dow Chemical Co. - Key offerings
Dow Chemical Co. - Segment focus
SWOT

15.9 Drug Plastics Group

Drug Plastics Group - Overview
Drug Plastics Group - Product / Service
Drug Plastics Group - Key offerings
SWOT

15.10 DS Smith Plc

DS Smith Plc - Overview
DS Smith Plc - Product / Service
DS Smith Plc - Key news
DS Smith Plc - Key offerings
SWOT

15.11 DuPont de Nemours Inc.

DuPont de Nemours Inc. - Overview
DuPont de Nemours Inc. - Business segments
DuPont de Nemours Inc. - Key news
DuPont de Nemours Inc. - Key offerings
DuPont de Nemours Inc. - Segment focus
SWOT

15.12 Gerresheimer AG

Gerresheimer AG - Overview
Gerresheimer AG - Business segments
Gerresheimer AG - Key offerings
Gerresheimer AG - Segment focus
SWOT

15.13 International Paper Co.

International Paper Co. - Overview
International Paper Co. - Business segments
International Paper Co. - Key news
International Paper Co. - Key offerings
International Paper Co. - Segment focus
SWOT

15.14 Jabil Inc.

Jabil Inc. - Overview
Jabil Inc. - Business segments
Jabil Inc. - Key offerings
Jabil Inc. - Segment focus
SWOT

15.15 Smurfit Westrock plc

Smurfit Westrock plc - Overview
Smurfit Westrock plc - Business segments
Smurfit Westrock plc - Key offerings
Smurfit Westrock plc - Segment focus
SWOT

15.16 Sonoco Products Co.

Sonoco Products Co. - Overview
Sonoco Products Co. - Business segments
Sonoco Products Co. - Key offerings
Sonoco Products Co. - Segment focus
SWOT

15.17 Stevanato Group S.p.A

Stevanato Group S.p.A - Overview
Stevanato Group S.p.A - Product / Service
Stevanato Group S.p.A - Key offerings
SWOT

15.18 Vitro SAB De CV

Vitro SAB De CV - Overview
Vitro SAB De CV - Business segments
Vitro SAB De CV - Key offerings
Vitro SAB De CV - Segment focus
SWOT

16. Appendix

16.1 Scope of the report

Market definition
Objectives
Notes and caveats

16.2 Inclusions and exclusions checklist

Inclusions checklist
Exclusions checklist

16.3 Currency conversion rates for US$

16.4 Research methodology

16.5 Data procurement

Information sources

16.6 Data validation

16.7 Validation techniques employed for market sizing

16.8 Data synthesis

16.9 360 degree market analysis

16.10 List of abbreviations

Research Methodology

Technavio presents a detailed picture of the market by way of study, synthesis, and summation of data from multiple sources. The analysts have presented the various facets of the market with a particular focus on identifying the key industry influencers. The data thus presented is comprehensive, reliable, and the result of extensive research, both primary and secondary.

INFORMATION SOURCES

Primary sources

  • Manufacturers and suppliers
  • Channel partners
  • Industry experts
  • Strategic decision makers

Secondary sources

  • Industry journals and periodicals
  • Government data
  • Financial reports of key industry players
  • Historical data
  • Press releases

DATA ANALYSIS

Data Synthesis

  • Collation of data
  • Estimation of key figures
  • Analysis of derived insights

Data Validation

  • Triangulation with data models
  • Reference against proprietary databases
  • Corroboration with industry experts

REPORT WRITING

Qualitative

  • Market drivers
  • Market challenges
  • Market trends
  • Five forces analysis

Quantitative

  • Market size and forecast
  • Market segmentation
  • Geographical insights
  • Competitive landscape

Interested in this report?

Get your sample now to see our research methodology and insights!

Download Now

Frequently Asked Questions

Pharmaceutical Packaging market growth will increase by USD 91611.6 million during 2026-2030.

The Pharmaceutical Packaging market is expected to grow at a CAGR of 10.3% during 2026-2030.

Pharmaceutical Packaging market is segmented by Material (Rigid plastic, Flexible plastic, Glass, Others) Product (Plastic bottles, Caps and closures, Blister packs, Pre-fillable syringes, Others) Route of administration (Oral drugs, Injectables, Topical, Nasal, Others)

ACG Group, Amcor Plc, AptarGroup Inc., Becton Dickinson and Co., Catalent Inc., Datwyler Holding Inc., Dow Chemical Co., Drug Plastics Group, DS Smith Plc, DuPont de Nemours Inc., Gerresheimer AG, International Paper Co., Jabil Inc., KP Holding GmbH and Co. KG, Perlen Packaging AG, Smurfit Westrock plc, Sonoco Products Co., Stevanato Group S.p.A, Vitro SAB De CV, West Pharma Services Inc. are a few of the key vendors in the Pharmaceutical Packaging market.

Europe will register the highest growth rate of 32.3% among the other regions. Therefore, the Pharmaceutical Packaging market in Europe is expected to garner significant business opportunities for the vendors during the forecast period.

US, Canada, Mexico, Germany, France, UK, Italy, Spain, Switzerland, China, India, Japan, South Korea, Australia, Indonesia, Saudi Arabia, Turkey, South Africa, UAE, Egypt, Brazil, Argentina, Chile

  • Rapid global expansion of complex biologics and injectable therapeutics is the driving factor this market.

The Pharmaceutical Packaging market vendors should focus on grabbing business opportunities from the Material segment as it accounted for the largest market share in the base year.
RIA - Research AI Assistant
Ask RIA