Phoropters Market Size 2024-2028
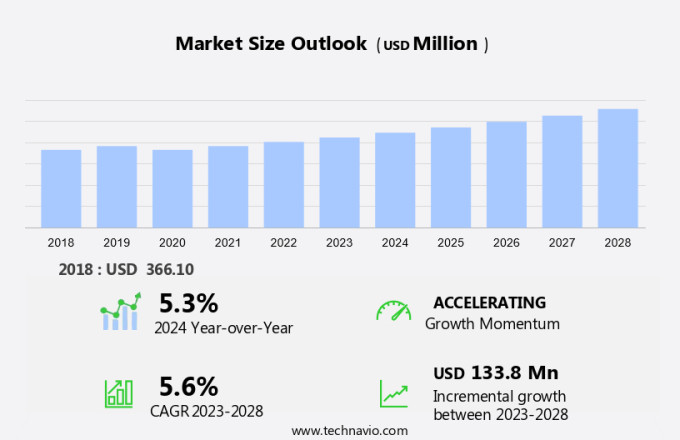
The phoropters market size is forecast to increase by USD 133.8 million, at a CAGR of 5.6% between 2023 and 2028.
- The Phoropter market is experiencing significant growth, driven by the increasing geriatric population and the development of new, more affordable phoropters. The aging demographic is creating a substantial demand for vision correction devices, as older adults often require regular eye examinations and prescriptions for eyeglasses or contact lenses. Additionally, the introduction of cost-effective phoropters is expanding market accessibility, making vision care more accessible to a broader population. However, the lack of a clear reimbursement policy poses a significant challenge for market participants. Without adequate insurance coverage or government subsidies, many consumers may delay or forgo vision care, impacting the market's growth potential.
- To capitalize on the expanding market and mitigate this obstacle, companies must focus on developing innovative pricing strategies and collaborating with insurance providers and government entities to establish reimbursement policies. By addressing this challenge, businesses can effectively cater to the growing demand for phoropters and strengthen their competitive position in the market.
What will be the Size of the Phoropters Market during the forecast period?
Explore in-depth regional segment analysis with market size data - historical 2018-2022 and forecasts 2024-2028 - in the full report.
Request Free Sample
The phoropter market is characterized by continuous evolution and dynamic market activities, driven by advancements in vision testing technologies and growing applications across various sectors. Stereoacuity testing, refraction error correction, and vision testing equipment are integral components of comprehensive eye examinations. Binocular vision assessment, hyperopia correction techniques, and retinoscopy techniques are essential for diagnosing and correcting vision issues. Interpupillary distance (IPD) measurement and phoropter lens selection are crucial elements of customized lens prescriptions. Eye examination protocols incorporate advanced technologies such as lensometers for accuracy and prism adjustment techniques for precise alignment. Astigmatism correction methods, ophthalmic lens material, and ocular alignment assessment contribute to improved visual acuity and optical quality.
Ophthalmic lens design, cylindrical lens power, pupil size measurement, and ophthalmic lens coatings are essential aspects of modern vision correction technology. Presbyopia lens options and myopia management strategies cater to the unique needs of aging populations and those with progressive vision conditions. Visual field analysis, vergence testing procedures, lens power calculation, color vision testing, and patient eye positioning ensure comprehensive vision assessments. Spherical lens power and refractive error detection enable accurate prescriptions, while accommodation amplitude and keratometry readings provide valuable diagnostic information. The phoropter market's ongoing development reflects the industry's commitment to addressing the evolving needs of patients and healthcare providers.
With a focus on innovation and precision, this market continues to expand its reach and impact across various sectors.
How is this Phoropters Industry segmented?
The phoropters industry research report provides comprehensive data (region-wise segment analysis), with forecasts and estimates in "USD million" for the period 2024-2028, as well as historical data from 2018-2022 for the following segments.
- Type
- Manual
- Digital
- Geography
- North America
- US
- Canada
- Europe
- France
- Germany
- Italy
- UK
- APAC
- China
- India
- Japan
- South Korea
- Rest of World (ROW)
- North America
By Type Insights
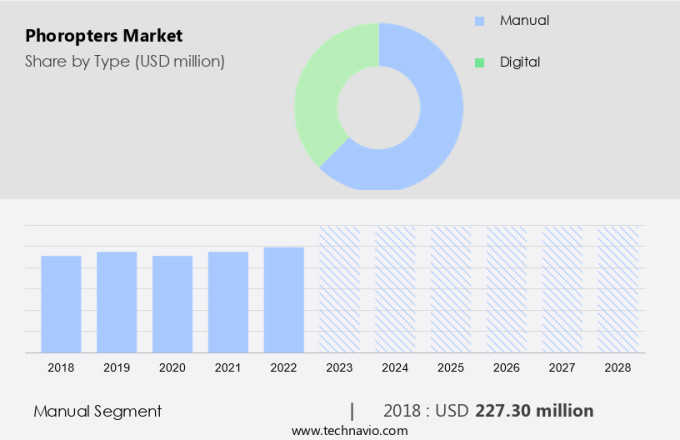
The manual segment is estimated to witness significant growth during the forecast period.
The manual segment of the market holds a significant share, catering to eye care professionals and clinics that prefer traditional, hands-on diagnostic tools. Manual phoropters, valued for their cost-effectiveness, simplicity, and reliability, are suitable for various clinical settings, particularly in emerging economies where budget constraints can limit access to advanced digital equipment. These devices enable optometrists to manually control the examination process, adjusting lenses and settings to determine the precise corrective lenses for patients. Key players in the market, such as Topcon, Carl Zeiss, and Essilor Instruments, continue to manufacture high-quality manual phoropters to meet this demand. Stereoacuity testing and refraction error correction are integral parts of the eye examination process, with phoropters playing a crucial role in these assessments.
Binocular vision assessment, hyperopia correction techniques, and retinoscopy techniques are also essential functions of these devices. Interpupillary distance (IPD) measurement and phoropter lens selection are critical aspects of the eye examination protocols, ensuring accurate refractive error detection. Lensometer accuracy and prism adjustment techniques are essential for precise lens prescription and fitting. Astigmatism correction methods, ophthalmic lens material, and ocular alignment assessment contribute to the optical quality evaluation and ophthalmic lens design. Cylindrical lens power, pupil size measurement, and ophthalmic lens coatings are essential considerations for vision correction technology. Presbyopia lens options and myopia management strategies are essential for addressing age-related vision changes and managing nearsightedness.
Visual field analysis, vergence testing procedures, lens power calculation, color vision testing, patient eye positioning, and visual acuity measurement are additional functions that contribute to comprehensive eye examinations. Spherical lens power and accommodation amplitude assessment are essential for determining the overall refractive error and ensuring effective vision correction. Keratometry readings provide valuable information for contact lens fitting and refractive surgery planning. The market continues to evolve, with advancements in technology leading to digital and automated solutions, while manual phoropters remain a reliable and cost-effective option for many eye care professionals.
The Manual segment was valued at USD 227.30 million in 2018 and showed a gradual increase during the forecast period.
Regional Analysis
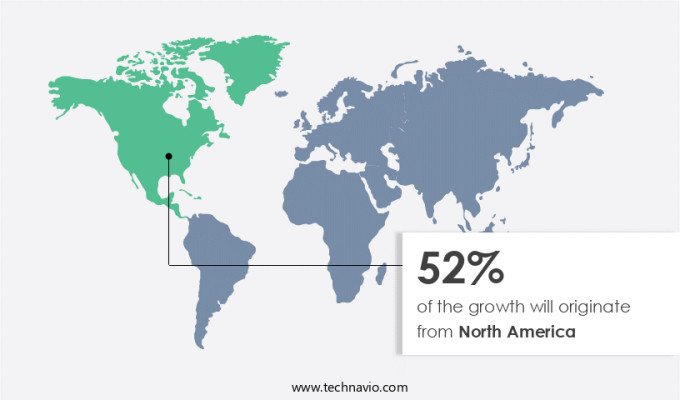
North America is estimated to contribute 52% to the growth of the global market during the forecast period. Technavio's analysts have elaborately explained the regional trends and drivers that shape the market during the forecast period.
In North America, the market is experiencing steady growth due to the increasing prevalence of eye conditions such as myopia, hyperopia, and astigmatism, leading to a higher demand for eye exams and corrective lenses. Phoropters, integral to eye examinations, determine refractive errors and prescribe precise prescriptions, making them indispensable in optometry and ophthalmology practices. Advancements in eye care technology are driving market growth, with leading players, including Topcon and Nidek, innovating by developing automated and digital phoropters. These technologies improve precision, enhance patient comfort, and streamline the examination process. Vision testing equipment, including phoropters, undergo rigorous protocols to ensure lensometer accuracy, prism adjustment techniques, and ocular alignment assessment.
Ophthalmic lens materials, such as high-definition plastics and lightweight metals, offer improved optical quality evaluation and ophthalmic lens design. Cylindrical lens powers and pupil size measurements are crucial considerations in prescribing lenses, while spherical lens powers and refractive error detection enable accurate prescriptions. Accommodation amplitude and keratometry readings are essential in assessing eye health and determining the most effective vision correction methods. Presbyopia lens options and myopia management strategies cater to an aging population and the rising prevalence of near-sightedness. Color vision testing, vergence testing procedures, and visual field analysis are additional features that contribute to comprehensive eye examinations. In conclusion, the market is witnessing continuous innovation and growth, driven by advancements in eye care technology, an aging population, and the increasing prevalence of eye conditions.
The integration of automated and digital technologies, along with the development of advanced materials and vision correction methods, is transforming the industry and enhancing patient care.
Market Dynamics
Our researchers analyzed the data with 2023 as the base year, along with the key drivers, trends, and challenges. A holistic analysis of drivers will help companies refine their marketing strategies to gain a competitive advantage.
The phoropter market encompasses a diverse range of devices utilized in the optical industry for subjective refraction measurements. These instruments play a pivotal role in determining the most suitable lens prescription for individuals with vision impairments or those undergoing refractive surgery. Advancements in technology have expanded the applications of phoropters beyond traditional eyecare settings. For instance, they are increasingly being adopted in research institutions for studying the effects of various lens designs on visual acuity. In addition, phoropters are finding a niche in the military and aviation sectors, where accurate refraction measurements are crucial for ensuring optimal performance and safety. Moreover, the integration of advanced features such as automatic refraction and remote monitoring capabilities is driving the evolution of phoropters. These features enable faster and more accurate prescription determination, enhancing the overall patient experience. Furthermore, they facilitate remote consultations, making eye care more accessible to individuals in remote locations or those with mobility issues. In summary, the phoropter market is witnessing significant growth and innovation, driven by the expanding scope of applications across various sectors. The integration of advanced features is enabling faster, more accurate prescription determination and enhancing accessibility to eye care services.
What are the key market drivers leading to the rise in the adoption of Phoropters Industry?
- The geriatric population's expansion is the primary factor fueling market growth. (Maintaining a professional tone, ensuring grammatical correctness, and adhering to the 100-word limit.)
- The global market for phoropters, which are essential tools in eye examinations for determining vision correction prescriptions, is experiencing significant growth due to the increasing prevalence of age-related eye conditions among the aging population. As people age, they often require corrective lenses or adjustments to their current prescriptions, necessitating regular vision assessments. In response, healthcare providers and optometrists are investing in advanced diagnostic equipment, including digital phoropters that offer precise measurements and improved prescription accuracy. These devices play a crucial role in diagnosing conditions such as presbyopia, cataracts, glaucoma, and macular degeneration, which are more common among older adults.
- Lens power calculation, color vision testing, patient eye positioning, visual acuity measurement, spherical lens power, refractive error detection, accommodation amplitude, and keratometry readings are all critical functions of phoropters that contribute to their increasing demand. The growing need for accurate vision assessments and the rising prevalence of age-related eye conditions make the market a promising area for investment.
What are the market trends shaping the Phoropters Industry?
- The development of new, low-cost phoropters is an emerging trend in the market. This innovative approach to unmanned aerial vehicles (UAVs) is gaining significant attention due to its cost-effectiveness.
- The global market for vision testing equipment, including stereoacuity testing and binocular vision assessment devices like phoropters, is experiencing innovation driven by the need for affordable solutions. Traditional phoropters, utilized by eye care professionals to assess refraction errors and determine corrective lens prescriptions, can be costly, limiting accessibility for smaller clinics and populations with financial constraints. In response, manufacturers are developing more affordable phoropters without sacrificing accuracy and functionality. This trend is particularly significant in developing regions, where the demand for affordable vision care is increasing due to higher instances of refractive errors and limited healthcare budgets. Advancements in materials and technology are enabling companies to produce cost-effective phoropters without compromising quality.
- These advancements include refinement of hyperopia correction techniques and retinoscopy methods, as well as improved interpupillary distance (IPD) measurement and phoropter lens selection processes. By addressing the affordability issue, these innovations are making eye care more accessible to a broader population, ultimately improving overall vision health.
What challenges does the Phoropters Industry face during its growth?
- The absence of a clear reimbursement policy poses a significant challenge to the industry's growth trajectory. In order to foster expansion and development, it is essential for organizations to establish and adhere to a well-defined reimbursement policy.
- The global market for phoropters faces a substantial obstacle due to the absence or limited reimbursement policies for eye examinations and related procedures. Phoropters are indispensable tools in optometry and ophthalmology, facilitating the measurement of refractive errors and determination of corrective lens prescriptions. However, the financial burden on patients who must pay for these procedures out-of-pocket deters many from seeking regular eye care. In areas with minimal or non-existent reimbursement policies, eye care providers may be disincentivized from investing in advanced phoropters.
- These instruments could significantly enhance diagnostic accuracy and improve patient outcomes through features like eye alignment assessment, optical quality evaluation, ophthalmic lens material analysis, prism adjustment techniques, and ophthalmic lens design. The lack of financial support for these essential services hinders market growth and accessibility.
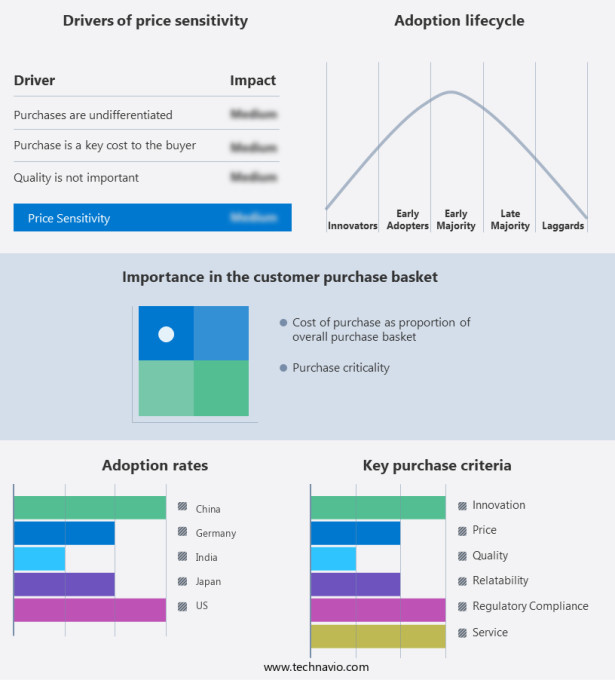
Exclusive Customer Landscape
The phoropters market forecasting report includes the adoption lifecycle of the market, covering from the innovator's stage to the laggard's stage. It focuses on adoption rates in different regions based on penetration. Furthermore, the phoropters market report also includes key purchase criteria and drivers of price sensitivity to help companies evaluate and develop their market growth analysis strategies.
Customer Landscape
Key Companies & Market Insights
Companies are implementing various strategies, such as strategic alliances, phoropters market forecast, partnerships, mergers and acquisitions, geographical expansion, and product/service launches, to enhance their presence in the industry.
AMETEK Inc. - The company specializes in providing advanced ophthalmic diagnostic equipment, including AMETEK Reichert's line of phoropters.
The industry research and growth report includes detailed analyses of the competitive landscape of the market and information about key companies, including:
- AMETEK Inc.
- BON Optic Vertriebsges mbH
- Carl Zeiss AG
- EssilorLuxottica
- Hangzhou Kingfish Optical Instrument Co. Ltd.
- Hesh Opto Lab Pvt. Ltd.
- Huvitz Co. Ltd.
- Luneau Technology Group
- Marco Ophthalmic Inc.
- NIDEK Co. Ltd.
- NINGBO MING SING OPTICAL R and D Co. Ltd.
- Oftas S.r.l
- Rexxam Co. Ltd.
- Righton Ltd.
- Rocket Medical Plc
- Shanghai Yanke Instrument Co. Ltd.
- Takagi Seiko Co. Ltd.
- Technovision India Pvt. Ltd.
- Topcon America Corp.
- US Ophthalmic LLC
Qualitative and quantitative analysis of companies has been conducted to help clients understand the wider business environment as well as the strengths and weaknesses of key industry players. Data is qualitatively analyzed to categorize companies as pure play, category-focused, industry-focused, and diversified; it is quantitatively analyzed to categorize companies as dominant, leading, strong, tentative, and weak.
Recent Development and News in Phoropters Market
- In January 2024, Phoropter Technologies, a leading player in the phoropter market, announced the launch of their latest product, the "Intelliphoro 2.0," an advanced phoropter system with AI-assisted refraction technology. This innovation aims to enhance the accuracy and efficiency of eye examinations, as reported in their official press release.
- In March 2024, Phoropter Technologies formed a strategic partnership with EssilorLuxottica, the world's largest eyewear company. The collaboration aimed to integrate the Intelliphoro 2.0 system into EssilorLuxottica's retail network, expanding its reach and increasing market penetration, as per the companies' joint statement.
- In May 2024, Phoropter Technologies secured a significant funding round of USD 50 million from Sequoia Capital India and Accel, as reported by TechCrunch. The investment will be used to accelerate product development, expand the company's global presence, and strengthen its market position, according to the company's press release.
- In January 2025, Phoropter Technologies received FDA approval for the Intelliphoro 2.0 system, marking a significant milestone in the company's growth. The approval paved the way for wider adoption in the US market and increased market share, as stated in the company's official press release.
Research Analyst Overview
- In the dynamic phoropter market, quality control measures and adherence to eyewear safety standards are paramount. Lens material properties and clinical refraction protocols are essential for ensuring visual performance improvement. Advanced phoropter technology incorporates objective refraction techniques, automated refraction systems, and phoropter calibration methods for precise prescription filling. Vision therapy techniques and lens fitting procedures contribute to refractive error management and patient comfort evaluation. Frame fitting techniques and optical shop equipment are crucial for proper eyewear dispensing. Ophthalmic lens types and clinical practice guidelines are integral to the prescription filling process. Patient education materials and lens cleaning solutions are essential for maintaining eye health and optimal visual impairment diagnosis.
- Objective refraction techniques and eye health assessment are integral to comprehensive vision screening procedures. Optical instrument maintenance and lens power verification are essential for accurate and reliable phoropter performance. Subjective refraction methods and visual performance improvement are key factors driving market growth. Vision therapy techniques and digital phoropter features are revolutionizing the industry, offering new opportunities for innovation and improvement. Phoropter technology continues to evolve, addressing the diverse needs of patients and healthcare professionals.
Dive into Technavio's robust research methodology, blending expert interviews, extensive data synthesis, and validated models for unparalleled Phoropters Market insights. See full methodology.
|
Market Scope |
|
|
Report Coverage |
Details |
|
Page number |
158 |
|
Base year |
2023 |
|
Historic period |
2018-2022 |
|
Forecast period |
2024-2028 |
|
Growth momentum & CAGR |
Accelerate at a CAGR of 5.6% |
|
Market growth 2024-2028 |
USD 133.8 million |
|
Market structure |
Fragmented |
|
YoY growth 2023-2024(%) |
5.3 |
|
Key countries |
US, China, Japan, Germany, India, France, Canada, South Korea, UK, and Italy |
|
Competitive landscape |
Leading Companies, Market Positioning of Companies, Competitive Strategies, and Industry Risks |
What are the Key Data Covered in this Phoropters Market Research and Growth Report?
- CAGR of the Phoropters industry during the forecast period
- Detailed information on factors that will drive the growth and forecasting between 2024 and 2028
- Precise estimation of the size of the market and its contribution of the industry in focus to the parent market
- Accurate predictions about upcoming growth and trends and changes in consumer behaviour
- Growth of the market across North America, Europe, Asia, and Rest of World (ROW)
- Thorough analysis of the market's competitive landscape and detailed information about companies
- Comprehensive analysis of factors that will challenge the phoropters market growth of industry companies
We can help! Our analysts can customize this phoropters market research report to meet your requirements.


