Photoelectric Sensors Market Analysis, Size, and Forecast 2025-2029: North America (US and Canada), Europe (France, Germany, Italy, UK), Middle East and Africa , APAC (China, India, Japan, South Korea), South America , and Rest of World (ROW)

Photoelectric Sensors Market Analysis, Size, and Forecast 2025-2029:
North America (US and Canada), Europe (France, Germany, Italy, UK), Middle East and Africa , APAC (China, India, Japan, South Korea), South America , and Rest of World (ROW)

Published: Mar 2025 226 Pages SKU: IRTNTR77610

Market Overview at a Glance

$1.01 B
Market Opportunity
8.6%
CAGR
7.8
YoY growth 2024-2025(%)

Photoelectric Sensors Market Size 2025-2029

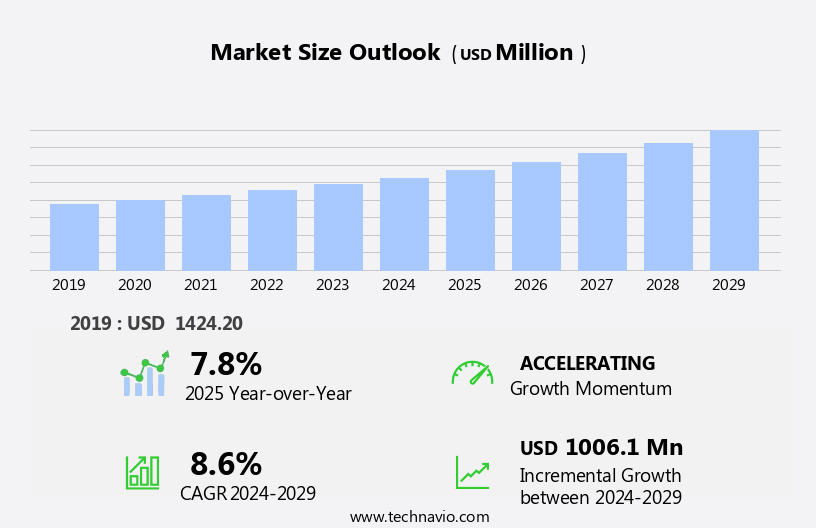
The photoelectric sensors market size is forecast to increase by USD 1.01 billion, at a CAGR of 8.6% between 2024 and 2029.

  • The market is witnessing significant growth, driven by the increasing adoption of Industry 4.0 practices and automation across various industries. This trend is leading to an escalating demand for advanced sensor technologies, including photoelectric sensors, to optimize manufacturing processes and enhance production efficiency. Another key driver is the integration of Light Detection and Ranging (LiDAR) technology within photoelectric sensors, enabling them to offer superior sensing capabilities and versatility. However, cost constraints remain a significant challenge for the market, as advanced photoelectric sensor technologies can be expensive.
  • Companies must address these challenges by focusing on cost reduction strategies, such as optimizing production processes, improving efficiency, and exploring partnerships and collaborations to share development costs and risks. To capitalize on the market opportunities and navigate challenges effectively, businesses should stay informed of technological advancements, market trends, and customer needs, and invest in research and development to create innovative, cost-effective solutions.

What will be the Size of the Photoelectric Sensors Market during the forecast period?

Photoelectric Sensors Market Size

Explore in-depth regional segment analysis with market size data - historical 2019-2023 and forecasts 2025-2029 - in the full report.  
Request Free Sample

The market continues to evolve, driven by the diverse applications across various sectors. Proximity sensors, a key segment, find extensive use in process control, object detection, and presence detection. Fiber optic sensors and digital sensors cater to high-precision requirements, while long-range sensors enable speed measurement and machine vision applications. PLC integration and SCADA integration are crucial for industrial automation. Sensor calibration remains a critical aspect, ensuring sensor repeatability and accuracy. Ultrasonic sensors and laser sensors offer reliable level sensing, while sensor networks facilitate data processing and environmental monitoring. Motion detection is a growing application, particularly in building automation and quality control.

Innovations in sensor technology include smart sensors, which offer self-diagnostics and self-calibration. Sensor housings and sensor wiring solutions ensure durability and ease of installation. Signal conditioning and noise reduction are essential for maintaining signal integrity. Food & beverage processing relies on photoelectric sensors for various applications, from level sensing to presence detection. Infrared sensors and capacitive sensors are commonly used for food detection and temperature monitoring. Ethernet/IP and other communication protocols facilitate seamless integration into automation systems. The market's continuous dynamism is reflected in the ongoing development of advanced sensor technologies, such as high-speed sensors and sensor fusion, which combine data from multiple sensors to enhance performance.

Sensor maintenance and sensor cleaning are essential for ensuring sensor longevity and optimal functionality. Power supply solutions cater to the varying power requirements of different sensor types. In summary, the market is characterized by its continuous evolution, driven by the diverse applications across various sectors. The market's dynamism is reflected in the ongoing development of advanced sensor technologies, communication protocols, and integration solutions.

How is this Photoelectric Sensors Industry segmented?

The photoelectric sensors industry research report provides comprehensive data (region-wise segment analysis), with forecasts and estimates in "USD million" for the period 2025-2029, as well as historical data from 2019-2023 for the following segments.

  • Type
    • Laser photoelectric sensor
    • Fiber photoelectric sensor
  • End-user
    • Automotive
    • Consumer electronics
    • Building automation
    • Others
  • Product
    • Retroreflective
    • Diffuse
    • Through-beam
  • Application
    • Object detection
    • Positioning
    • Safety and security
    • Counting
  • Geography
    • North America
      • US
      • Canada
    • Europe
      • France
      • Germany
      • Italy
      • UK
    • APAC
      • China
      • India
      • Japan
      • South Korea
    • Rest of World (ROW)

    By Type Insights

    The laser photoelectric sensor segment is estimated to witness significant growth during the forecast period.

    The photoelectric sensor market encompasses various types of sensors, including ip67 rated, digital, fiber optic, long-range, and short-range sensors. These sensors cater to diverse applications such as presence detection, process control, object detection, position measurement, and quality control in industries like manufacturing, automation, and robotics. Laser photoelectric sensors, in particular, are gaining popularity due to their high precision and reliability. Utilizing laser technology, these sensors offer focused and constant beams for accurate detection and measurement. They are increasingly adopted for tasks requiring great efficiency and precision, such as identifying and positioning objects in manufacturing lines for seamless automation and quality control.

    Other advanced features include EMI/RFI shielding, PLC integration, and SCADA integration. Environmental monitoring applications also benefit from photoelectric sensors' ability to detect motion, measure speed, and level sensing. Machine vision, data processing, and signal conditioning further enhance their functionality. Sensor networks, sensor calibration, and sensor maintenance ensure consistent performance and longevity. Food & beverage processing industries also leverage photoelectric sensors for their hygienic design and ease of cleaning. Power supply and sensor accuracy are essential considerations for optimal sensor performance. In conclusion, the photoelectric sensor market is evolving with advancements in technology, offering versatile solutions for various industries and applications.

    Photoelectric Sensors Market Size

    Request Free Sample

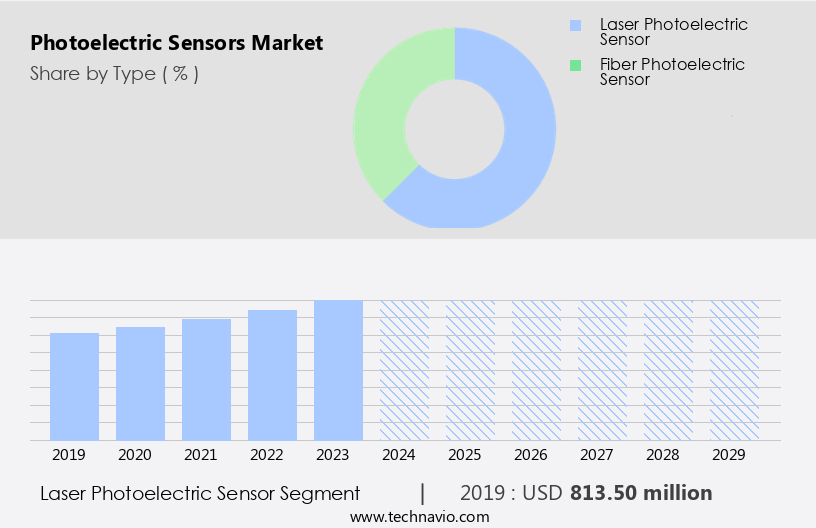
    The Laser photoelectric sensor segment was valued at USD 813.50 billion in 2019 and showed a gradual increase during the forecast period.

    Regional Analysis

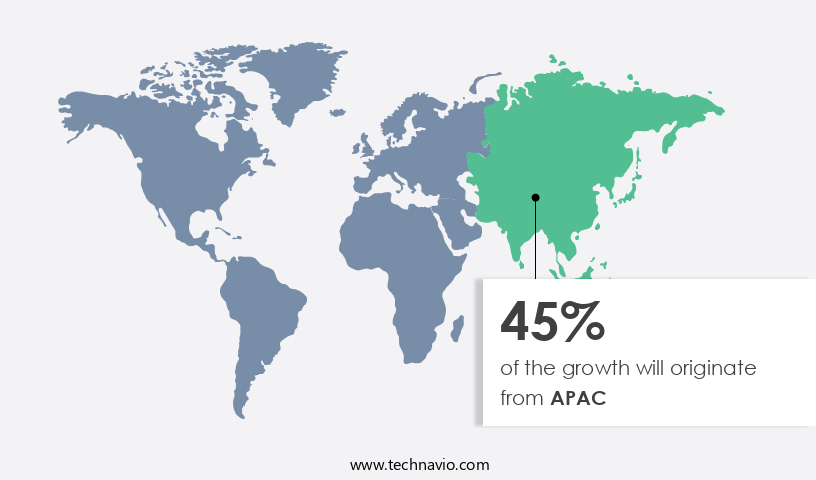
    APAC is estimated to contribute 45% to the growth of the global market during the forecast period.Technavio’s analysts have elaborately explained the regional trends and drivers that shape the market during the forecast period.

    Photoelectric Sensors Market Share by Geography

     Request Free Sample

    The market in APAC is experiencing significant growth due to the increasing industrialization and automation in various sectors. The demand for smart manufacturing is driving the adoption of these sensors, particularly in industries such as automotive, electronics, and manufacturing. Severe industrial safety standards also necessitate the use of photoelectric sensors for process control, object detection, and quality control. In addition, the e-commerce sector's expansion and the need for efficient material handling in logistics and storage are increasing the demand for these sensors. Moreover, infrastructure construction and smart city projects are accelerating the use of photoelectric sensors in building automation applications.

    These sensors come in various forms, including fiber optic, digital, long-range, and high-speed, catering to diverse industry requirements. They offer features such as EMI/RFI shielding, sensor linearity, digital output, and level sensing, among others. Photoelectric sensors are also integrated with technologies like machine vision, SCADA, and PLC for seamless data processing and industrial automation. The market is witnessing the emergence of advanced sensors, such as smart sensors, ultrasonic sensors, and sensor networks, which offer enhanced capabilities for environmental monitoring and motion detection. Sensor maintenance, cleaning, and calibration are crucial aspects of ensuring their longevity and accuracy. The market in APAC is poised for continued expansion, driven by the food & beverage industry's growing automation needs and the increasing focus on sensor resolution, repeatability, and lifespan.

    Power supply and signal conditioning are essential considerations for optimizing sensor performance.

    Market Dynamics

    Our researchers analyzed the data with 2024 as the base year, along with the key drivers, trends, and challenges. A holistic analysis of drivers will help companies refine their marketing strategies to gain a competitive advantage.

    In the dynamic and innovative technology landscape, the market continues to gain momentum, fueled by advancements in automation, industrial IoT, and machine vision applications. This market encompasses a diverse range of photoelectric sensors, including infrared, phototransistor, and CCD sensors, each offering unique advantages in terms of sensitivity, response time, and versatility. Integration with various communication protocols such as CAN, Ethernet, and Modbus, as well as rugged designs for harsh environments, further broadens their applicability. Key players in this market focus on R&D to deliver high-performance, cost-effective solutions for industries like automotive, manufacturing, and healthcare, ensuring continued growth and evolution.

    What are the key market drivers leading to the rise in the adoption of Photoelectric Sensors Industry?

    • The integration of Industry 4.0 practices and automation technologies is the primary catalyst fueling market growth. 

    • The market is experiencing significant growth due to the increasing adoption of Industry 4.0 and industrial automation. With the integration of digital technologies into manufacturing processes, there is a shift towards smart and networked industrial systems. Photoelectric sensors, which use light-based technology to detect the presence, absence, and distance of objects, are essential components in providing precise and efficient item detection in automated procedures. As enterprises embrace smart manufacturing processes, there is a growing demand for real-time data collection and precise control in automated systems. Photoelectric sensors offer signal isolation, SCADA integration, and digital output, making them ideal for level sensing applications in various industries.
    • These sensors come in various types, including infrared, inductive, capacitive, and thru-beam, catering to diverse industrial needs. Moreover, advanced features such as noise reduction, Ethernet/IP connectivity, and high-precision capabilities enhance the functionality and reliability of photoelectric sensors. These sensors are widely used in various industries, including automotive, food and beverage, pharmaceuticals, and semiconductors, to ensure efficient and accurate production processes. Overall, the market for photoelectric sensors is expected to continue its growth trajectory due to the increasing demand for automation and smart manufacturing processes.

    What are the market trends shaping the Photoelectric Sensors Industry?

    • The integration of LiDAR technology into photoelectric sensors is an emerging market trend. LiDAR, or Light Detection and Ranging, enhances the capabilities of photoelectric sensors by adding distance measurement and 3D point cloud data acquisition. This fusion of technologies offers significant advantages in various industries, including autonomous vehicles, surveying, and industrial automation.

    • The integration of LiDAR technology into photoelectric sensors represents a pivotal advancement in the global photoelectric sensor market. LiDAR sensors, which use laser beams to measure distances with high precision, enhance standard photoelectric sensors' capabilities for object detection and distance measurement. This technology generates precise 3D maps of the environment, enabling superior accuracy in detecting object shapes, sizes, and positions. In industrial automation, LiDAR-equipped photoelectric sensors optimize object detection and localization, leading to increased efficiency and safety. This trend is instrumental in the development of advanced driver-assistance systems (ADAS) and self-driving cars, where precise distance measurement is crucial for collision avoidance and navigation.
    • Sensor calibration, sensor networks, sensor repeatability, sensor resolution, sensor lifespan, power supply, sensor accuracy, motion detection, and sensor wiring are essential factors influencing the market's growth. Ultrasonic sensors and laser sensors are other prominent technologies in the photoelectric sensor market, catering to various industries, including food & beverage.

    What challenges does the Photoelectric Sensors Industry face during its growth?

    • The implementation of advanced photoelectric sensor technologies in the industry faces significant cost constraints, posing a substantial challenge to growth. 

    • Photoelectric sensors play a significant role in various industries for presence detection, process control, object detection, speed measurement, position measurement, and quality control. Advanced photoelectric sensors, including IP67 rated, fiber optic, digital, long-range, and analog sensors, offer enhanced features and capabilities. However, the high cost of producing and developing these sensors poses a challenge to their widespread adoption, particularly in price-sensitive businesses. This cost barrier may hinder the adoption of advanced sensors in industries where cost efficiency is crucial, such as manufacturing, shipping, and consumer electronics. Companies in these industries may be reluctant to invest in these technologies despite their superior performance due to concerns about the return on investment and the potential impact on their overall cost structures.
    • EMI/RFI shielding and short-range sensors are also essential considerations for specific applications. The market dynamics of photoelectric sensors necessitate a balance between cost and performance to cater to diverse industry requirements.

    Exclusive Customer Landscape

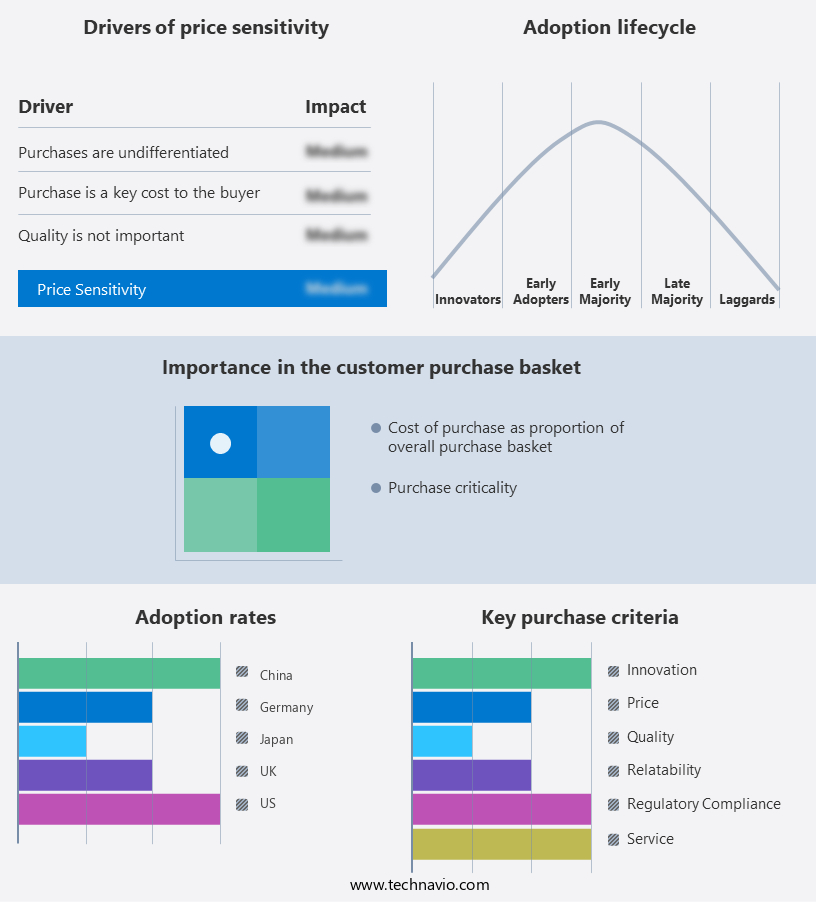
    The photoelectric sensors market forecasting report includes the adoption lifecycle of the market, covering from the innovator’s stage to the laggard’s stage. It focuses on adoption rates in different regions based on penetration. Furthermore, the photoelectric sensors market report also includes key purchase criteria and drivers of price sensitivity to help companies evaluate and develop their market growth analysis strategies.

    Photoelectric Sensors Market Share by Geography

     Customer Landscape

    Key Companies & Market Insights

    Companies are implementing various strategies, such as strategic alliances, photoelectric sensors market forecast, partnerships, mergers and acquisitions, geographical expansion, and product/service launches, to enhance their presence in the industry.

    Autonics Corporation - Photoelectric sensors, including BUP series, BJX series, BRQ series, BJP series, BJR series, BTF series, BTS series, BJ series, BY series, and BYD series, are integral components of our advanced technology offerings. These sensors, known for their precision and reliability, enhance machine performance and efficiency. By utilizing cutting-edge photoelectric technology, we deliver superior solutions to various industries.

    The industry research and growth report includes detailed analyses of the competitive landscape of the market and information about key companies, including:

    • Autonics Corporation
    • Balluff GmbH
    • Banner Engineering Corp
    • Baumer Group
    • Carlo Gavazzi Holding AG
    • Eaton Corporation PLC
    • Hans Turck GmbH & Co. KG
    • IFM Electronic GmbH
    • Keyence Corporation
    • Leuze Electronic GmbH + Co. KG
    • Omron Corporation
    • Panasonic Corporation
    • Pepperl+Fuchs SE
    • Rockwell Automation Inc.
    • Schneider Electric SE
    • SICK AG
    • Takex Limited
    • Telemecanique Sensors
    • Wenglor Sensoric GmbH
    • Yamatake Corporation

    Qualitative and quantitative analysis of companies has been conducted to help clients understand the wider business environment as well as the strengths and weaknesses of key industry players. Data is qualitatively analyzed to categorize companies as pure play, category-focused, industry-focused, and diversified; it is quantitatively analyzed to categorize companies as dominant, leading, strong, tentative, and weak.

    Recent Development and News in Photoelectric Sensors Market

    • In January 2024, Keyence Corporation, a leading manufacturer of industrial automation solutions, launched its new photoelectric sensor series, the BL Series, featuring advanced technologies such as high-speed response and high-sensitivity for various applications (Keyence Corporation Press Release).
    • In March 2024, Sensirion AG, a Swiss sensor manufacturer, and ifm electronic GmbH, a German automation solutions provider, announced a strategic partnership to develop and market combined photoelectric sensor and condition monitoring systems for industrial applications (ifm electronic GmbH Press Release).
    • In May 2024, OMRON Corporation, a global leader in industrial automation and sensing solutions, completed the acquisition of Adept Technology, Inc., a US-based provider of collaborative robots and autonomous mobile robots, expanding its robotics business and enhancing its photoelectric sensor offerings (OMRON Corporation Press Release).
    • In April 2025, the European Union's REACH regulation introduced new guidelines for the classification, labeling, and safe use of photoelectric sensors and other industrial sensors, ensuring stricter compliance with environmental, health, and safety standards (European Chemicals Agency Press Release).

    Research Analyst Overview

    • The market is experiencing significant growth, driven by the integration of advanced technologies such as deep learning and machine learning for pattern recognition and image processing. Human-machine interfaces (HMI) are becoming more prevalent, enabling real-time monitoring and improved efficiency in various industries. Big data and data analytics are playing a crucial role in process optimization, leading to increased productivity and cost reduction. IoT integration and wireless communication enable remote monitoring and reduced downtime, while safety sensors ensure enhanced safety in manufacturing processes. Edge computing and cloud computing are transforming the industry by enabling real-time data processing and analysis, leading to improved quality and system integration.
    • Three-dimensional vision and artificial intelligence are also gaining traction, offering new possibilities for automation and safety. Supply chain management is being revolutionized through the use of photoelectric sensors, leading to streamlined operations and optimized workflows. Overall, the market is witnessing a shift towards more intelligent, connected, and efficient solutions.

    Dive into Technavio’s robust research methodology, blending expert interviews, extensive data synthesis, and validated models for unparalleled Photoelectric Sensors Market insights. See full methodology.

    Market Scope

    Report Coverage

    Details

    Page number

    226

    Base year

    2024

    Historic period

    2019-2023

    Forecast period

    2025-2029

    Growth momentum & CAGR

    Accelerate at a CAGR of 8.6%

    Market growth 2025-2029

    USD 1006.1 million

    Market structure

    Fragmented

    YoY growth 2024-2025(%)

    7.8

    Key countries

    US, China, Germany, Japan, UK, France, India, South Korea, Italy, and Canada

    Competitive landscape

    Leading Companies, Market Positioning of Companies, Competitive Strategies, and Industry Risks

    Request Free Sample

    What are the Key Data Covered in this Photoelectric Sensors Market Research and Growth Report?

    • CAGR of the Photoelectric Sensors industry during the forecast period
    • Detailed information on factors that will drive the growth and forecasting between 2025 and 2029
    • Precise estimation of the size of the market and its contribution of the industry in focus to the parent market
    • Accurate predictions about upcoming growth and trends and changes in consumer behaviour
    • Growth of the market across APAC, Europe, North America, Middle East and Africa, and South America
    • Thorough analysis of the market’s competitive landscape and detailed information about companies
    • Comprehensive analysis of factors that will challenge the photoelectric sensors market growth of industry companies

    We can help! Our analysts can customize this photoelectric sensors market research report to meet your requirements.

    Get in touch


    1 Executive Summary

    • 1.1 Market overview
      • Executive Summary - Chart on Market Overview
      • Executive Summary - Data Table on Market Overview
      • Executive Summary - Chart on Global Market Characteristics
      • Executive Summary - Chart on Market by Geography
      • Executive Summary - Chart on Market Segmentation by Type
      • Executive Summary - Chart on Market Segmentation by End-user
      • Executive Summary - Chart on Market Segmentation by Product
      • Executive Summary - Chart on Market Segmentation by Application
      • Executive Summary - Chart on Incremental Growth
      • Executive Summary - Data Table on Incremental Growth
      • Executive Summary - Chart on Company Market Positioning

    2 Technavio Analysis

    • 2.1 Analysis of price sensitivity, lifecycle, customer purchase basket, adoption rates, and purchase criteria
      • Analysis of price sensitivity, lifecycle, customer purchase basket, adoption rates, and purchase criteria
    • 2.2 Criticality of inputs and Factors of differentiation
      • Overview on criticality of inputs and factors of differentiation
    • 2.3 Factors of disruption
      • Overview on factors of disruption
    • 2.4 Impact of drivers and challenges
      • Impact of drivers and challenges in 2024 and 2029

    3 Market Landscape

    • 3.1 Market ecosystem
      • Parent Market
      • Data Table on - Parent Market
    • 3.2 Market characteristics
      • Market characteristics analysis
    • 3.3 Value chain analysis
      • Value chain analysis

    4 Market Sizing

    • 4.1 Market definition
      • Offerings of companies included in the market definition
    • 4.2 Market segment analysis
      • Market segments
    • 4.3 Market size 2024
      • 4.4 Market outlook: Forecast for 2024-2029
        • Chart on Global - Market size and forecast 2024-2029 ($ million)
        • Data Table on Global - Market size and forecast 2024-2029 ($ million)
        • Chart on Global Market: Year-over-year growth 2024-2029 (%)
        • Data Table on Global Market: Year-over-year growth 2024-2029 (%)

      5 Historic Market Size

      • 5.1 Global Photoelectric Sensors Market 2019 - 2023
        • Historic Market Size - Data Table on Global Photoelectric Sensors Market 2019 - 2023 ($ million)
      • 5.2 Type segment analysis 2019 - 2023
        • Historic Market Size - Type Segment 2019 - 2023 ($ million)
      • 5.3 End-user segment analysis 2019 - 2023
        • Historic Market Size - End-user Segment 2019 - 2023 ($ million)
      • 5.4 Product segment analysis 2019 - 2023
        • Historic Market Size - Product Segment 2019 - 2023 ($ million)
      • 5.5 Application segment analysis 2019 - 2023
        • Historic Market Size - Application Segment 2019 - 2023 ($ million)
      • 5.6 Geography segment analysis 2019 - 2023
        • Historic Market Size - Geography Segment 2019 - 2023 ($ million)
      • 5.7 Country segment analysis 2019 - 2023
        • Historic Market Size - Country Segment 2019 - 2023 ($ million)

      6 Qualitative Analysis

      • 6.1 Impact of AI on global photoelectric sensors market

        7 Five Forces Analysis

        • 7.1 Five forces summary
          • Five forces analysis - Comparison between 2024 and 2029
        • 7.2 Bargaining power of buyers
          • Bargaining power of buyers - Impact of key factors 2024 and 2029
        • 7.3 Bargaining power of suppliers
          • Bargaining power of suppliers - Impact of key factors in 2024 and 2029
        • 7.4 Threat of new entrants
          • Threat of new entrants - Impact of key factors in 2024 and 2029
        • 7.5 Threat of substitutes
          • Threat of substitutes - Impact of key factors in 2024 and 2029
        • 7.6 Threat of rivalry
          • Threat of rivalry - Impact of key factors in 2024 and 2029
        • 7.7 Market condition
          • Chart on Market condition - Five forces 2024 and 2029

        8 Market Segmentation by Type

        • 8.1 Market segments
          • Chart on Type - Market share (2024-2029) (%)
          • Data Table on Type - Market share (2024-2029) (%)
        • 8.2 Comparison by Type
          • Chart on Comparison by Type
          • Data Table on Comparison by Type
        • 8.3 Laser photoelectric sensor - Market size and forecast (2024-2029)
          • Chart on Laser photoelectric sensor - Market size and forecast (2024-2029) ($ million)
          • Data Table on Laser photoelectric sensor - Market size and forecast (2024-2029) ($ million)
          • Chart on Laser photoelectric sensor - Year-over-year growth (2024-2029) (%)
          • Data Table on Laser photoelectric sensor - Year-over-year growth (2024-2029) (%)
        • 8.4 Fiber photoelectric sensor - Market size and forecast (2024-2029)
          • Chart on Fiber photoelectric sensor - Market size and forecast (2024-2029) ($ million)
          • Data Table on Fiber photoelectric sensor - Market size and forecast (2024-2029) ($ million)
          • Chart on Fiber photoelectric sensor - Year-over-year growth (2024-2029) (%)
          • Data Table on Fiber photoelectric sensor - Year-over-year growth (2024-2029) (%)
        • 8.5 Market opportunity by Type
          • Market opportunity by Type ($ million)
          • Data Table on Market opportunity by Type ($ million)

        9 Market Segmentation by End-user

        • 9.1 Market segments
          • Chart on End-user - Market share (2024-2029) (%)
          • Data Table on End-user - Market share (2024-2029) (%)
        • 9.2 Comparison by End-user
          • Chart on Comparison by End-user
          • Data Table on Comparison by End-user
        • 9.3 Automotive - Market size and forecast (2024-2029)
          • Chart on Automotive - Market size and forecast (2024-2029) ($ million)
          • Data Table on Automotive - Market size and forecast (2024-2029) ($ million)
          • Chart on Automotive - Year-over-year growth (2024-2029) (%)
          • Data Table on Automotive - Year-over-year growth (2024-2029) (%)
        • 9.4 Consumer electronics - Market size and forecast (2024-2029)
          • Chart on Consumer electronics - Market size and forecast (2024-2029) ($ million)
          • Data Table on Consumer electronics - Market size and forecast (2024-2029) ($ million)
          • Chart on Consumer electronics - Year-over-year growth (2024-2029) (%)
          • Data Table on Consumer electronics - Year-over-year growth (2024-2029) (%)
        • 9.5 Building automation - Market size and forecast (2024-2029)
          • Chart on Building automation - Market size and forecast (2024-2029) ($ million)
          • Data Table on Building automation - Market size and forecast (2024-2029) ($ million)
          • Chart on Building automation - Year-over-year growth (2024-2029) (%)
          • Data Table on Building automation - Year-over-year growth (2024-2029) (%)
        • 9.6 Others - Market size and forecast (2024-2029)
          • Chart on Others - Market size and forecast (2024-2029) ($ million)
          • Data Table on Others - Market size and forecast (2024-2029) ($ million)
          • Chart on Others - Year-over-year growth (2024-2029) (%)
          • Data Table on Others - Year-over-year growth (2024-2029) (%)
        • 9.7 Market opportunity by End-user
          • Market opportunity by End-user ($ million)
          • Data Table on Market opportunity by End-user ($ million)

        10 Market Segmentation by Product

        • 10.1 Market segments
          • Chart on Product - Market share (2024-2029) (%)
          • Data Table on Product - Market share (2024-2029) (%)
        • 10.2 Comparison by Product
          • Chart on Comparison by Product
          • Data Table on Comparison by Product
        • 10.3 Retroreflective - Market size and forecast (2024-2029)
          • Chart on Retroreflective - Market size and forecast (2024-2029) ($ million)
          • Data Table on Retroreflective - Market size and forecast (2024-2029) ($ million)
          • Chart on Retroreflective - Year-over-year growth (2024-2029) (%)
          • Data Table on Retroreflective - Year-over-year growth (2024-2029) (%)
        • 10.4 Diffuse - Market size and forecast (2024-2029)
          • Chart on Diffuse - Market size and forecast (2024-2029) ($ million)
          • Data Table on Diffuse - Market size and forecast (2024-2029) ($ million)
          • Chart on Diffuse - Year-over-year growth (2024-2029) (%)
          • Data Table on Diffuse - Year-over-year growth (2024-2029) (%)
        • 10.5 Through-beam - Market size and forecast (2024-2029)
          • Chart on Through-beam - Market size and forecast (2024-2029) ($ million)
          • Data Table on Through-beam - Market size and forecast (2024-2029) ($ million)
          • Chart on Through-beam - Year-over-year growth (2024-2029) (%)
          • Data Table on Through-beam - Year-over-year growth (2024-2029) (%)
        • 10.6 Market opportunity by Product
          • Market opportunity by Product ($ million)
          • Data Table on Market opportunity by Product ($ million)

        11 Market Segmentation by Application

        • 11.1 Market segments
          • Chart on Application - Market share (2024-2029) (%)
          • Data Table on Application - Market share (2024-2029) (%)
        • 11.2 Comparison by Application
          • Chart on Comparison by Application
          • Data Table on Comparison by Application
        • 11.3 Object detection - Market size and forecast (2024-2029)
          • Chart on Object detection - Market size and forecast (2024-2029) ($ million)
          • Data Table on Object detection - Market size and forecast (2024-2029) ($ million)
          • Chart on Object detection - Year-over-year growth (2024-2029) (%)
          • Data Table on Object detection - Year-over-year growth (2024-2029) (%)
        • 11.4 Positioning - Market size and forecast (2024-2029)
          • Chart on Positioning - Market size and forecast (2024-2029) ($ million)
          • Data Table on Positioning - Market size and forecast (2024-2029) ($ million)
          • Chart on Positioning - Year-over-year growth (2024-2029) (%)
          • Data Table on Positioning - Year-over-year growth (2024-2029) (%)
        • 11.5 Safety and security - Market size and forecast (2024-2029)
          • Chart on Safety and security - Market size and forecast (2024-2029) ($ million)
          • Data Table on Safety and security - Market size and forecast (2024-2029) ($ million)
          • Chart on Safety and security - Year-over-year growth (2024-2029) (%)
          • Data Table on Safety and security - Year-over-year growth (2024-2029) (%)
        • 11.6 Counting - Market size and forecast (2024-2029)
          • Chart on Counting - Market size and forecast (2024-2029) ($ million)
          • Data Table on Counting - Market size and forecast (2024-2029) ($ million)
          • Chart on Counting - Year-over-year growth (2024-2029) (%)
          • Data Table on Counting - Year-over-year growth (2024-2029) (%)
        • 11.7 Market opportunity by Application
          • Market opportunity by Application ($ million)
          • Data Table on Market opportunity by Application ($ million)

        12 Customer Landscape

        • 12.1 Customer landscape overview
          • Analysis of price sensitivity, lifecycle, customer purchase basket, adoption rates, and purchase criteria

        13 Geographic Landscape

        • 13.1 Geographic segmentation
          • Chart on Market share by geography 2024-2029 (%)
          • Data Table on Market share by geography 2024-2029 (%)
        • 13.2 Geographic comparison
          • Chart on Geographic comparison
          • Data Table on Geographic comparison
        • 13.3 APAC - Market size and forecast 2024-2029
          • Chart on APAC - Market size and forecast 2024-2029 ($ million)
          • Data Table on APAC - Market size and forecast 2024-2029 ($ million)
          • Chart on APAC - Year-over-year growth 2024-2029 (%)
          • Data Table on APAC - Year-over-year growth 2024-2029 (%)
        • 13.4 Europe - Market size and forecast 2024-2029
          • Chart on Europe - Market size and forecast 2024-2029 ($ million)
          • Data Table on Europe - Market size and forecast 2024-2029 ($ million)
          • Chart on Europe - Year-over-year growth 2024-2029 (%)
          • Data Table on Europe - Year-over-year growth 2024-2029 (%)
        • 13.5 North America - Market size and forecast 2024-2029
          • Chart on North America - Market size and forecast 2024-2029 ($ million)
          • Data Table on North America - Market size and forecast 2024-2029 ($ million)
          • Chart on North America - Year-over-year growth 2024-2029 (%)
          • Data Table on North America - Year-over-year growth 2024-2029 (%)
        • 13.6 Middle East and Africa - Market size and forecast 2024-2029
          • Chart on Middle East and Africa - Market size and forecast 2024-2029 ($ million)
          • Data Table on Middle East and Africa - Market size and forecast 2024-2029 ($ million)
          • Chart on Middle East and Africa - Year-over-year growth 2024-2029 (%)
          • Data Table on Middle East and Africa - Year-over-year growth 2024-2029 (%)
        • 13.7 South America - Market size and forecast 2024-2029
          • Chart on South America - Market size and forecast 2024-2029 ($ million)
          • Data Table on South America - Market size and forecast 2024-2029 ($ million)
          • Chart on South America - Year-over-year growth 2024-2029 (%)
          • Data Table on South America - Year-over-year growth 2024-2029 (%)
        • 13.8 US - Market size and forecast 2024-2029
          • Chart on US - Market size and forecast 2024-2029 ($ million)
          • Data Table on US - Market size and forecast 2024-2029 ($ million)
          • Chart on US - Year-over-year growth 2024-2029 (%)
          • Data Table on US - Year-over-year growth 2024-2029 (%)
        • 13.9 China - Market size and forecast 2024-2029
          • Chart on China - Market size and forecast 2024-2029 ($ million)
          • Data Table on China - Market size and forecast 2024-2029 ($ million)
          • Chart on China - Year-over-year growth 2024-2029 (%)
          • Data Table on China - Year-over-year growth 2024-2029 (%)
        • 13.10 Germany - Market size and forecast 2024-2029
          • Chart on Germany - Market size and forecast 2024-2029 ($ million)
          • Data Table on Germany - Market size and forecast 2024-2029 ($ million)
          • Chart on Germany - Year-over-year growth 2024-2029 (%)
          • Data Table on Germany - Year-over-year growth 2024-2029 (%)
        • 13.11 Japan - Market size and forecast 2024-2029
          • Chart on Japan - Market size and forecast 2024-2029 ($ million)
          • Data Table on Japan - Market size and forecast 2024-2029 ($ million)
          • Chart on Japan - Year-over-year growth 2024-2029 (%)
          • Data Table on Japan - Year-over-year growth 2024-2029 (%)
        • 13.12 UK - Market size and forecast 2024-2029
          • Chart on UK - Market size and forecast 2024-2029 ($ million)
          • Data Table on UK - Market size and forecast 2024-2029 ($ million)
          • Chart on UK - Year-over-year growth 2024-2029 (%)
          • Data Table on UK - Year-over-year growth 2024-2029 (%)
        • 13.13 India - Market size and forecast 2024-2029
          • Chart on India - Market size and forecast 2024-2029 ($ million)
          • Data Table on India - Market size and forecast 2024-2029 ($ million)
          • Chart on India - Year-over-year growth 2024-2029 (%)
          • Data Table on India - Year-over-year growth 2024-2029 (%)
        • 13.14 South Korea - Market size and forecast 2024-2029
          • Chart on South Korea - Market size and forecast 2024-2029 ($ million)
          • Data Table on South Korea - Market size and forecast 2024-2029 ($ million)
          • Chart on South Korea - Year-over-year growth 2024-2029 (%)
          • Data Table on South Korea - Year-over-year growth 2024-2029 (%)
        • 13.15 France - Market size and forecast 2024-2029
          • Chart on France - Market size and forecast 2024-2029 ($ million)
          • Data Table on France - Market size and forecast 2024-2029 ($ million)
          • Chart on France - Year-over-year growth 2024-2029 (%)
          • Data Table on France - Year-over-year growth 2024-2029 (%)
        • 13.16 Italy - Market size and forecast 2024-2029
          • Chart on Italy - Market size and forecast 2024-2029 ($ million)
          • Data Table on Italy - Market size and forecast 2024-2029 ($ million)
          • Chart on Italy - Year-over-year growth 2024-2029 (%)
          • Data Table on Italy - Year-over-year growth 2024-2029 (%)
        • 13.17 Canada - Market size and forecast 2024-2029
          • Chart on Canada - Market size and forecast 2024-2029 ($ million)
          • Data Table on Canada - Market size and forecast 2024-2029 ($ million)
          • Chart on Canada - Year-over-year growth 2024-2029 (%)
          • Data Table on Canada - Year-over-year growth 2024-2029 (%)
        • 13.18 Market opportunity by geography
          • Market opportunity by geography ($ million)
          • Data Tables on Market opportunity by geography ($ million)
        • 13.19 Rest of World (ROW) - Market size and forecast (2024-2029)
          • Chart on Rest of World (ROW) - Market size and forecast (2024-2029) ($ million)
          • Data Table on Rest of World (ROW) - Market size and forecast (2024-2029) ($ million)
          • Chart on Rest of World (ROW) - Year-over-year growth (2024-2029) (%)
          • Data Table on Rest of World (ROW) - Year-over-year growth (2024-2029) (%)

        14 Drivers, Challenges, and Opportunity/Restraints

        • 14.1 Market drivers
          • 14.2 Market challenges
            • 14.3 Impact of drivers and challenges
              • Impact of drivers and challenges in 2024 and 2029
            • 14.4 Market opportunities/restraints

              15 Competitive Landscape

              • 15.1 Overview
                • 15.2 Competitive Landscape
                  • Overview on criticality of inputs and factors of differentiation
                • 15.3 Landscape disruption
                  • Overview on factors of disruption
                • 15.4 Industry risks
                  • Impact of key risks on business

                16 Competitive Analysis

                • 16.1 Companies profiled
                  • Companies covered
                • 16.2 Market positioning of companies
                  • Matrix on companies position and classification
                • 16.3 Autonics Corporation
                  • Autonics Corporation - Overview
                  • Autonics Corporation - Product / Service
                  • Autonics Corporation - Key offerings
                • 16.4 Balluff GmbH
                  • Balluff GmbH - Overview
                  • Balluff GmbH - Product / Service
                  • Balluff GmbH - Key offerings
                • 16.5 Banner Engineering Corp
                  • Banner Engineering Corp - Overview
                  • Banner Engineering Corp - Product / Service
                  • Banner Engineering Corp - Key offerings
                • 16.6 Baumer Group
                  • Baumer Group - Overview
                  • Baumer Group - Product / Service
                  • Baumer Group - Key offerings
                • 16.7 Carlo Gavazzi Holding AG
                  • Carlo Gavazzi Holding AG - Overview
                  • Carlo Gavazzi Holding AG - Product / Service
                  • Carlo Gavazzi Holding AG - Key offerings
                • 16.8 Eaton Corporation PLC
                  • Eaton Corporation PLC - Overview
                  • Eaton Corporation PLC - Product / Service
                  • Eaton Corporation PLC - Key offerings
                • 16.9 Hans Turck GmbH & Co. KG
                  • Hans Turck GmbH & Co. KG - Overview
                  • Hans Turck GmbH & Co. KG - Product / Service
                  • Hans Turck GmbH & Co. KG - Key offerings
                • 16.10 IFM Electronic GmbH
                  • IFM Electronic GmbH - Overview
                  • IFM Electronic GmbH - Product / Service
                  • IFM Electronic GmbH - Key offerings
                • 16.11 Keyence Corporation
                  • Keyence Corporation - Overview
                  • Keyence Corporation - Product / Service
                  • Keyence Corporation - Key offerings
                • 16.12 Leuze Electronic GmbH + Co. KG
                  • Leuze Electronic GmbH + Co. KG - Overview
                  • Leuze Electronic GmbH + Co. KG - Product / Service
                  • Leuze Electronic GmbH + Co. KG - Key offerings
                • 16.13 Omron Corporation
                  • Omron Corporation - Overview
                  • Omron Corporation - Product / Service
                  • Omron Corporation - Key offerings
                • 16.14 Panasonic Corporation
                  • Panasonic Corporation - Overview
                  • Panasonic Corporation - Product / Service
                  • Panasonic Corporation - Key offerings
                • 16.15 Pepperl+Fuchs SE
                  • Pepperl+Fuchs SE - Overview
                  • Pepperl+Fuchs SE - Product / Service
                  • Pepperl+Fuchs SE - Key offerings
                • 16.16 Rockwell Automation Inc.
                  • Rockwell Automation Inc. - Overview
                  • Rockwell Automation Inc. - Product / Service
                  • Rockwell Automation Inc. - Key offerings
                • 16.17 Schneider Electric SE
                  • Schneider Electric SE - Overview
                  • Schneider Electric SE - Product / Service
                  • Schneider Electric SE - Key offerings
                • 16.18 SICK AG
                  • SICK AG - Overview
                  • SICK AG - Product / Service
                  • SICK AG - Key offerings
                • 16.19 Takex Limited
                  • Takex Limited - Overview
                  • Takex Limited - Product / Service
                  • Takex Limited - Key offerings
                • 16.20 Telemecanique Sensors
                  • Telemecanique Sensors - Overview
                  • Telemecanique Sensors - Product / Service
                  • Telemecanique Sensors - Key offerings
                • 16.21 Wenglor Sensoric GmbH
                  • Wenglor Sensoric GmbH - Overview
                  • Wenglor Sensoric GmbH - Product / Service
                  • Wenglor Sensoric GmbH - Key offerings
                • 16.22 Yamatake Corporation
                  • Yamatake Corporation - Overview
                  • Yamatake Corporation - Product / Service
                  • Yamatake Corporation - Key offerings
                • 16.23 Autonics Corp.
                  • Autonics Corp. - Overview
                  • Autonics Corp. - Product / Service
                  • Autonics Corp. - Key offerings
                • 16.24 Balluff GmbH
                  • Balluff GmbH - Overview
                  • Balluff GmbH - Product / Service
                  • Balluff GmbH - Key offerings
                • 16.25 Banner Engineering Corp.
                  • Banner Engineering Corp. - Overview
                  • Banner Engineering Corp. - Product / Service
                  • Banner Engineering Corp. - Key offerings
                • 16.26 Baumer Holding AG
                  • Baumer Holding AG - Overview
                  • Baumer Holding AG - Product / Service
                  • Baumer Holding AG - Key offerings
                • 16.27 Broadcom Inc.
                  • Broadcom Inc. - Overview
                  • Broadcom Inc. - Product / Service
                  • Broadcom Inc. - Key offerings
                • 16.28 Delta Electronics Inc.
                  • Delta Electronics Inc. - Overview
                  • Delta Electronics Inc. - Product / Service
                  • Delta Electronics Inc. - Key offerings
                • 16.29 Eaton Corp. plc
                  • Eaton Corp. plc - Overview
                  • Eaton Corp. plc - Product / Service
                  • Eaton Corp. plc - Key offerings
                • 16.30 Hans Turck GmbH and Co. KG
                  • Hans Turck GmbH and Co. KG - Overview
                  • Hans Turck GmbH and Co. KG - Product / Service
                  • Hans Turck GmbH and Co. KG - Key offerings
                • 16.31 ifm electronic gmbh
                  • ifm electronic gmbh - Overview
                  • ifm electronic gmbh - Product / Service
                  • ifm electronic gmbh - Key offerings
                • 16.32 Keyence Corp.
                  • Keyence Corp. - Overview
                  • Keyence Corp. - Product / Service
                  • Keyence Corp. - Key offerings
                • 16.33 Leuze
                  • Leuze - Overview
                  • Leuze - Product / Service
                  • Leuze - Key offerings
                • 16.34 OMRON Corp.
                  • OMRON Corp. - Overview
                  • OMRON Corp. - Product / Service
                  • OMRON Corp. - Key offerings
                • 16.35 Panasonic Holdings Corp.
                  • Panasonic Holdings Corp. - Overview
                  • Panasonic Holdings Corp. - Product / Service
                  • Panasonic Holdings Corp. - Key offerings
                • 16.36 Pepperl and Fuchs SE
                  • Pepperl and Fuchs SE - Overview
                  • Pepperl and Fuchs SE - Product / Service
                  • Pepperl and Fuchs SE - Key offerings
                • 16.37 Rockwell Automation Inc.
                  • Rockwell Automation Inc. - Overview
                  • Rockwell Automation Inc. - Product / Service
                  • Rockwell Automation Inc. - Key offerings
                • 16.38 Schneider Electric SE
                  • Schneider Electric SE - Overview
                  • Schneider Electric SE - Product / Service
                  • Schneider Electric SE - Key offerings
                • 16.39 SICK AG
                  • SICK AG - Overview
                  • SICK AG - Product / Service
                  • SICK AG - Key offerings
                • 16.40 Tri Tronics Co. Inc.
                  • Tri Tronics Co. Inc. - Overview
                  • Tri Tronics Co. Inc. - Product / Service
                  • Tri Tronics Co. Inc. - Key offerings
                • 16.41 wenglor sensoric GmbH
                  • wenglor sensoric GmbH - Overview
                  • wenglor sensoric GmbH - Product / Service
                  • wenglor sensoric GmbH - Key offerings

                17 Appendix

                • 17.1 Scope of the report
                  • 17.2 Inclusions and exclusions checklist
                    • Inclusions checklist
                    • Exclusions checklist
                  • 17.3 Currency conversion rates for US$
                    • Currency conversion rates for US$
                  • 17.4 Research methodology
                    • Research methodology
                  • 17.5 Data procurement
                    • Information sources
                  • 17.6 Data validation
                    • Data validation
                  • 17.7 Validation techniques employed for market sizing
                    • Validation techniques employed for market sizing
                  • 17.8 Data synthesis
                    • Data synthesis
                  • 17.9 360 degree market analysis
                    • 360 degree market analysis
                  • 17.10 List of abbreviations
                    • List of abbreviations

                  Research Methodology

                  Technavio presents a detailed picture of the market by way of study, synthesis, and summation of data from multiple sources. The analysts have presented the various facets of the market with a particular focus on identifying the key industry influencers. The data thus presented is comprehensive, reliable, and the result of extensive research, both primary and secondary.

                  INFORMATION SOURCES

                  Primary sources

                  • Manufacturers and suppliers
                  • Channel partners
                  • Industry experts
                  • Strategic decision makers

                  Secondary sources

                  • Industry journals and periodicals
                  • Government data
                  • Financial reports of key industry players
                  • Historical data
                  • Press releases

                  DATA ANALYSIS

                  Data Synthesis

                  • Collation of data
                  • Estimation of key figures
                  • Analysis of derived insights

                  Data Validation

                  • Triangulation with data models
                  • Reference against proprietary databases
                  • Corroboration with industry experts

                  REPORT WRITING

                  Qualitative

                  • Market drivers
                  • Market challenges
                  • Market trends
                  • Five forces analysis

                  Quantitative

                  • Market size and forecast
                  • Market segmentation
                  • Geographical insights
                  • Competitive landscape

                  Interested in this report?

                  Get your sample now to see our research methodology and insights!

                  Download Now

                  Frequently Asked Questions

                  Photoelectric Sensors market growth will increase by $ 1006.1 mn during 2025-2029.

                  The Photoelectric Sensors market is expected to grow at a CAGR of 8.6% during 2025-2029.

                  Photoelectric Sensors market is segmented by Type( Laser photoelectric sensor, Fiber photoelectric sensor) End-user( Automotive, Consumer electronics, Building automation, Others) Product( Retroreflective, Diffuse, Through-beam, Middle East and Africa, South America)

                  Autonics Corporation, Balluff GmbH, Banner Engineering Corp, Baumer Group, Carlo Gavazzi Holding AG, Eaton Corporation PLC, Hans Turck GmbH & Co. KG, IFM Electronic GmbH, Keyence Corporation, Leuze Electronic GmbH + Co. KG, Omron Corporation, Panasonic Corporation, Pepperl+Fuchs SE, Rockwell Automation Inc., Schneider Electric SE, SICK AG, Takex Limited, Telemecanique Sensors, Wenglor Sensoric GmbH, Yamatake Corporation are a few of the key vendors in the Photoelectric Sensors market.

                  APAC will register the highest growth rate of 45% among the other regions. Therefore, the Photoelectric Sensors market in APAC is expected to garner significant business opportunities for the vendors during the forecast period.

                  US, China, Germany, Japan, UK, France, India, South Korea, Italy, Canada

                  • Increasing adoption of industry 4.0 practices and automationThe adoption of Industry 4.0 practices and an increased emphasis on automation are important drivers of demand for photoelectric sensors in the global photoelectric sensors market. Industry 4.0 is the driving factor this market.
                  • which integrates digital technologies into manufacturing processes is the driving factor this market.
                  • has resulted in a paradigm shift toward smart and networked industrial systems. In this context is the driving factor this market.
                  • photoelectric sensors are critical in providing precise and efficient item detection in automated procedures.Photoelectric sensors use light-based technology to detect the presence is the driving factor this market.
                  • absence is the driving factor this market.
                  • and distance of objects is the driving factor this market.
                  • making them indispensable in automation. As enterprises adopt smart manufacturing processes is the driving factor this market.
                  • there is an increased demand for real-time data collection and precise control in automated systems. Photoelectric sensors enable these requirements by offering reliable and speedy object detection capabilities is the driving factor this market.
                  • which ensure the smooth running of automated machinery and systems. Photoelectric sensors are used in industries such as automotive is the driving factor this market.
                  • aerospace is the driving factor this market.
                  • and logistics to detect parts is the driving factor this market.
                  • control quality is the driving factor this market.
                  • and automate conveyor belts. The sensors help to improve operating efficiency is the driving factor this market.
                  • minimize errors is the driving factor this market.
                  • and increase manufacturing throughput. As the global demand for seamless integration of automation technologies grows is the driving factor this market.
                  • the global photoelectric sensors market is positioned for long-term growth during the forecast period is the driving factor this market.
                  • driven by its critical role in assuring precision and accuracy in Industry 4.0-driven automated processes. is the driving factor this market.

                  The Photoelectric Sensors market vendors should focus on grabbing business opportunities from the Laser photoelectric sensor segment as it accounted for the largest market share in the base year.