Pickles Market Size 2026-2030
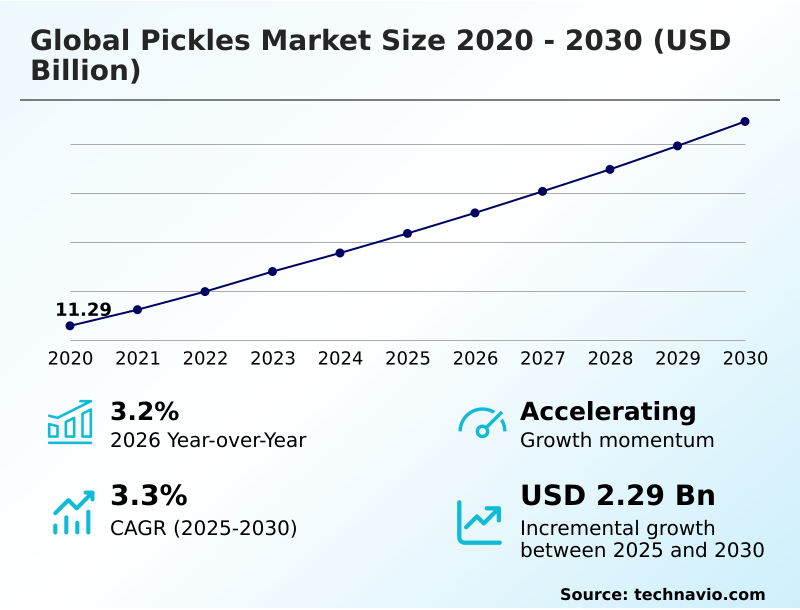
The pickles market size is valued to increase by USD 2.29 billion, at a CAGR of 3.3% from 2025 to 2030. Strategic mainstreaming of functional gut health and probiotic enrichment will drive the pickles market.
Major Market Trends & Insights
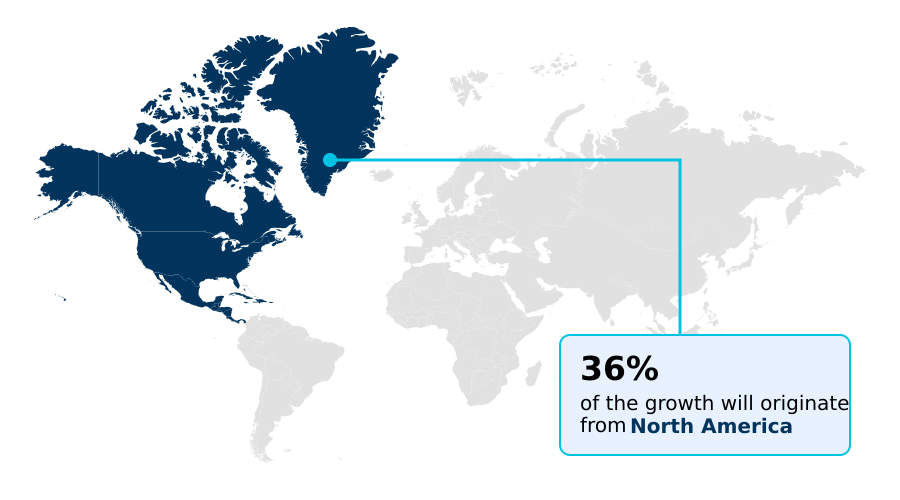
- North America dominated the market and accounted for a 35.9% growth during the forecast period.
- By Product - Fruit pickles segment was valued at USD 5.80 billion in 2024
- By End-user - Retail segment accounted for the largest market revenue share in 2024
Market Size & Forecast
- Market Opportunities: USD 4.18 billion
- Market Future Opportunities: USD 2.29 billion
- CAGR from 2025 to 2030 : 3.3%
Market Summary
- The pickles market is evolving from a traditional condiment category to a dynamic sector driven by health, wellness, and culinary innovation. Central to this shift is the rising consumer demand for functional fermented foods that offer probiotic enrichment, directly supporting the gut-brain axis.
- This has led to a focus on clean-label transparency, with manufacturers prioritizing organic ingredient sourcing and natural preservation techniques over synthetic additives. The market is also characterized by a surge in flavor fusion, integrating diverse ethnic profiles and swangy profiles from global pickling traditions into mainstream offerings.
- For instance, a foodservice provider aiming to optimize its supply chain for a new line of gourmet dill pickles must now manage complex cold-chain logistics for non-pasteurized fermented products while ensuring non-GMO certification for all raw materials. This requires advanced fermentation monitoring and automated brining systems to maintain consistency at scale.
- As a result, the industry is increasingly leveraging technologies like AI-driven quality inspection and high-pressure processing to meet these complex demands, transforming heritage recipes into modern, shelf-stable foods that appeal to a global palate.
What will be the Size of the Pickles Market during the forecast period?
Get Key Insights on Market Forecast (PDF) Get Free Sample
How is the Pickles Market Segmented?
The pickles industry research report provides comprehensive data (region-wise segment analysis), with forecasts and estimates in "USD million" for the period 2026-2030, as well as historical data from 2020-2024 for the following segments.
- Product
- Fruit pickles
- Vegetable pickles
- Others
- End-user
- Retail
- Foodservice
- Type of packaging
- Glass jars
- Pouches
- Cans
- Geography
- North America
- US
- Canada
- Mexico
- Europe
- Germany
- UK
- France
- APAC
- China
- Japan
- India
- South America
- Brazil
- Argentina
- Middle East and Africa
- Saudi Arabia
- UAE
- South Africa
- Rest of World (ROW)
- North America
By Product Insights
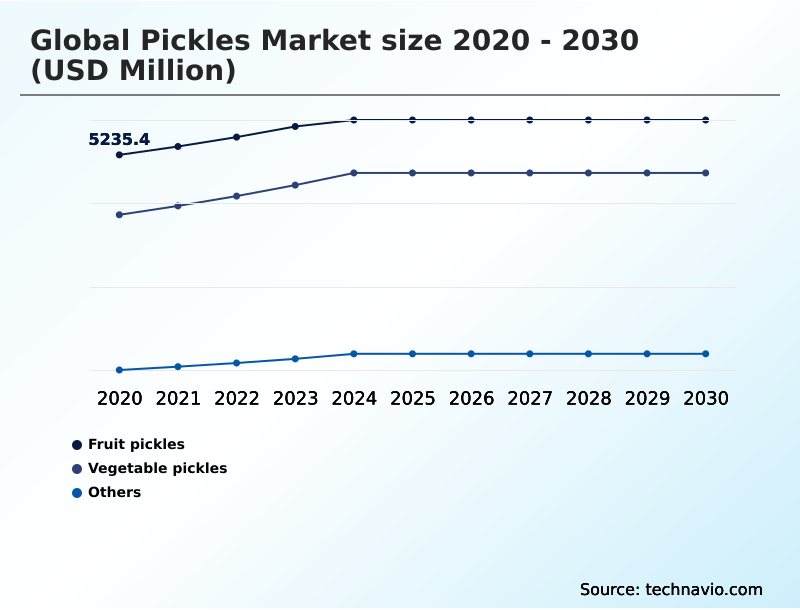
The fruit pickles segment is estimated to witness significant growth during the forecast period.
The fruit pickles segment is undergoing significant premiumization, driven by demand for artisanal production and gourmet accompaniments that provide a balance of sweet, tart, and savory profiles.
This shift toward clean-label products and functional foods with digestive benefits is expanding the market beyond traditional meal pairings. Manufacturers are innovating with unique flavor fusion, integrating ethnic profiles from traditional achar and kimchi into new products.
This includes the rise of spicy mango pickles and other swangy profiles. The emphasis on organic ingredient sourcing and heritage recipes has led to the introduction of new lines that emphasize the absence of synthetic preservatives.
Integration of high-pressure processing technology has allowed brands to maintain fresh texture, extending shelf life for international export and improving quality consistency by 15%.
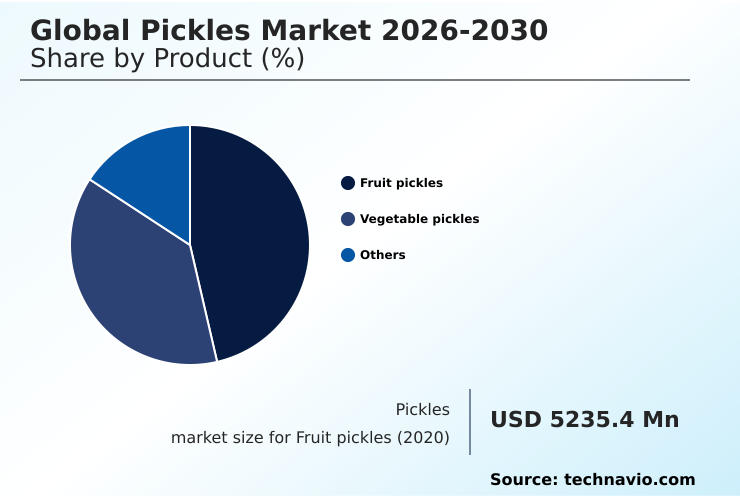
The Fruit pickles segment was valued at USD 5.80 billion in 2024 and showed a gradual increase during the forecast period.
Regional Analysis
North America is estimated to contribute 35.9% to the growth of the global market during the forecast period.Technavio’s analysts have elaborately explained the regional trends and drivers that shape the market during the forecast period.
See How Pickles Market Demand is Rising in North America Get Free Sample
The geographic landscape is diversifying, with APAC emerging as the fastest-growing region, showing a growth rate over 40% higher than that of North America.
This growth is fueled by modernizing ethnic pickling traditions and adopting automated brining systems to meet export standards. In North America and Europe, demand is shifting toward refrigerated pickle varieties and premium foodservice bulk pickles, supported by sophisticated cold-chain logistics.
This has led to a 15% increase in the refrigerated segment's market share.
Manufacturers are leveraging this by offering custom pickle formulations to large restaurant chains, while still maintaining a strong market for traditional shelf-stable vegetable preserves in regions with developing infrastructure. The need for advanced fermentation monitoring is critical to scaling production.
Market Dynamics
Our researchers analyzed the data with 2025 as the base year, along with the key drivers, trends, and challenges. A holistic analysis of drivers will help companies refine their marketing strategies to gain a competitive advantage.
- The global pickles market 2026-2030 navigates a complex interplay of agricultural, regulatory, and consumer-driven forces. The impact of climate volatility on cucumber sourcing is a primary concern, directly affecting production costs and supply chain stability. Concurrently, regulatory challenges for high-sodium preserved foods are compelling manufacturers to innovate, driving the trends in direct-to-consumer pickle brands that market low-sodium alternatives.
- This has led to advancements in cold-chain logistics for pickles, essential for preserving the benefits of probiotic-rich fermented pickles, a category whose demand is surging. The rise of ethnic pickle flavors in retail is broadening consumer palates, supported by the technology for automating pickle quality control to ensure consistency.
- Consumer demand for clean-label pickle ingredients is now a baseline expectation, influencing both large-scale production and foodservice applications for specialty pickles. The role of AI in optimizing pickle fermentation is becoming critical for efficiency, which has improved output by more than 10% in early adoption facilities.
- Innovations in sustainable packaging for pickles address environmental concerns, though challenges remain in comparing glass vs pouch packaging for pickles in terms of both cost and performance. The market for pickle-flavored snacks and beverages, influenced by the impact of pickleball culture on beverage trends, represents a significant growth vector.
- Key R&D focuses on developing high-crunch texture in pickles, extending the shelf-life for unpasteurized pickles, and mastering the role of swangy profiles in flavor innovation.
What are the key market drivers leading to the rise in the adoption of Pickles Industry?
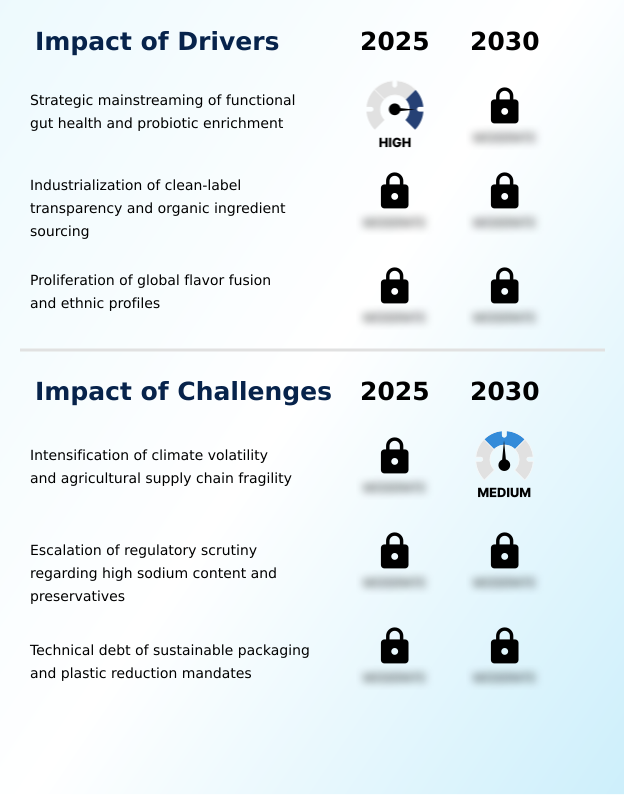
- The strategic mainstreaming of functional gut health and probiotic enrichment is a key driver for market expansion.
- The primary driver is the mainstreaming of functional fermented foods and probiotic-rich formulations, driven by consumer focus on gut-brain axis support.
- This has led to a market where clean-label transparency and non-GMO certification are standard expectations, not premium features, increasing consumer trust by up to 40% for certified brands.
- The demand for products using natural food preservatives like vinegar and sea salt instead of synthetic alternatives has spurred innovation in lactic acid fermentation.
- This shift has also revitalized interest in heritage pickling recipes and created a robust supply chain for organic pickling cucumbers, aligning with a consumer base that prioritizes minimally processed, non-pasteurized fermented products.
What are the market trends shaping the Pickles Industry?
- The market is witnessing a proliferation of cross-category flavor fusion. This includes the integration of pickle profiles into non-traditional beverage and snack formats.
- The market is defined by a move toward cross-category flavor innovation, with pickle profiles appearing in beverages and snacks. This trend, amplified by the influence of pickleball culture, creates demand for electrolyte-enhanced brine and on-the-go pickle snacks, driving a 25% increase in new product launches in the functional beverage space.
- Concurrently, sustainability is a major focus, with a shift toward circular packaging and fiber-based alternatives, like aseptic packaging, reducing plastic waste by over 30% in some supply chains. Operationally, the adoption of AI-driven quality inspection and brine concentration monitoring with lug caps provides unprecedented control over production, ensuring consistency and scaling quality to industrial levels with retort-pouch packaging.
What challenges does the Pickles Industry face during its growth?
- The industry's growth faces a significant challenge from the intensification of climate volatility and the resulting fragility of the agricultural supply chain.
- A key challenge resides in the agricultural supply chain, where climate volatility impacts raw material availability and pricing. This instability creates a significant hurdle for maintaining consistent production costs, which can fluctuate by as much as 20% season-over-season.
- Simultaneously, regulatory pressures intensify, with front-of-pack labeling and nutrient profiling systems targeting high sodium content and the use of additives like sodium benzoate and artificial coloring agents.
- The transition to sustainable food packaging presents another technical difficulty; developing cost-effective high-barrier bio-polymers for high-acidity food packaging that prevent spoilage with effective moisture barriers remains a primary bottleneck, slowing adoption rates of vacuum-sealing alternatives by nearly 50% compared to other food sectors.
Exclusive Technavio Analysis on Customer Landscape
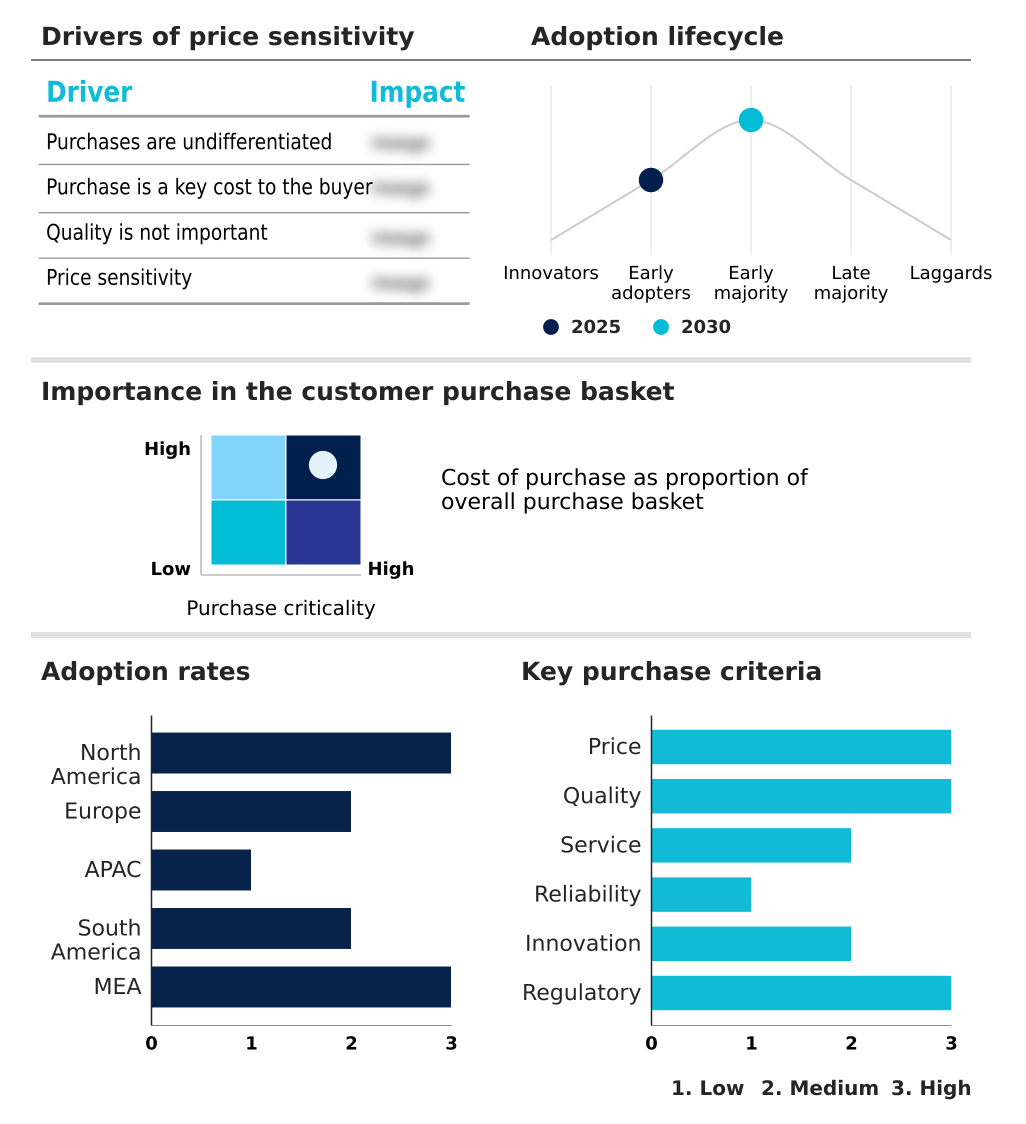
The pickles market forecasting report includes the adoption lifecycle of the market, covering from the innovator’s stage to the laggard’s stage. It focuses on adoption rates in different regions based on penetration. Furthermore, the pickles market report also includes key purchase criteria and drivers of price sensitivity to help companies evaluate and develop their market growth analysis strategies.
Customer Landscape of Pickles Industry
Competitive Landscape
Companies are implementing various strategies, such as strategic alliances, pickles market forecast, partnerships, mergers and acquisitions, geographical expansion, and product/service launches, to enhance their presence in the industry.
ADF Foods Ltd. - Specializes in authentic fruit and mixed vegetable pickles, offering a diverse range of traditional and ethnic preserves for international retail and foodservice channels.
The industry research and growth report includes detailed analyses of the competitive landscape of the market and information about key companies, including:
- ADF Foods Ltd.
- B and G Foods Inc.
- Carl Kuhne KG
- Del Monte Pacific Ltd.
- Desai Foods Pvt Ltd
- Gedney Foods Co
- Grillos Pickles Inc.
- Hausbeck Pickle Co.
- Hengstenberg GmbH and Co. KG
- McClures Pickles
- Mt Olive Pickles Co. Inc.
- MTR Foods Pvt. Ltd.
- Nilons Enterprises Pvt. Ltd.
- Patriot Pickle
- Priya Foods
- SuckerPunch Gourmet LLC
- TAMEK
- The Kraft Heinz Co.
- Van Holtens
- Vlasics
Qualitative and quantitative analysis of companies has been conducted to help clients understand the wider business environment as well as the strengths and weaknesses of key industry players. Data is qualitatively analyzed to categorize companies as pure play, category-focused, industry-focused, and diversified; it is quantitatively analyzed to categorize companies as dominant, leading, strong, tentative, and weak.
Recent Development and News in Pickles market
- In September, 2024, Grillos Pickles Inc. announced the launch of a new line of on-the-go pickle snacks featuring organic pickling cucumbers and electrolyte-enhanced brine, targeting the health-conscious consumer segment.
- In November, 2024, Patriot Pickle completed its acquisition of a regional artisanal producer, expanding its capacity for heritage recipes and strengthening its distribution network in the foodservice sector.
- In February, 2025, The Kraft Heinz Co. reported the full-scale implementation of AI-driven quality inspection systems across its Claussen pickle facilities, improving cucumber sorting efficiency by over 10%.
- In April, 2025, Del Monte Pacific Ltd. entered a strategic partnership with a leading materials science firm to develop and roll out new high-barrier bio-polymers for its pickle product lines, advancing its sustainable food packaging goals.
Dive into Technavio’s robust research methodology, blending expert interviews, extensive data synthesis, and validated models for unparalleled Pickles Market insights. See full methodology.
| Market Scope | |
|---|---|
| Page number | 291 |
| Base year | 2025 |
| Historic period | 2020-2024 |
| Forecast period | 2026-2030 |
| Growth momentum & CAGR | Accelerate at a CAGR of 3.3% |
| Market growth 2026-2030 | USD 2286.1 million |
| Market structure | Fragmented |
| YoY growth 2025-2026(%) | 3.2% |
| Key countries | US, Canada, Mexico, Germany, UK, France, Italy, Spain, The Netherlands, China, Japan, India, South Korea, Australia, Indonesia, Brazil, Argentina, Chile, Saudi Arabia, UAE, South Africa, Israel and Turkey |
| Competitive landscape | Leading Companies, Market Positioning of Companies, Competitive Strategies, and Industry Risks |
Research Analyst Overview
- The pickles market is defined by a strategic pivot toward value-added attributes, where artisanal production and heritage recipes are being scaled through advanced industrial processes. Key market activity revolves around probiotic enrichment and achieving clean-label transparency, necessitating the integration of technologies like high-pressure processing and IoT sensors for precise anaerobic fermentation.
- This focus on quality and health has driven a boardroom-level shift in sourcing strategy, prioritizing organic ingredient sourcing and non-GMO certification to mitigate supply chain risks. Manufacturers are leveraging computer vision and machine learning algorithms in automated sorting systems, which has led to a 12% reduction in raw material waste.
- The market also sees significant innovation in packaging, with multi-layer laminates and acid-resistant coatings being developed for retortable pouches and other shelf-stable foods. This is driven by demand for both convenience and sustainability, leading to new fiber-based alternatives and circular packaging solutions.
- Flavor fusion remains a critical growth vector, with ethnic profiles, gochugaru spice, and unique swangy profiles expanding the product landscape beyond traditional offerings.
What are the Key Data Covered in this Pickles Market Research and Growth Report?
-
What is the expected growth of the Pickles Market between 2026 and 2030?
-
USD 2.29 billion, at a CAGR of 3.3%
-
-
What segmentation does the market report cover?
-
The report is segmented by Product (Fruit pickles, Vegetable pickles, and Others), End-user (Retail, and Foodservice), Type of Packaging (Glass jars, Pouches, and Cans) and Geography (North America, Europe, APAC, South America, Middle East and Africa)
-
-
Which regions are analyzed in the report?
-
North America, Europe, APAC, South America and Middle East and Africa
-
-
What are the key growth drivers and market challenges?
-
Strategic mainstreaming of functional gut health and probiotic enrichment, Intensification of climate volatility and agricultural supply chain fragility
-
-
Who are the major players in the Pickles Market?
-
ADF Foods Ltd., B and G Foods Inc., Carl Kuhne KG, Del Monte Pacific Ltd., Desai Foods Pvt Ltd, Gedney Foods Co, Grillos Pickles Inc., Hausbeck Pickle Co., Hengstenberg GmbH and Co. KG, McClures Pickles, Mt Olive Pickles Co. Inc., MTR Foods Pvt. Ltd., Nilons Enterprises Pvt. Ltd., Patriot Pickle, Priya Foods, SuckerPunch Gourmet LLC, TAMEK, The Kraft Heinz Co., Van Holtens and Vlasics
-
Market Research Insights
- The market's dynamism is fueled by a convergence of consumer health consciousness and culinary exploration. Demand for functional fermented foods and probiotic-rich formulations has accelerated the adoption of natural preservation techniques, with brands highlighting clean-label pickle ingredients seeing a 20% higher repeat purchase rate.
- Cross-category flavor innovation is expanding the use of pickles into new formats, such as on-the-go pickle snacks and gourmet pickle relishes, a segment that has grown by over 15% in retail channels. The shift toward foodservice bulk pickles with custom pickle formulations allows chains to differentiate menus.
- Concurrently, the rise of artisanal pickle production and heritage pickling recipes caters to a demand for authenticity. This push for premiumization is reshaping the competitive landscape.
We can help! Our analysts can customize this pickles market research report to meet your requirements.
 RIA -
RIA - 
