Picture Archiving And Communication System Market Analysis, Size, and Forecast 2026-2030: North America (US, Canada, and Mexico), Europe (Germany, UK, and France), APAC (China, Japan, and India), South America (Brazil, Argentina, and Colombia), Middle East and Africa (Saudi Arabia, UAE, and South Africa), Asia, Rest of World (ROW)

Picture Archiving And Communication System Market Analysis, Size, and Forecast 2026-2030:
North America (US, Canada, and Mexico), Europe (Germany, UK, and France), APAC (China, Japan, and India), South America (Brazil, Argentina, and Colombia), Middle East and Africa (Saudi Arabia, UAE, and South Africa), Asia, Rest of World (ROW)

Published: Mar 2026 298 Pages SKU: IRTNTR43236

Market Overview at a Glance

$1.45 B
Market Opportunity
5.8%
CAGR 2025 - 2030
48.1%
North America Growth
$3.19 B
Mid-end PACS segment 2024

Picture Archiving And Communication System Market Size 2026-2030

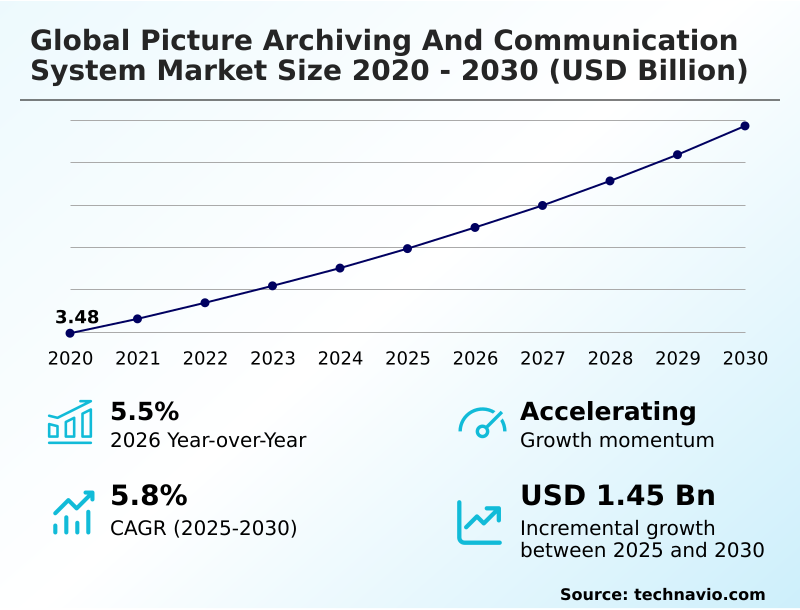
The picture archiving and communication system market size is valued to increase by USD 1.45 billion, at a CAGR of 5.8% from 2025 to 2030. Accelerated integration of cloud-native medical imaging architectures will drive the picture archiving and communication system market.

Major Market Trends & Insights

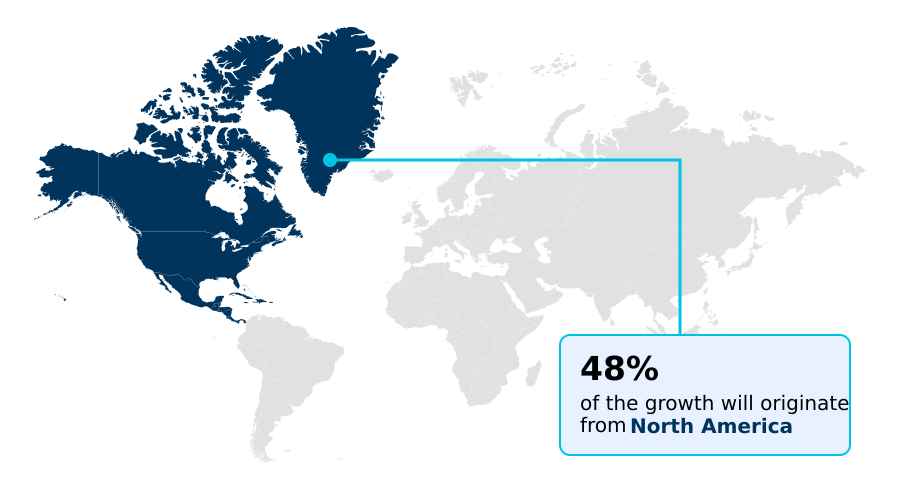
  • North America dominated the market and accounted for a 48.1% growth during the forecast period.
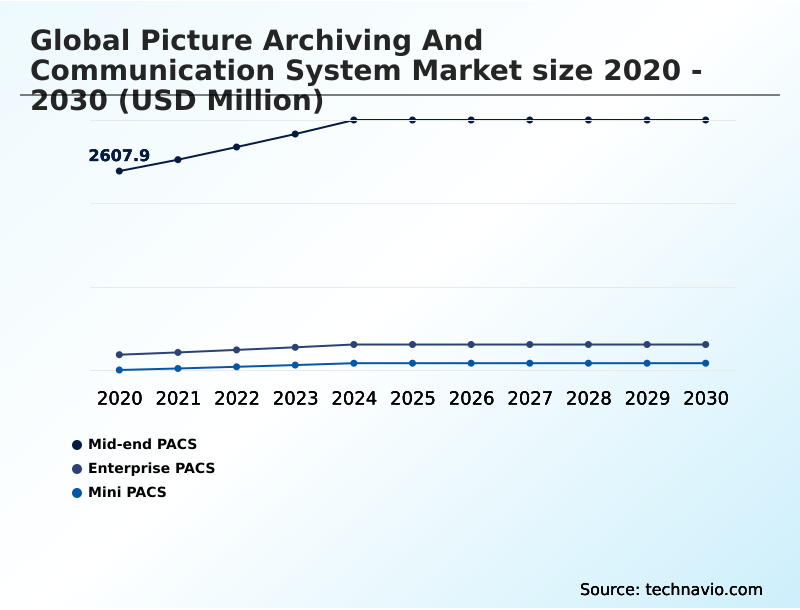
  • By Product - Mid-end PACS segment was valued at USD 3.19 billion in 2024
  • By Application - Radiology PACS segment accounted for the largest market revenue share in 2024

Market Size & Forecast

  • Market Opportunities: USD 2.45 billion
  • Market Future Opportunities: USD 1.45 billion
  • CAGR from 2025 to 2030 : 5.8%

Market Summary

  • The picture archiving and communication system market is undergoing intensive modernization, moving from siloed departmental storage to integrated enterprise imaging ecosystems. This evolution is driven by the exponential growth in diagnostic imaging data, compelling providers to adopt scalable, cloud-native PACS architectures for superior interoperability and remote access.
  • The integration of artificial intelligence and machine learning is a critical catalyst, with deep-learning models automating tasks like image sorting and lesion identification, addressing skill shortages and accelerating diagnostic turnaround times. For instance, a hospital network implementing an AI-augmented PACS can achieve automated triage, prioritizing critical cases like intracranial hemorrhages for immediate review, thereby enhancing clinical focus and operational throughput.
  • This shift toward intelligent, interconnected platforms is further supported by the adoption of standards like DICOM format and HL7 FHIR protocol, which facilitate seamless data exchange and create a foundation for precision medicine by correlating imaging with other clinical data.

What will be the Size of the Picture Archiving And Communication System Market during the forecast period?

Get Key Insights on Market Forecast (PDF) Request Free Sample

How is the Picture Archiving And Communication System Market Segmented?

The picture archiving and communication system industry research report provides comprehensive data (region-wise segment analysis), with forecasts and estimates in "USD million" for the period 2026-2030, as well as historical data from 2020-2024 for the following segments.

  • Product
    • Mid-end PACS
    • Enterprise PACS
    • Mini PACS
  • Application
    • Radiology PACS
    • Cardiology PACS
    • Pathology PACS
  • End-user
    • Hospitals and clinics
    • Diagnostic imaging centers
    • Ambulatory surgery centers
    • Others
  • Geography
    • North America
      • US
      • Canada
      • Mexico
    • Europe
      • Germany
      • UK
      • France
    • Asia
    • Rest of World (ROW)

By Product Insights

The mid-end pacs segment is estimated to witness significant growth during the forecast period.

The mid-end picture archiving and communication system segment is tailored for medium-sized facilities requiring a balance of robust features and cost-effectiveness.

This tier is shifting toward software-as-a-service (SaaS) delivery models, allowing providers to adopt modern technology with predictable operational expenses instead of high capital expenditure in healthcare IT.

These platforms offer integrated reporting and standard diagnostic tools, increasingly incorporating AI for routine tasks. The focus is on user-friendly interfaces for rapid deployment, ensuring smaller teams can maximize throughput.

With the move to cloud-based delivery offering a 45% reduction in retrieval time, these systems are vital for regional networks modernizing their diagnostic imaging workflows and medical imaging data management without the scale of a full enterprise imaging platform.

Request Free Sample

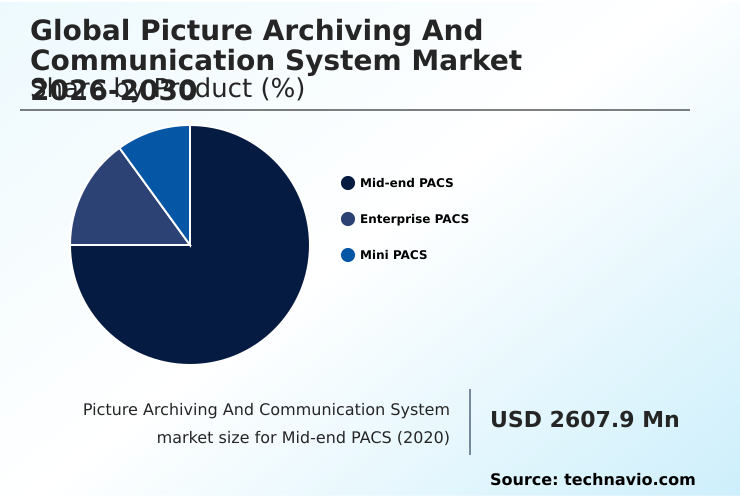
The Mid-end PACS segment was valued at USD 3.19 billion in 2024 and showed a gradual increase during the forecast period.

Request Free Sample

Regional Analysis

North America is estimated to contribute 48.1% to the growth of the global market during the forecast period.Technavio’s analysts have elaborately explained the regional trends and drivers that shape the market during the forecast period.

See How Picture Archiving And Communication System Market Demand is Rising in North America Request Free Sample

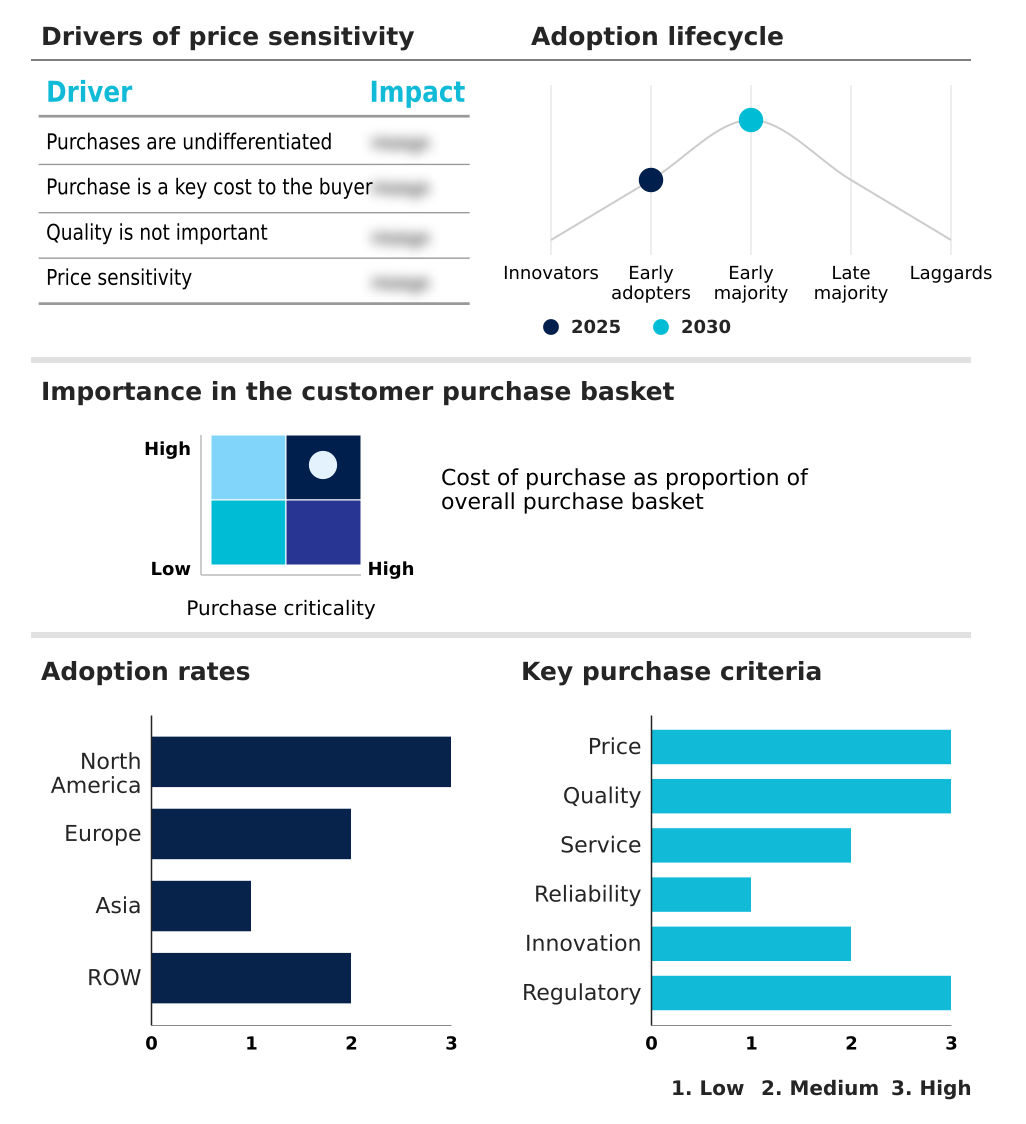
The global landscape for picture archiving and communication systems is characterized by varied regional adoption rates and technological priorities.

In North America, the focus is on healthcare IT infrastructure modernization and achieving enterprise-wide interoperability, with mature markets prioritizing AI-augmented PACS and cloud-native solutions to manage high data volumes.

Europe emphasizes data security and regulatory alignment, driving demand for platforms with robust data encryption protocols and HIPAA and GDPR compliance.

Meanwhile, Asia is the most dynamic region, with many nations leapfrogging legacy systems to adopt hybrid-cloud PACS and mobile-first teleradiology frameworks.

The implementation of lightweight zero-footprint viewers is crucial in addressing bandwidth limitations in developing areas, enabling remote diagnostic reading and improving access to care. This geographic diversity requires vendors to offer scalable and adaptable enterprise imaging platforms.

Market Dynamics

Our researchers analyzed the data with 2025 as the base year, along with the key drivers, trends, and challenges. A holistic analysis of drivers will help companies refine their marketing strategies to gain a competitive advantage.

  • Strategic decisions around picture archiving and communication systems increasingly weigh the total cost of enterprise imaging solutions against long-term clinical and operational benefits. When integrating PACS with EHR systems, healthcare organizations prioritize seamless interoperability between different PACS vendors to create a unified longitudinal patient record.
  • The VNA implementation in multi-site hospitals is a key strategy to achieve this, decoupling storage from viewing applications. However, cybersecurity risks in cloud PACS remain a primary concern, demanding robust security protocols for zero-footprint viewers and comprehensive disaster recovery plans.
  • The ROI of AI-augmented PACS platforms is now a critical metric, with AI for diagnostic image segmentation and automated triage proven to enhance workflows. For instance, systems that optimize PACS workflow optimization techniques can reduce diagnostic turnaround with AI by over 30% compared to manual processes. Mobile-first diagnostic access benefits remote and point-of-care settings, making cloud-native PACS for teleradiology essential.
  • As digital pathology adoption grows, managing photon-counting data storage requirements and addressing challenges in digital pathology adoption become new focus areas. Ultimately, ensuring HIPAA compliance for cloud PACS and planning effective data migration strategies for PACS are foundational to any modernization project, particularly for specialized areas like structured reporting in cardiology PACS and systems for ambulatory surgery centers.

What are the key market drivers leading to the rise in the adoption of Picture Archiving And Communication System Industry?

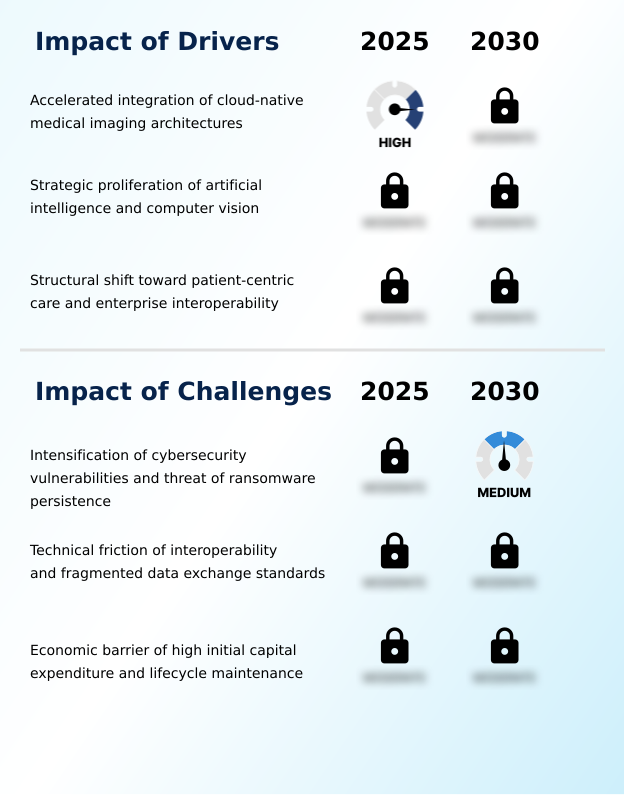
  • The accelerated integration of cloud-native medical imaging architectures serves as a key driver for the picture archiving and communication system market.

  • Market growth is primarily driven by the accelerated integration of cloud-native medical imaging architectures and the strategic proliferation of artificial intelligence.
  • The adoption of hybrid-cloud PACS and SaaS models offers providers superior scalability and remote accessibility, with some systems demonstrating a 45% reduction in image retrieval time.
  • This shift is critical for managing the exponential growth in data from modern diagnostic modalities. AI and computer vision algorithms are transforming clinical decision support, with automated triage systems enhancing hospital throughput.
  • The implementation of deep-learning models for automated image segmentation and analysis acts as a diagnostic co-pilot, improving patient outcomes.
  • Furthermore, the structural shift toward patient-centric care and enterprise interoperability, facilitated by standards like HL7 FHIR protocol, is breaking down healthcare data silos and enabling a connected digital health ecosystem.

What are the market trends shaping the Picture Archiving And Communication System Industry?

  • A key market trend is the growth of specialty-specific picture archiving and communication systems, alongside a strategic move toward multidisciplinary enterprise integration.

  • Current market trends are reshaping diagnostic imaging, with a pronounced shift toward specialty-specific platforms and multidisciplinary enterprise integration. The expansion of mobile-first diagnostic access and point-of-care informatics is driven by the need for flexible, decentralized care. Systems featuring mobile C-arm connectivity and handheld ultrasound connectivity are becoming standard in ambulatory settings.
  • This move toward untethered diagnostics, supported by advanced compression and streaming protocols, allows for high-resolution image review on mobile devices, improving remote second opinions. Concurrently, the development of photon-counting data integration and UHD precision imaging is pushing infrastructure limits, requiring advanced image reconstruction algorithms.
  • This trend addresses the demands of precision medicine imaging, enabling high-fidelity informatics and enhancing clinical collaboration tools for surgical planning with 3D rendering.

What challenges does the Picture Archiving And Communication System Industry face during its growth?

  • The intensification of cybersecurity vulnerabilities and the persistent threat of ransomware pose a significant challenge to the growth of the picture archiving and communication system market.

  • The market faces significant challenges, led by the intensification of cybersecurity vulnerabilities and the high technical debt of legacy infrastructure. Ransomware protection for PACS has become a critical, non-discretionary expenditure, as cyber incidents transition from rare events to recurring operational threats.
  • Technical friction from a lack of interoperability standards and fragmented data exchange also impedes progress, with nearly 42% of IT administrators reporting persistent integration issues between their PACS and EHR systems. This creates proprietary data silos and hinders cross-platform visibility in healthcare. Finally, the high initial capital expenditure in healthcare IT and lifecycle maintenance costs form a substantial economic barrier.
  • The expense of diagnostic-grade workstations and high recurring subscription fees for cloud services lead to cautious investment, restraining widespread adoption of modern medical imaging information systems.

Exclusive Technavio Analysis on Customer Landscape

The picture archiving and communication system market forecasting report includes the adoption lifecycle of the market, covering from the innovator’s stage to the laggard’s stage. It focuses on adoption rates in different regions based on penetration. Furthermore, the picture archiving and communication system market report also includes key purchase criteria and drivers of price sensitivity to help companies evaluate and develop their market growth analysis strategies.

Customer Landscape of Picture Archiving And Communication System Industry

Competitive Landscape

Companies are implementing various strategies, such as strategic alliances, picture archiving and communication system market forecast, partnerships, mergers and acquisitions, geographical expansion, and product/service launches, to enhance their presence in the industry.

Agfa Gevaert NV - Provides enterprise imaging platforms and picture archiving and communication systems designed for comprehensive radiology and clinical imaging management, enhancing diagnostic workflows.

The industry research and growth report includes detailed analyses of the competitive landscape of the market and information about key companies, including:

  • Agfa Gevaert NV
  • Carestream Health Inc.
  • Dedalus Group
  • FUJIFILM Holdings Corp.
  • GE HealthCare Technologies
  • Intelerad Medical Systems Inc.
  • Konica Minolta Inc.
  • Koninklijke Philips NV
  • medavis GmbH
  • Merative L.P.
  • NovaRad Corp.
  • Optum Inc.
  • PaxeraHealth Corp.
  • RamSoft Inc.
  • ScImage Inc.
  • Sectra AB
  • Siemens Healthineers AG
  • VISUS Health IT GmbH

Qualitative and quantitative analysis of companies has been conducted to help clients understand the wider business environment as well as the strengths and weaknesses of key industry players. Data is qualitatively analyzed to categorize companies as pure play, category-focused, industry-focused, and diversified; it is quantitatively analyzed to categorize companies as dominant, leading, strong, tentative, and weak.

Recent Development and News in Picture archiving and communication system market

  • In September 2024, Siemens Healthineers AG announced a strategic partnership with an AI startup to integrate predictive analytics for early stroke detection into its syngo Carbon enterprise imaging platform.
  • In November 2024, Intelerad Medical Systems Inc. completed the acquisition of a cloud-native vendor-neutral archive (VNA) provider to enhance its enterprise imaging portfolio and expand its data management capabilities.
  • In February 2025, GE HealthCare Technologies received FDA 510(k) clearance for its new AI-powered triage tool, designed to prioritize critical findings in chest X-rays within its Centricity PACS environment.
  • In April 2025, Koninklijke Philips NV launched a significant upgrade to its IntelliSpace PACS, introducing a zero-footprint viewer with enhanced mobile capabilities and security protocols for remote diagnostic reading.

Dive into Technavio’s robust research methodology, blending expert interviews, extensive data synthesis, and validated models for unparalleled Picture Archiving And Communication System Market insights. See full methodology.

Market Scope
Page number 298
Base year 2025
Historic period 2020-2024
Forecast period 2026-2030
Growth momentum & CAGR Accelerate at a CAGR of 5.8%
Market growth 2026-2030 USD 1449.0 million
Market structure Fragmented
YoY growth 2025-2026(%) 5.5%
Key countries US, Canada, Mexico, Germany, UK, France, Italy, Spain, The Netherlands, China, Japan, India, South Korea, Thailand, Indonesia, Brazil, Saudi Arabia, UAE, South Africa, Turkey, Argentina, Colombia and Israel
Competitive landscape Leading Companies, Market Positioning of Companies, Competitive Strategies, and Industry Risks

Request Free Sample

Research Analyst Overview

  • The picture archiving and communication system market's evolution is defined by a pivot toward sophisticated, interconnected ecosystems. Boardroom decisions now center on budgeting for enterprise-wide interoperability and the adoption of software-as-a-service (SaaS) delivery models to manage costs. Core technologies such as DICOM format and the HL7 FHIR protocol are fundamental for creating a cohesive longitudinal patient record.
  • The deployment of a vendor-neutral archive (VNA) is critical for multi-site hospital sub-segments seeking to consolidate data from disparate sources. Platforms are advancing with features like voice-recognition reporting, automated triage systems, and point-of-care informatics. This is driven by the need to manage data from whole-slide imaging and photon-counting data integration.
  • The shift to cloud-native PACS and hybrid-cloud PACS, featuring zero-footprint viewers and robust data encryption protocols, enhances remote accessibility and disaster recovery for medical data. The integration of AI-augmented PACS with deep-learning models for automated image segmentation has proven to reduce diagnostic turnaround times. For instance, facilities have reported that implementing these intelligent systems reduces report generation time by 25%.
  • This technology enables high-resolution image review and supports computational pathology tools, transforming diagnostic imaging workflows across the board from diagnostic-grade workstations.

What are the Key Data Covered in this Picture Archiving And Communication System Market Research and Growth Report?

  • What is the expected growth of the Picture Archiving And Communication System Market between 2026 and 2030?

    • USD 1.45 billion, at a CAGR of 5.8%

  • What segmentation does the market report cover?

    • The report is segmented by Product (Mid-end PACS, Enterprise PACS, and Mini PACS), Application (Radiology PACS, Cardiology PACS, and Pathology PACS), End-user (Hospitals and clinics, Diagnostic imaging centers, Ambulatory surgery centers, and Others) and Geography (North America, Europe, Asia, Rest of World (ROW))

  • Which regions are analyzed in the report?

    • North America, Europe, Asia and Rest of World (ROW)

  • What are the key growth drivers and market challenges?

    • Accelerated integration of cloud-native medical imaging architectures, Intensification of cybersecurity vulnerabilities and threat of ransomware persistence

  • Who are the major players in the Picture Archiving And Communication System Market?

    • Agfa Gevaert NV, Carestream Health Inc., Dedalus Group, FUJIFILM Holdings Corp., GE HealthCare Technologies, Intelerad Medical Systems Inc., Konica Minolta Inc., Koninklijke Philips NV, medavis GmbH, Merative L.P., NovaRad Corp., Optum Inc., PaxeraHealth Corp., RamSoft Inc., ScImage Inc., Sectra AB, Siemens Healthineers AG and VISUS Health IT GmbH

Market Research Insights

  • Market dynamics are shaped by a strategic pivot to value-based care models, compelling healthcare providers to seek greater clinical workflow efficiency. The adoption of enterprise imaging strategies is rising, with a focus on integrating disparate systems to break down healthcare data silos.
  • This transition yields measurable benefits; platforms incorporating advanced visualization tools have been shown to improve pre-operative planning accuracy, while the adoption of cloud-native architectures can reduce image retrieval times by up to 45%. However, achieving seamless cross-platform visibility remains a concern, as nearly 42% of IT administrators report persistent integration challenges.
  • Success hinges on a vendor's ability to deliver a comprehensive digital health ecosystem that supports remote diagnostic reading and patient-centric care models.

We can help! Our analysts can customize this picture archiving and communication system market research report to meet your requirements.

Get in touch

1. Executive Summary

1.1 Market overview

Executive Summary - Chart on Market Overview
Executive Summary - Data Table on Market Overview
Executive Summary - Chart on Global Market Characteristics
Executive Summary - Chart on Market by Geography
Executive Summary - Chart on Market Segmentation by Product
Executive Summary - Chart on Market Segmentation by Application
Executive Summary - Chart on Market Segmentation by End-user
Executive Summary - Chart on Incremental Growth
Executive Summary - Data Table on Incremental Growth
Executive Summary - Chart on Company Market Positioning

2. Technavio Analysis

2.1 Analysis of price sensitivity, lifecycle, customer purchase basket, adoption rates, and purchase criteria

2.2 Criticality of inputs and Factors of differentiation

Chart on Overview on criticality of inputs and factors of differentiation

2.3 Factors of disruption

Chart on Overview on factors of disruption

2.4 Impact of drivers and challenges

Chart on Impact of drivers and challenges in 2025 and 2030

3. Market Landscape

3.1 Market ecosystem

Chart on Parent Market
Data Table on - Parent Market

3.2 Market characteristics

Chart on Market characteristics analysis

3.3 Value chain analysis

Chart on Value chain analysis

4. Market Sizing

4.1 Market definition

Data Table on Offerings of companies included in the market definition

4.2 Market segment analysis

Market segments

4.3 Market size 2025

4.4 Market outlook: Forecast for 2025-2030

Chart on Global - Market size and forecast 2025-2030 ($ million)
Data Table on Global - Market size and forecast 2025-2030 ($ million)
Chart on Global Market: Year-over-year growth 2025-2030 (%)
Data Table on Global Market: Year-over-year growth 2025-2030 (%)

5. Historic Market Size

5.1 Global Picture Archiving And Communication System Market 2020 - 2024

Historic Market Size - Data Table on Global Picture Archiving And Communication System Market 2020 - 2024 ($ million)

5.2 Product segment analysis 2020 - 2024

Historic Market Size - Product Segment 2020 - 2024 ($ million)

5.3 Application segment analysis 2020 - 2024

Historic Market Size - Application Segment 2020 - 2024 ($ million)

5.4 End-user segment analysis 2020 - 2024

Historic Market Size - End-user Segment 2020 - 2024 ($ million)

5.5 Geography segment analysis 2020 - 2024

Historic Market Size - Geography Segment 2020 - 2024 ($ million)

5.6 Country segment analysis 2020 - 2024

Historic Market Size - Country Segment 2020 - 2024 ($ million)

6. Qualitative Analysis

6.1 Impact of AI in global picture archiving and communication system market

6.2 Impact of geopolitical conflict for global picture archiving and communication system market

7. Five Forces Analysis

7.1 Five forces summary

Five forces analysis - Comparison between 2025 and 2030

7.2 Bargaining power of buyers

Bargaining power of buyers - Impact of key factors 2025 and 2030

7.3 Bargaining power of suppliers

Bargaining power of suppliers - Impact of key factors in 2025 and 2030

7.4 Threat of new entrants

Threat of new entrants - Impact of key factors in 2025 and 2030

7.5 Threat of substitutes

Threat of substitutes - Impact of key factors in 2025 and 2030

7.6 Threat of rivalry

Threat of rivalry - Impact of key factors in 2025 and 2030

7.7 Market condition

Chart on Market condition - Five forces 2025 and 2030

8. Market Segmentation by Product

8.1 Market segments

Chart on Product - Market share 2025-2030 (%)
Data Table on Product - Market share 2025-2030 (%)

8.2 Comparison by Product

Chart on Comparison by Product
Data Table on Comparison by Product

8.3 Mid-end PACS - Market size and forecast 2025-2030

Chart on Mid-end PACS - Market size and forecast 2025-2030 ($ million)
Data Table on Mid-end PACS - Market size and forecast 2025-2030 ($ million)
Chart on Mid-end PACS - Year-over-year growth 2025-2030 (%)
Data Table on Mid-end PACS - Year-over-year growth 2025-2030 (%)

8.4 Enterprise PACS - Market size and forecast 2025-2030

Chart on Enterprise PACS - Market size and forecast 2025-2030 ($ million)
Data Table on Enterprise PACS - Market size and forecast 2025-2030 ($ million)
Chart on Enterprise PACS - Year-over-year growth 2025-2030 (%)
Data Table on Enterprise PACS - Year-over-year growth 2025-2030 (%)

8.5 Mini PACS - Market size and forecast 2025-2030

Chart on Mini PACS - Market size and forecast 2025-2030 ($ million)
Data Table on Mini PACS - Market size and forecast 2025-2030 ($ million)
Chart on Mini PACS - Year-over-year growth 2025-2030 (%)
Data Table on Mini PACS - Year-over-year growth 2025-2030 (%)

8.6 Market opportunity by Product

Market opportunity by Product ($ million)
Data Table on Market opportunity by Product ($ million)

9. Market Segmentation by Application

9.1 Market segments

Chart on Application - Market share 2025-2030 (%)
Data Table on Application - Market share 2025-2030 (%)

9.2 Comparison by Application

Chart on Comparison by Application
Data Table on Comparison by Application

9.3 Radiology PACS - Market size and forecast 2025-2030

Chart on Radiology PACS - Market size and forecast 2025-2030 ($ million)
Data Table on Radiology PACS - Market size and forecast 2025-2030 ($ million)
Chart on Radiology PACS - Year-over-year growth 2025-2030 (%)
Data Table on Radiology PACS - Year-over-year growth 2025-2030 (%)

9.4 Cardiology PACS - Market size and forecast 2025-2030

Chart on Cardiology PACS - Market size and forecast 2025-2030 ($ million)
Data Table on Cardiology PACS - Market size and forecast 2025-2030 ($ million)
Chart on Cardiology PACS - Year-over-year growth 2025-2030 (%)
Data Table on Cardiology PACS - Year-over-year growth 2025-2030 (%)

9.5 Pathology PACS - Market size and forecast 2025-2030

Chart on Pathology PACS - Market size and forecast 2025-2030 ($ million)
Data Table on Pathology PACS - Market size and forecast 2025-2030 ($ million)
Chart on Pathology PACS - Year-over-year growth 2025-2030 (%)
Data Table on Pathology PACS - Year-over-year growth 2025-2030 (%)

9.6 Market opportunity by Application

Market opportunity by Application ($ million)
Data Table on Market opportunity by Application ($ million)

10. Market Segmentation by End-user

10.1 Market segments

Chart on End-user - Market share 2025-2030 (%)
Data Table on End-user - Market share 2025-2030 (%)

10.2 Comparison by End-user

Chart on Comparison by End-user
Data Table on Comparison by End-user

10.3 Hospitals and clinics - Market size and forecast 2025-2030

Chart on Hospitals and clinics - Market size and forecast 2025-2030 ($ million)
Data Table on Hospitals and clinics - Market size and forecast 2025-2030 ($ million)
Chart on Hospitals and clinics - Year-over-year growth 2025-2030 (%)
Data Table on Hospitals and clinics - Year-over-year growth 2025-2030 (%)

10.4 Diagnostic imaging centers - Market size and forecast 2025-2030

Chart on Diagnostic imaging centers - Market size and forecast 2025-2030 ($ million)
Data Table on Diagnostic imaging centers - Market size and forecast 2025-2030 ($ million)
Chart on Diagnostic imaging centers - Year-over-year growth 2025-2030 (%)
Data Table on Diagnostic imaging centers - Year-over-year growth 2025-2030 (%)

10.5 Ambulatory surgery centers - Market size and forecast 2025-2030

Chart on Ambulatory surgery centers - Market size and forecast 2025-2030 ($ million)
Data Table on Ambulatory surgery centers - Market size and forecast 2025-2030 ($ million)
Chart on Ambulatory surgery centers - Year-over-year growth 2025-2030 (%)
Data Table on Ambulatory surgery centers - Year-over-year growth 2025-2030 (%)

10.6 Others - Market size and forecast 2025-2030

Chart on Others - Market size and forecast 2025-2030 ($ million)
Data Table on Others - Market size and forecast 2025-2030 ($ million)
Chart on Others - Year-over-year growth 2025-2030 (%)
Data Table on Others - Year-over-year growth 2025-2030 (%)

10.7 Market opportunity by End-user

Market opportunity by End-user ($ million)
Data Table on Market opportunity by End-user ($ million)

11. Customer Landscape

11.1 Customer landscape overview

Analysis of price sensitivity, lifecycle, customer purchase basket, adoption rates, and purchase criteria

12. Geographic Landscape

12.1 Geographic segmentation

Chart on Market share by geography 2025-2030 (%)
Data Table on Market share by geography 2025-2030 (%)

12.2 Geographic comparison

Chart on Geographic comparison
Data Table on Geographic comparison

12.3 North America - Market size and forecast 2025-2030

Chart on North America - Market size and forecast 2025-2030 ($ million)
Data Table on North America - Market size and forecast 2025-2030 ($ million)
Chart on North America - Year-over-year growth 2025-2030 (%)
Data Table on North America - Year-over-year growth 2025-2030 (%)
Chart on Regional Comparison - North America
Data Table on Regional Comparison - North America

12.3.1 US - Market size and forecast 2025-2030

Chart on US - Market size and forecast 2025-2030 ($ million)
Data Table on US - Market size and forecast 2025-2030 ($ million)
Chart on US - Year-over-year growth 2025-2030 (%)
Data Table on US - Year-over-year growth 2025-2030 (%)

12.3.2 Canada - Market size and forecast 2025-2030

Chart on Canada - Market size and forecast 2025-2030 ($ million)
Data Table on Canada - Market size and forecast 2025-2030 ($ million)
Chart on Canada - Year-over-year growth 2025-2030 (%)
Data Table on Canada - Year-over-year growth 2025-2030 (%)

12.3.3 Mexico - Market size and forecast 2025-2030

Chart on Mexico - Market size and forecast 2025-2030 ($ million)
Data Table on Mexico - Market size and forecast 2025-2030 ($ million)
Chart on Mexico - Year-over-year growth 2025-2030 (%)
Data Table on Mexico - Year-over-year growth 2025-2030 (%)

12.4 Europe - Market size and forecast 2025-2030

Chart on Europe - Market size and forecast 2025-2030 ($ million)
Data Table on Europe - Market size and forecast 2025-2030 ($ million)
Chart on Europe - Year-over-year growth 2025-2030 (%)
Data Table on Europe - Year-over-year growth 2025-2030 (%)
Chart on Regional Comparison - Europe
Data Table on Regional Comparison - Europe

12.4.1 Germany - Market size and forecast 2025-2030

Chart on Germany - Market size and forecast 2025-2030 ($ million)
Data Table on Germany - Market size and forecast 2025-2030 ($ million)
Chart on Germany - Year-over-year growth 2025-2030 (%)
Data Table on Germany - Year-over-year growth 2025-2030 (%)

12.4.2 UK - Market size and forecast 2025-2030

Chart on UK - Market size and forecast 2025-2030 ($ million)
Data Table on UK - Market size and forecast 2025-2030 ($ million)
Chart on UK - Year-over-year growth 2025-2030 (%)
Data Table on UK - Year-over-year growth 2025-2030 (%)

12.4.3 France - Market size and forecast 2025-2030

Chart on France - Market size and forecast 2025-2030 ($ million)
Data Table on France - Market size and forecast 2025-2030 ($ million)
Chart on France - Year-over-year growth 2025-2030 (%)
Data Table on France - Year-over-year growth 2025-2030 (%)

12.4.4 Italy - Market size and forecast 2025-2030

Chart on Italy - Market size and forecast 2025-2030 ($ million)
Data Table on Italy - Market size and forecast 2025-2030 ($ million)
Chart on Italy - Year-over-year growth 2025-2030 (%)
Data Table on Italy - Year-over-year growth 2025-2030 (%)

12.4.5 Spain - Market size and forecast 2025-2030

Chart on Spain - Market size and forecast 2025-2030 ($ million)
Data Table on Spain - Market size and forecast 2025-2030 ($ million)
Chart on Spain - Year-over-year growth 2025-2030 (%)
Data Table on Spain - Year-over-year growth 2025-2030 (%)

12.4.6 The Netherlands - Market size and forecast 2025-2030

Chart on The Netherlands - Market size and forecast 2025-2030 ($ million)
Data Table on The Netherlands - Market size and forecast 2025-2030 ($ million)
Chart on The Netherlands - Year-over-year growth 2025-2030 (%)
Data Table on The Netherlands - Year-over-year growth 2025-2030 (%)

12.5 Asia - Market size and forecast 2025-2030

Chart on Asia - Market size and forecast 2025-2030 ($ million)
Data Table on Asia - Market size and forecast 2025-2030 ($ million)
Chart on Asia - Year-over-year growth 2025-2030 (%)
Data Table on Asia - Year-over-year growth 2025-2030 (%)
Chart on Regional Comparison - Asia
Data Table on Regional Comparison - Asia

12.5.1 China - Market size and forecast 2025-2030

Chart on China - Market size and forecast 2025-2030 ($ million)
Data Table on China - Market size and forecast 2025-2030 ($ million)
Chart on China - Year-over-year growth 2025-2030 (%)
Data Table on China - Year-over-year growth 2025-2030 (%)

12.5.2 Japan - Market size and forecast 2025-2030

Chart on Japan - Market size and forecast 2025-2030 ($ million)
Data Table on Japan - Market size and forecast 2025-2030 ($ million)
Chart on Japan - Year-over-year growth 2025-2030 (%)
Data Table on Japan - Year-over-year growth 2025-2030 (%)

12.5.3 India - Market size and forecast 2025-2030

Chart on India - Market size and forecast 2025-2030 ($ million)
Data Table on India - Market size and forecast 2025-2030 ($ million)
Chart on India - Year-over-year growth 2025-2030 (%)
Data Table on India - Year-over-year growth 2025-2030 (%)

12.5.4 South Korea - Market size and forecast 2025-2030

Chart on South Korea - Market size and forecast 2025-2030 ($ million)
Data Table on South Korea - Market size and forecast 2025-2030 ($ million)
Chart on South Korea - Year-over-year growth 2025-2030 (%)
Data Table on South Korea - Year-over-year growth 2025-2030 (%)

12.5.5 Thailand - Market size and forecast 2025-2030

Chart on Thailand - Market size and forecast 2025-2030 ($ million)
Data Table on Thailand - Market size and forecast 2025-2030 ($ million)
Chart on Thailand - Year-over-year growth 2025-2030 (%)
Data Table on Thailand - Year-over-year growth 2025-2030 (%)

12.5.6 Indonesia - Market size and forecast 2025-2030

Chart on Indonesia - Market size and forecast 2025-2030 ($ million)
Data Table on Indonesia - Market size and forecast 2025-2030 ($ million)
Chart on Indonesia - Year-over-year growth 2025-2030 (%)
Data Table on Indonesia - Year-over-year growth 2025-2030 (%)

12.6 Rest of World (ROW) - Market size and forecast 2025-2030

Chart on Rest of World (ROW) - Market size and forecast 2025-2030 ($ million)
Data Table on Rest of World (ROW) - Market size and forecast 2025-2030 ($ million)
Chart on Rest of World (ROW) - Year-over-year growth 2025-2030 (%)
Data Table on Rest of World (ROW) - Year-over-year growth 2025-2030 (%)
Chart on Regional Comparison - Rest of World (ROW)
Data Table on Regional Comparison - Rest of World (ROW)

12.6.1 Brazil - Market size and forecast 2025-2030

Chart on Brazil - Market size and forecast 2025-2030 ($ million)
Data Table on Brazil - Market size and forecast 2025-2030 ($ million)
Chart on Brazil - Year-over-year growth 2025-2030 (%)
Data Table on Brazil - Year-over-year growth 2025-2030 (%)

12.6.2 Saudi Arabia - Market size and forecast 2025-2030

Chart on Saudi Arabia - Market size and forecast 2025-2030 ($ million)
Data Table on Saudi Arabia - Market size and forecast 2025-2030 ($ million)
Chart on Saudi Arabia - Year-over-year growth 2025-2030 (%)
Data Table on Saudi Arabia - Year-over-year growth 2025-2030 (%)

12.6.3 UAE - Market size and forecast 2025-2030

Chart on UAE - Market size and forecast 2025-2030 ($ million)
Data Table on UAE - Market size and forecast 2025-2030 ($ million)
Chart on UAE - Year-over-year growth 2025-2030 (%)
Data Table on UAE - Year-over-year growth 2025-2030 (%)

12.6.4 South Africa - Market size and forecast 2025-2030

Chart on South Africa - Market size and forecast 2025-2030 ($ million)
Data Table on South Africa - Market size and forecast 2025-2030 ($ million)
Chart on South Africa - Year-over-year growth 2025-2030 (%)
Data Table on South Africa - Year-over-year growth 2025-2030 (%)

12.6.5 Turkey - Market size and forecast 2025-2030

Chart on Turkey - Market size and forecast 2025-2030 ($ million)
Data Table on Turkey - Market size and forecast 2025-2030 ($ million)
Chart on Turkey - Year-over-year growth 2025-2030 (%)
Data Table on Turkey - Year-over-year growth 2025-2030 (%)

12.6.6 Argentina - Market size and forecast 2025-2030

Chart on Argentina - Market size and forecast 2025-2030 ($ million)
Data Table on Argentina - Market size and forecast 2025-2030 ($ million)
Chart on Argentina - Year-over-year growth 2025-2030 (%)
Data Table on Argentina - Year-over-year growth 2025-2030 (%)

12.6.7 Colombia - Market size and forecast 2025-2030

Chart on Colombia - Market size and forecast 2025-2030 ($ million)
Data Table on Colombia - Market size and forecast 2025-2030 ($ million)
Chart on Colombia - Year-over-year growth 2025-2030 (%)
Data Table on Colombia - Year-over-year growth 2025-2030 (%)

12.6.8 Israel - Market size and forecast 2025-2030

Chart on Israel - Market size and forecast 2025-2030 ($ million)
Data Table on Israel - Market size and forecast 2025-2030 ($ million)
Chart on Israel - Year-over-year growth 2025-2030 (%)
Data Table on Israel - Year-over-year growth 2025-2030 (%)

12.7 Market opportunity by geography

Market opportunity by geography ($ million)
Data Tables on Market opportunity by geography ($ million)

13. Drivers, Challenges, and Opportunity

13.1 Market drivers

Accelerated integration of cloud-native medical imaging architectures
Strategic proliferation of artificial intelligence and computer vision
Structural shift toward patient-centric care and enterprise interoperability

13.2 Market challenges

Intensification of cybersecurity vulnerabilities and threat of ransomware persistence
Technical friction of interoperability and fragmented data exchange standards
Economic barrier of high initial capital expenditure and lifecycle maintenance

13.3 Impact of drivers and challenges

Impact of drivers and challenges in 2025 and 2030

13.4 Market opportunities

Growth of specialty-specific PACS and multidisciplinary enterprise integration
Expansion of mobile-first diagnostic access and point-of-care informatics
Development of photon-counting data integration and UHD precision imaging

14. Competitive Landscape

14.1 Overview

14.2

Overview on criticality of inputs and factors of differentiation

14.3 Landscape disruption

Overview on factors of disruption

14.4 Industry risks

Impact of key risks on business

15. Competitive Analysis

15.1 Companies profiled

Companies covered

15.2 Company ranking index

15.3 Market positioning of companies

Matrix on companies position and classification

15.4 Agfa Gevaert NV

Agfa Gevaert NV - Overview
Agfa Gevaert NV - Business segments
Agfa Gevaert NV - Key news
Agfa Gevaert NV - Key offerings
Agfa Gevaert NV - Segment focus
SWOT

15.5 Carestream Health Inc.

Carestream Health Inc. - Overview
Carestream Health Inc. - Product / Service
Carestream Health Inc. - Key offerings
SWOT

15.6 Dedalus Group

Dedalus Group - Overview
Dedalus Group - Product / Service
Dedalus Group - Key offerings
SWOT

15.7 FUJIFILM Holdings Corp.

FUJIFILM Holdings Corp. - Overview
FUJIFILM Holdings Corp. - Business segments
FUJIFILM Holdings Corp. - Key news
FUJIFILM Holdings Corp. - Key offerings
FUJIFILM Holdings Corp. - Segment focus
SWOT

15.8 GE HealthCare Technologies

GE HealthCare Technologies - Overview
GE HealthCare Technologies - Business segments
GE HealthCare Technologies - Key news
GE HealthCare Technologies - Key offerings
GE HealthCare Technologies - Segment focus
SWOT

15.9 Intelerad Medical Systems Inc.

Intelerad Medical Systems Inc. - Overview
Intelerad Medical Systems Inc. - Product / Service
Intelerad Medical Systems Inc. - Key offerings
SWOT

15.10 Konica Minolta Inc.

Konica Minolta Inc. - Overview
Konica Minolta Inc. - Business segments
Konica Minolta Inc. - Key news
Konica Minolta Inc. - Key offerings
Konica Minolta Inc. - Segment focus
SWOT

15.11 Koninklijke Philips NV

Koninklijke Philips NV - Overview
Koninklijke Philips NV - Business segments
Koninklijke Philips NV - Key news
Koninklijke Philips NV - Key offerings
Koninklijke Philips NV - Segment focus
SWOT

15.12 Merative L.P.

Merative L.P. - Overview
Merative L.P. - Product / Service
Merative L.P. - Key offerings
SWOT

15.13 NovaRad Corp.

NovaRad Corp. - Overview
NovaRad Corp. - Product / Service
NovaRad Corp. - Key offerings
SWOT

15.14 Optum Inc.

Optum Inc. - Overview
Optum Inc. - Product / Service
Optum Inc. - Key offerings
SWOT

15.15 RamSoft Inc.

RamSoft Inc. - Overview
RamSoft Inc. - Product / Service
RamSoft Inc. - Key offerings
SWOT

15.16 Sectra AB

Sectra AB - Overview
Sectra AB - Business segments
Sectra AB - Key offerings
Sectra AB - Segment focus
SWOT

15.17 Siemens Healthineers AG

Siemens Healthineers AG - Overview
Siemens Healthineers AG - Business segments
Siemens Healthineers AG - Key news
Siemens Healthineers AG - Key offerings
Siemens Healthineers AG - Segment focus
SWOT

15.18 VISUS Health IT GmbH

VISUS Health IT GmbH - Overview
VISUS Health IT GmbH - Product / Service
VISUS Health IT GmbH - Key offerings
SWOT

16. Appendix

16.1 Scope of the report

Market definition
Objectives
Notes and caveats

16.2 Inclusions and exclusions checklist

Inclusions checklist
Exclusions checklist

16.3 Currency conversion rates for US$

16.4 Research methodology

16.5 Data procurement

Information sources

16.6 Data validation

16.7 Validation techniques employed for market sizing

16.8 Data synthesis

16.9 360 degree market analysis

16.10 List of abbreviations

Research Methodology

Technavio presents a detailed picture of the market by way of study, synthesis, and summation of data from multiple sources. The analysts have presented the various facets of the market with a particular focus on identifying the key industry influencers. The data thus presented is comprehensive, reliable, and the result of extensive research, both primary and secondary.

INFORMATION SOURCES

Primary sources

  • Manufacturers and suppliers
  • Channel partners
  • Industry experts
  • Strategic decision makers

Secondary sources

  • Industry journals and periodicals
  • Government data
  • Financial reports of key industry players
  • Historical data
  • Press releases

DATA ANALYSIS

Data Synthesis

  • Collation of data
  • Estimation of key figures
  • Analysis of derived insights

Data Validation

  • Triangulation with data models
  • Reference against proprietary databases
  • Corroboration with industry experts

REPORT WRITING

Qualitative

  • Market drivers
  • Market challenges
  • Market trends
  • Five forces analysis

Quantitative

  • Market size and forecast
  • Market segmentation
  • Geographical insights
  • Competitive landscape

Interested in this report?

Get your sample now to see our research methodology and insights!

Download Now

Frequently Asked Questions

Picture Archiving And Communication System market growth will increase by USD 1449.0 million during 2026-2030.

The Picture Archiving And Communication System market is expected to grow at a CAGR of 5.8% during 2026-2030.

Picture Archiving And Communication System market is segmented by Product (Mid-end PACS, Enterprise PACS, Mini PACS) Application (Radiology PACS, Cardiology PACS, Pathology PACS) End-user (Hospitals and clinics, Diagnostic imaging centers, Ambulatory surgery centers, Others)

Agfa Gevaert NV, Carestream Health Inc., Dedalus Group, FUJIFILM Holdings Corp., GE HealthCare Technologies, Intelerad Medical Systems Inc., Konica Minolta Inc., Koninklijke Philips NV, medavis GmbH, Merative L.P., NovaRad Corp., Optum Inc., PaxeraHealth Corp., RamSoft Inc., ScImage Inc., Sectra AB, Siemens Healthineers AG, VISUS Health IT GmbH are a few of the key vendors in the Picture Archiving And Communication System market.

North America will register the highest growth rate of 48.1% among the other regions. Therefore, the Picture Archiving And Communication System market in North America is expected to garner significant business opportunities for the vendors during the forecast period.

US, Canada, Mexico, Germany, UK, France, Italy, Spain, The Netherlands, China, Japan, India, South Korea, Thailand, Indonesia, Brazil, Saudi Arabia, UAE, South Africa, Turkey, Argentina, Colombia, Israel

  • Accelerated integration of cloud-native medical imaging architectures is the driving factor this market.

The Picture Archiving And Communication System market vendors should focus on grabbing business opportunities from the Product segment as it accounted for the largest market share in the base year.
RIA - Research AI Assistant
Ask RIA