Pine Honey Market Analysis, Size, and Forecast 2026-2030: Middle East and Africa (Turkey, South Africa, and Saudi Arabia), Europe (Germany, France, and UK), North America (US, Canada, and Mexico), APAC (China, India, and Japan), South America (Brazil, Argentina, and Colombia), and Rest of World (ROW)

Pine Honey Market Analysis, Size, and Forecast 2026-2030:
Middle East and Africa (Turkey, South Africa, and Saudi Arabia), Europe (Germany, France, and UK), North America (US, Canada, and Mexico), APAC (China, India, and Japan), South America (Brazil, Argentina, and Colombia), and Rest of World (ROW)

Published: Jan 2026 281 Pages SKU: IRTNTR74032

Market Overview at a Glance

$63.3 Mn
Market Opportunity
4.7%
CAGR 2025 - 2030
54.8%
Middle East and Africa Growth
$221.4 Mn
Conventional pine honey segment 2024

Pine Honey Market Size 2026-2030

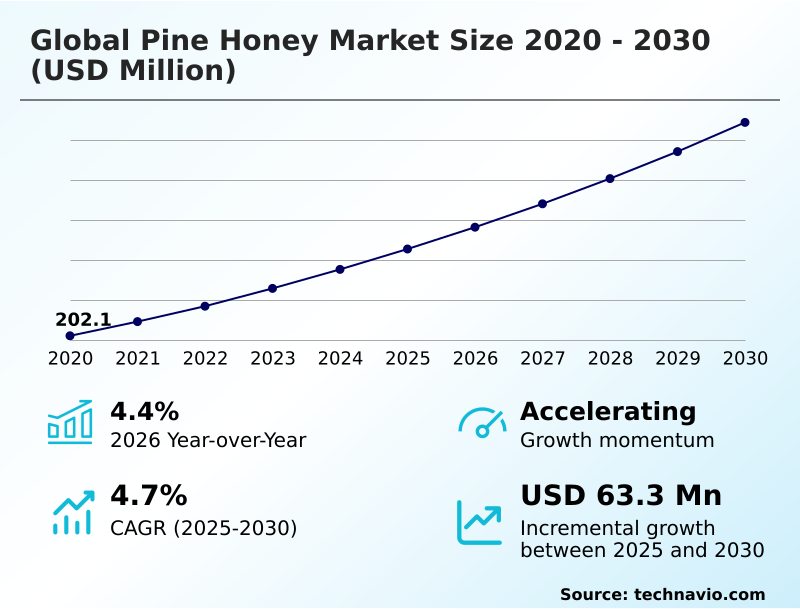
The pine honey market size is valued to increase by USD 63.3 million, at a CAGR of 4.7% from 2025 to 2030. Health benefits of pine honey will drive the pine honey market.

Major Market Trends & Insights

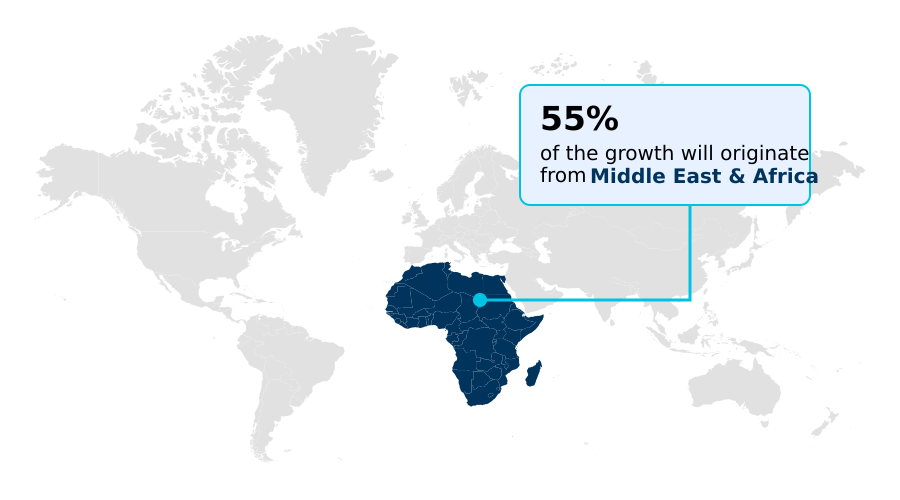
  • Middle East and Africa dominated the market and accounted for a 54.8% growth during the forecast period.
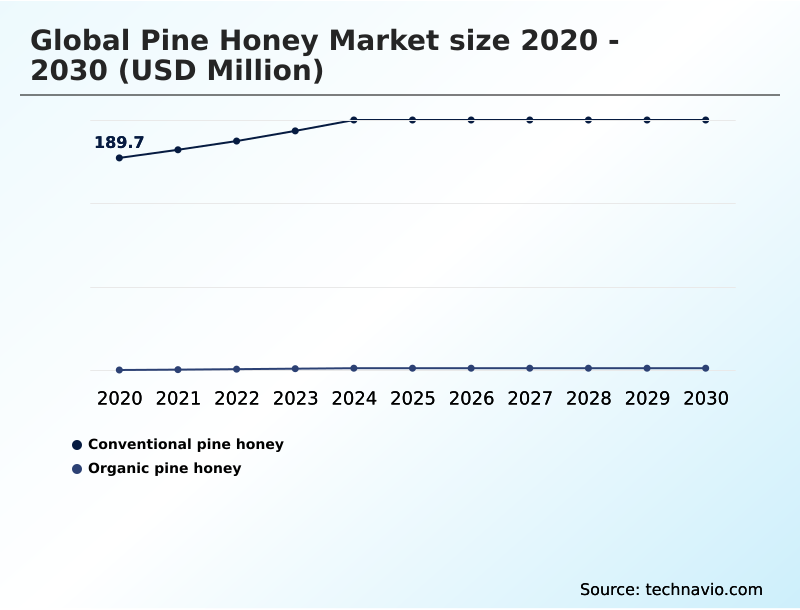
  • By Product - Conventional pine honey segment was valued at USD 221.4 million in 2024
  • By Application - Food and beverages segment accounted for the largest market revenue share in 2024

Market Size & Forecast

  • Market Opportunities: USD 106.7 million
  • Market Future Opportunities: USD 63.3 million
  • CAGR from 2025 to 2030 : 4.7%

Market Summary

  • The pine honey market is experiencing steady expansion, driven by growing consumer demand for natural, functional foods. As a single origin honey, its unique characteristics appeal to discerning buyers. The increasing adoption of plant-based diet further boosts its relevance as a vegan-friendly sweetener.
  • Key players are leveraging online honey sales to reach a broader audience, capitalizing on the convenience of e-commerce. However, the market is not without its difficulties. The geographically concentrated production, primarily of turkish pine honey and greek pine honey, creates supply chain risks. Competition from a honey substitute product and the complexities of food safety regulation also present significant hurdles.
  • A key business application involves food manufacturers replacing processed sugars with organic pine honey to meet clean-label demands. This reformulation strategy, while catering to the demand for a gluten-free sweetener, requires careful management of sourcing and cost to remain competitive against conventional ingredients and other medicinal honey types.

What will be the Size of the Pine Honey Market during the forecast period?

Get Key Insights on Market Forecast (PDF) Request Free Sample

How is the Pine Honey Market Segmented?

The pine honey industry research report provides comprehensive data (region-wise segment analysis), with forecasts and estimates in "USD million" for the period 2026-2030, as well as historical data from 2020-2024 for the following segments.

  • Product
    • Conventional pine honey
    • Organic pine honey
  • Application
    • Food and beverages
    • Food additives
    • Others
  • Packaging
    • Glass jars
    • Bulk containers
    • Plastic bottles
    • Others
  • Geography
    • Middle East and Africa
      • Turkey
      • South Africa
      • Saudi Arabia
    • Europe
      • Germany
      • France
      • UK
    • North America
      • US
      • Canada
      • Mexico
    • APAC
      • China
      • India
      • Japan
    • South America
      • Brazil
      • Argentina
      • Colombia
    • Rest of World (ROW)

By Product Insights

The conventional pine honey segment is estimated to witness significant growth during the forecast period.

The conventional pine honey segment dominates the market, primarily serving industrial food and beverage application sectors.

Its cost-effectiveness makes it the preferred choice for large-scale use in the food service industry, where it is often procured in a bulk honey container.

For retail channels, premium glass jar packaging is utilized to showcase its quality and appeal to consumers seeking its unique flavor profile.

This segment's growth is tied to its role as a functional ingredient, although it faces increasing competition from organic alternatives.

Production efficiency in this segment, especially for products destined for a food grade container, has improved by over 15% in recent years through optimized apiary management.

Request Free Sample

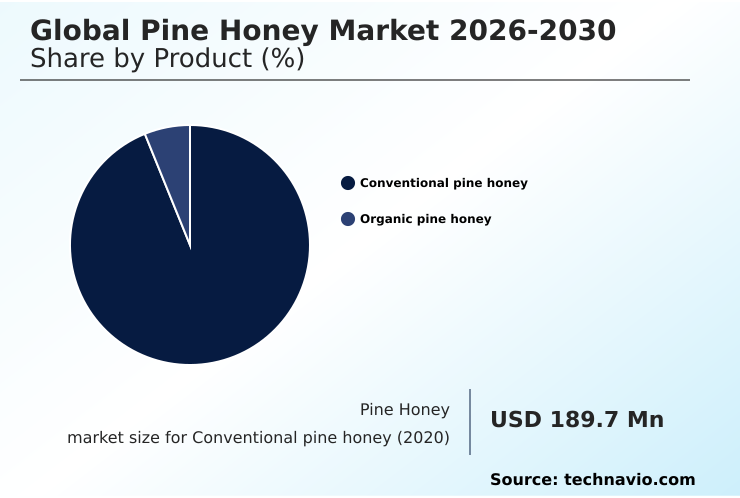
The Conventional pine honey segment was valued at USD 221.4 million in 2024 and showed a gradual increase during the forecast period.

Request Free Sample

Regional Analysis

Middle East and Africa is estimated to contribute 54.8% to the growth of the global market during the forecast period.Technavio’s analysts have elaborately explained the regional trends and drivers that shape the market during the forecast period.

See How Pine Honey Market Demand is Rising in Middle East and Africa Request Free Sample

International market dynamics are shaped by production hubs in the Middle East and Europe, which account for over 54% of incremental growth. Here, greek pine honey, often certified as organic pine honey, is highly valued.

Demand is expanding into North America and APAC, where it is marketed as a respiratory ailment remedy and a functional natural food additive. The use of pine honey in cosmetic formulation is also a growing niche.

Turkey remains the dominant producer, accounting for approximately 92% of the global supply, which heavily influences global pricing and availability. This concentration underscores the importance of stable production conditions for consistent supply.

Market Dynamics

Our researchers analyzed the data with 2025 as the base year, along with the key drivers, trends, and challenges. A holistic analysis of drivers will help companies refine their marketing strategies to gain a competitive advantage.

  • Strategic positioning in the global pine honey market 2026-2030 requires a deep understanding of multiple factors. Boardroom discussions often center on pine honey vs manuka honey for market entry, evaluating the marketing strategies for artisanal honey that emphasize unique selling points.
  • The health benefits of pine honey, especially its role as a natural remedy for using pine honey for cough and promoting pine honey for digestive health, are primary value propositions. For product development, pine honey antioxidant compound analysis is critical, as is adherence to organic pine honey certification standards.
  • From an operational perspective, mitigating the Global Pine Honey Market 2026-2030 supply chain challenges and understanding the effect of climate on honeydew production are paramount. Producers with robust systems for traceability in the honey market can achieve up to 20% faster approvals, ensuring regulatory compliance for honey imports.
  • The culinary uses for dark honey and its application as one of the natural sweeteners for clean labels drive its B2B demand. Determining the best pine honey brand for cooking involves assessing pine honey price premium factors and ingredient consistency.
  • Furthermore, its role in pine honey in plant based diets, pine honey in cosmetic formulations, and pine honey in nutraceutical formulations opens new growth avenues beyond traditional uses or as substitutes for pine honey in recipes.

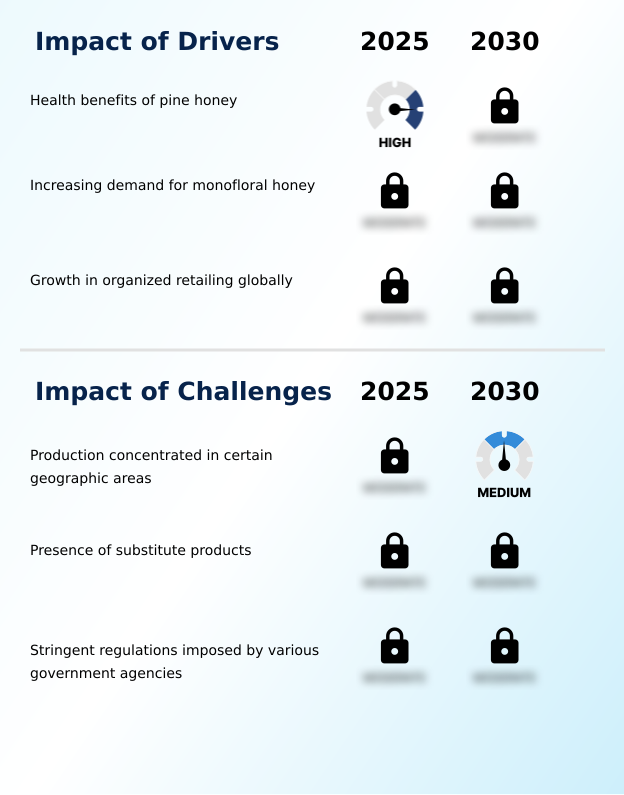
What are the key market drivers leading to the rise in the adoption of Pine Honey Industry?

  • The significant health benefits associated with pine honey, including its antioxidant and antimicrobial properties, serve as a primary driver for increasing consumer demand.

  • Demand for single origin honey is a key driver, with consumers willing to pay a 25% premium for products with certified provenance.
  • The perception of pine honey as a medicinal honey, valued for its high mineral content, strong antioxidant level, and natural sweetener properties, supports this premium positioning.
  • Its relatively low glycemic index also attracts health-conscious buyers seeking a functional food ingredient with a distinct trace mineral content.
  • The expansion of organized retail distribution has made these niche products more accessible, with supermarket chains dedicating up to 15% more shelf space to foods known for prebiotic action and containing beneficial compounds like polyphenolic antioxidants and the glucose oxidase enzyme.
  • This accessibility is crucial for market growth.

What are the market trends shaping the Pine Honey Industry?

  • A prominent market trend is the increasing consumer shift toward plant-based diets, which enhances demand for natural, non-animal-derived ingredients such as pine honey.

  • The rising adoption of a plant-based diet is a significant trend, positioning pine honey as a premium gourmet food ingredient and culinary ingredient in vegan cuisine. This shift has boosted online honey sales, with e-commerce platforms reporting a 20% higher engagement rate for specialty honeys, underscoring its appeal as an artisanal food product.
  • The demand for a natural gluten-free sweetener, with a low-calorie profile and vegan positioning, is expanding its use case. Furthermore, convenience-focused packaging like the squeezable honey bottle is gaining traction, increasing its presence in specialty food retail by making it more accessible for daily use.
  • Brands that effectively communicate their sustainability claim have seen market penetration increase by up to 30%, turning a niche item into a sought-after clean label ingredient.

What challenges does the Pine Honey Industry face during its growth?

  • A key market challenge is the high concentration of pine honey production in limited geographic areas, creating potential supply chain vulnerabilities and price instability.

  • The market for raw pine honey and unfiltered pine honey faces significant hurdles. The geographically concentrated production of turkish pine honey, reliant on the marchalina hellenica insect, exposes the global supply chain to regional climate risks, which can increase price volatility by up to 35% in a single season.
  • The proliferation of a honey substitute product, from other non-floral nectar sources to sweeteners for weight management food or diabetic friendly food, intensifies competition. Additionally, navigating stringent food safety regulation, including adulterant prohibition and rules governing apiary management, across different import markets adds an estimated 10% to compliance costs for producers.
  • This challenges firms aiming to market the unique dark amber color of their products.

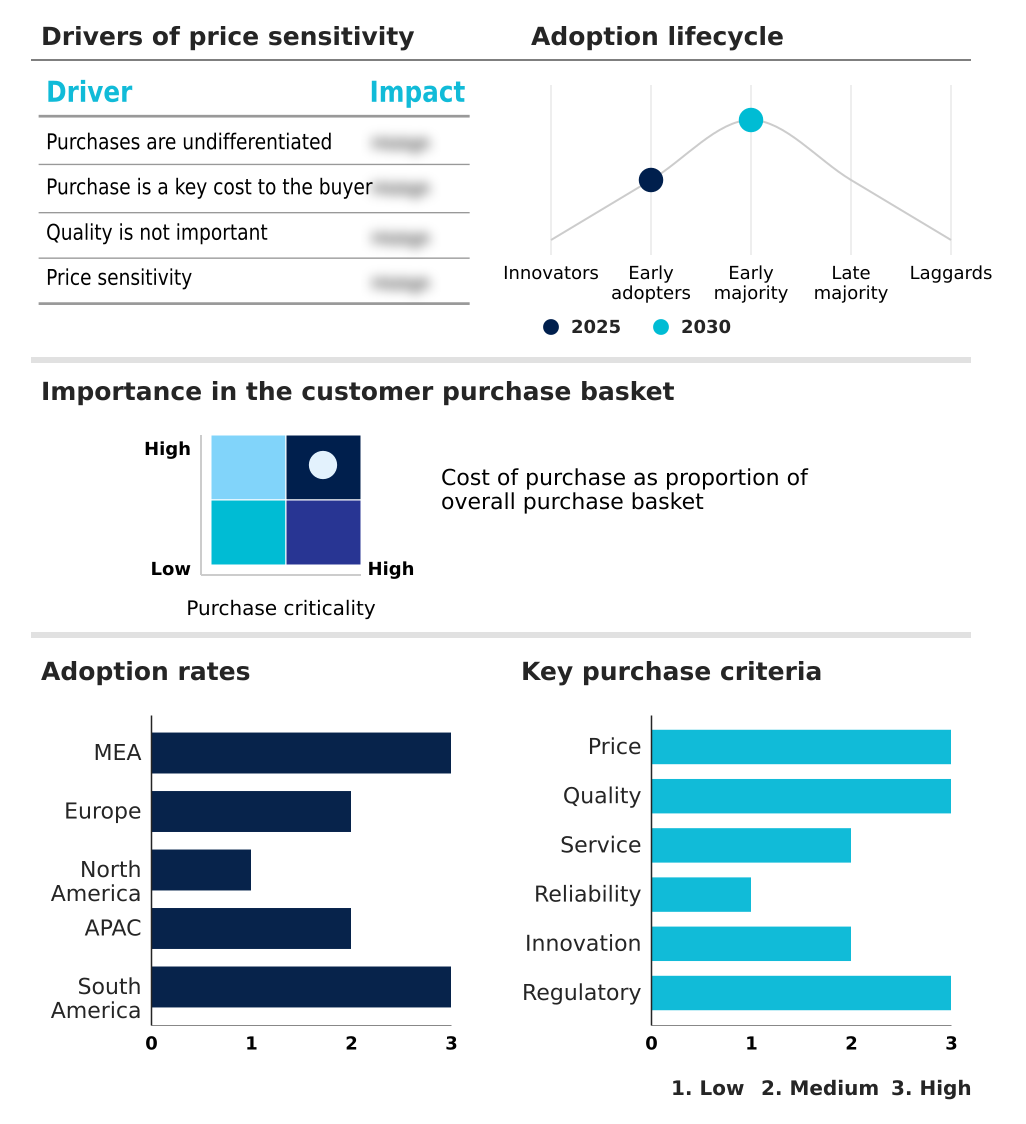
Exclusive Technavio Analysis on Customer Landscape

The pine honey market forecasting report includes the adoption lifecycle of the market, covering from the innovator’s stage to the laggard’s stage. It focuses on adoption rates in different regions based on penetration. Furthermore, the pine honey market report also includes key purchase criteria and drivers of price sensitivity to help companies evaluate and develop their market growth analysis strategies.

Customer Landscape of Pine Honey Industry

Competitive Landscape

Companies are implementing various strategies, such as strategic alliances, pine honey market forecast, partnerships, mergers and acquisitions, geographical expansion, and product/service launches, to enhance their presence in the industry.

Avaton Honey - Vendors provide mineral-rich honeydew honey, including raw and unfiltered pine variants, for diverse culinary, nutraceutical, and cosmetic applications.

The industry research and growth report includes detailed analyses of the competitive landscape of the market and information about key companies, including:

  • Avaton Honey
  • Buram GmbH
  • FromAnatolia
  • Iliaki Melissokomia
  • Manavlar Gıda
  • Nirra Co.
  • Queenscent Honey Products
  • Si Mel Savidakis and Co.
  • Smari Honey
  • THASSOS
  • The Monk Honey

Qualitative and quantitative analysis of companies has been conducted to help clients understand the wider business environment as well as the strengths and weaknesses of key industry players. Data is qualitatively analyzed to categorize companies as pure play, category-focused, industry-focused, and diversified; it is quantitatively analyzed to categorize companies as dominant, leading, strong, tentative, and weak.

Recent Development and News in Pine honey market

  • In September 2024, Smari Honey announced the launch of its 'Cretan Reserve' line, a certified organic pine honey aged for six months to enhance its flavor profile, targeting the premium North American gourmet market.
  • In November 2024, Manavlar Gıda entered a strategic distribution partnership with a leading European specialty food importer to expand the reach of its Turkish pine honey into Germany and France, aiming to triple its export volume to the region by 2026.
  • In February 2025, a major global agri-food corporation acquired a 75% stake in The Monk Honey, a prominent Greek producer, for an undisclosed sum, signaling a strategic move into the high-value functional honey market.
  • In April 2025, Avaton Honey successfully implemented a blockchain-based traceability platform, providing consumers with verifiable proof of origin and purity for its pine honey products via a QR code on each jar, a first in the Greek honey market.

Dive into Technavio’s robust research methodology, blending expert interviews, extensive data synthesis, and validated models for unparalleled Pine Honey Market insights. See full methodology.

Market Scope
Page number 281
Base year 2025
Historic period 2020-2024
Forecast period 2026-2030
Growth momentum & CAGR Accelerate at a CAGR of 4.7%
Market growth 2026-2030 USD 63.3 million
Market structure Concentrated
YoY growth 2025-2026(%) 4.4%
Key countries Turkey, South Africa, Saudi Arabia, UAE, Egypt, Germany, France, UK, Italy, Spain, The Netherlands, US, Canada, Mexico, China, India, Japan, South Korea, Australia, Indonesia, Brazil, Argentina and Colombia
Competitive landscape Leading Companies, Market Positioning of Companies, Competitive Strategies, and Industry Risks

Request Free Sample

Research Analyst Overview

  • The market's foundation is the unique production of honeydew honey, a type of monofloral honey originating from the honeydew secretion of the marchalina hellenica insect, rather than from non-floral nectar. The entire value chain, from apiary management to the final food grade container, is governed by the need to preserve its inherent qualities.
  • The product's value is derived from its resinous flavor profile, dark amber color, and low crystallization tendency, which are outcomes of a natural enzymatic process. Boardroom decisions increasingly focus on leveraging its composition, which includes a natural sugar compound of oligosaccharides, providing prebiotic action.
  • The presence of the glucose oxidase enzyme delivers antimicrobial properties, while a high trace mineral content and polyphenolic antioxidants make it a prime functional food ingredient and nutraceutical application. To secure a premium sweetener status, adherence to the protected designation of origin and strict compositional requirement, including adulterant prohibition, is critical.
  • Brands are adopting a sustainability claim and vegan positioning to align with consumer values, marketing the product as a clean label ingredient and a gourmet spread. The low-calorie profile also makes it relevant for weight management food and diabetic friendly food, distinguishing this artisanal food product from other natural sweeteners.

What are the Key Data Covered in this Pine Honey Market Research and Growth Report?

  • What is the expected growth of the Pine Honey Market between 2026 and 2030?

    • USD 63.3 million, at a CAGR of 4.7%

  • What segmentation does the market report cover?

    • The report is segmented by Product (Conventional pine honey, and Organic pine honey), Application (Food and beverages, Food additives, and Others), Packaging (Glass jars, Bulk containers, Plastic bottles, and Others) and Geography (Middle East and Africa, Europe, North America, APAC, South America)

  • Which regions are analyzed in the report?

    • Middle East and Africa, Europe, North America, APAC and South America

  • What are the key growth drivers and market challenges?

    • Health benefits of pine honey, Production concentrated in certain geographic areas

  • Who are the major players in the Pine Honey Market?

    • Avaton Honey, Buram GmbH, FromAnatolia, Iliaki Melissokomia, Manavlar Gıda, Nirra Co., Queenscent Honey Products, Si Mel Savidakis and Co., Smari Honey, THASSOS and The Monk Honey

Market Research Insights

  • Market dynamics are increasingly shaped by consumer demand for premium attributes. For instance, certified organic pine honey often commands a price premium of over 40% compared to conventional alternatives. The adoption of single origin honey as a gourmet food ingredient in the food service industry has grown, with high-end establishments showing a 25% higher adoption rate for unique sweeteners.
  • This is partly due to its low glycemic index, which appeals to health-conscious diners. These factors underscore a strategic shift where product differentiation through quality, origin, and health benefits directly translates into enhanced market positioning and greater pricing power for producers.

We can help! Our analysts can customize this pine honey market research report to meet your requirements.

Get in touch

1. Executive Summary

1.1 Market overview

Executive Summary - Chart on Market Overview
Executive Summary - Data Table on Market Overview
Executive Summary - Chart on Global Market Characteristics
Executive Summary - Chart on Market by Geography
Executive Summary - Chart on Market Segmentation by Product
Executive Summary - Chart on Market Segmentation by Application
Executive Summary - Chart on Market Segmentation by Packaging
Executive Summary - Chart on Incremental Growth
Executive Summary - Data Table on Incremental Growth
Executive Summary - Chart on Company Market Positioning

2. Technavio Analysis

2.1 Analysis of price sensitivity, lifecycle, customer purchase basket, adoption rates, and purchase criteria

2.2 Criticality of inputs and Factors of differentiation

Chart on Overview on criticality of inputs and factors of differentiation

2.3 Factors of disruption

Chart on Overview on factors of disruption

2.4 Impact of drivers and challenges

Chart on Impact of drivers and challenges in 2025 and 2030

3. Market Landscape

3.1 Market ecosystem

Chart on Parent Market
Data Table on - Parent Market

3.2 Market characteristics

Chart on Market characteristics analysis

3.3 Value chain analysis

Chart on Value chain analysis

4. Market Sizing

4.1 Market definition

Data Table on Offerings of companies included in the market definition

4.2 Market segment analysis

Market segments

4.3 Market size 2025

4.4 Market outlook: Forecast for 2025-2030

Chart on Global - Market size and forecast 2025-2030 ($ million)
Data Table on Global - Market size and forecast 2025-2030 ($ million)
Chart on Global Market: Year-over-year growth 2025-2030 (%)
Data Table on Global Market: Year-over-year growth 2025-2030 (%)

5. Historic Market Size

5.1 Global Pine Honey Market 2020 - 2024

Historic Market Size - Data Table on Global Pine Honey Market 2020 - 2024 ($ million)

5.2 Product segment analysis 2020 - 2024

Historic Market Size - Product Segment 2020 - 2024 ($ million)

5.3 Application segment analysis 2020 - 2024

Historic Market Size - Application Segment 2020 - 2024 ($ million)

5.4 Packaging segment analysis 2020 - 2024

Historic Market Size - Packaging Segment 2020 - 2024 ($ million)

5.5 Geography segment analysis 2020 - 2024

Historic Market Size - Geography Segment 2020 - 2024 ($ million)

5.6 Country segment analysis 2020 - 2024

Historic Market Size - Country Segment 2020 - 2024 ($ million)

6. Qualitative Analysis

6.1 The AI impact on Global Pine Honey Market

7. Five Forces Analysis

7.1 Five forces summary

Five forces analysis - Comparison between 2025 and 2030

7.2 Bargaining power of buyers

Bargaining power of buyers - Impact of key factors 2025 and 2030

7.3 Bargaining power of suppliers

Bargaining power of suppliers - Impact of key factors in 2025 and 2030

7.4 Threat of new entrants

Threat of new entrants - Impact of key factors in 2025 and 2030

7.5 Threat of substitutes

Threat of substitutes - Impact of key factors in 2025 and 2030

7.6 Threat of rivalry

Threat of rivalry - Impact of key factors in 2025 and 2030

7.7 Market condition

Chart on Market condition - Five forces 2025 and 2030

8. Market Segmentation by Product

8.1 Market segments

Chart on Product - Market share 2025-2030 (%)
Data Table on Product - Market share 2025-2030 (%)

8.2 Comparison by Product

Chart on Comparison by Product
Data Table on Comparison by Product

8.3 Conventional pine honey - Market size and forecast 2025-2030

Chart on Conventional pine honey - Market size and forecast 2025-2030 ($ million)
Data Table on Conventional pine honey - Market size and forecast 2025-2030 ($ million)
Chart on Conventional pine honey - Year-over-year growth 2025-2030 (%)
Data Table on Conventional pine honey - Year-over-year growth 2025-2030 (%)

8.4 Organic pine honey - Market size and forecast 2025-2030

Chart on Organic pine honey - Market size and forecast 2025-2030 ($ million)
Data Table on Organic pine honey - Market size and forecast 2025-2030 ($ million)
Chart on Organic pine honey - Year-over-year growth 2025-2030 (%)
Data Table on Organic pine honey - Year-over-year growth 2025-2030 (%)

8.5 Market opportunity by Product

Market opportunity by Product ($ million)
Data Table on Market opportunity by Product ($ million)

9. Market Segmentation by Application

9.1 Market segments

Chart on Application - Market share 2025-2030 (%)
Data Table on Application - Market share 2025-2030 (%)

9.2 Comparison by Application

Chart on Comparison by Application
Data Table on Comparison by Application

9.3 Food and beverages - Market size and forecast 2025-2030

Chart on Food and beverages - Market size and forecast 2025-2030 ($ million)
Data Table on Food and beverages - Market size and forecast 2025-2030 ($ million)
Chart on Food and beverages - Year-over-year growth 2025-2030 (%)
Data Table on Food and beverages - Year-over-year growth 2025-2030 (%)

9.4 Food additives - Market size and forecast 2025-2030

Chart on Food additives - Market size and forecast 2025-2030 ($ million)
Data Table on Food additives - Market size and forecast 2025-2030 ($ million)
Chart on Food additives - Year-over-year growth 2025-2030 (%)
Data Table on Food additives - Year-over-year growth 2025-2030 (%)

9.5 Others - Market size and forecast 2025-2030

Chart on Others - Market size and forecast 2025-2030 ($ million)
Data Table on Others - Market size and forecast 2025-2030 ($ million)
Chart on Others - Year-over-year growth 2025-2030 (%)
Data Table on Others - Year-over-year growth 2025-2030 (%)

9.6 Market opportunity by Application

Market opportunity by Application ($ million)
Data Table on Market opportunity by Application ($ million)

10. Market Segmentation by Packaging

10.1 Market segments

Chart on Packaging - Market share 2025-2030 (%)
Data Table on Packaging - Market share 2025-2030 (%)

10.2 Comparison by Packaging

Chart on Comparison by Packaging
Data Table on Comparison by Packaging

10.3 Glass jars - Market size and forecast 2025-2030

Chart on Glass jars - Market size and forecast 2025-2030 ($ million)
Data Table on Glass jars - Market size and forecast 2025-2030 ($ million)
Chart on Glass jars - Year-over-year growth 2025-2030 (%)
Data Table on Glass jars - Year-over-year growth 2025-2030 (%)

10.4 Bulk containers - Market size and forecast 2025-2030

Chart on Bulk containers - Market size and forecast 2025-2030 ($ million)
Data Table on Bulk containers - Market size and forecast 2025-2030 ($ million)
Chart on Bulk containers - Year-over-year growth 2025-2030 (%)
Data Table on Bulk containers - Year-over-year growth 2025-2030 (%)

10.5 Plastic bottles - Market size and forecast 2025-2030

Chart on Plastic bottles - Market size and forecast 2025-2030 ($ million)
Data Table on Plastic bottles - Market size and forecast 2025-2030 ($ million)
Chart on Plastic bottles - Year-over-year growth 2025-2030 (%)
Data Table on Plastic bottles - Year-over-year growth 2025-2030 (%)

10.6 Others - Market size and forecast 2025-2030

Chart on Others - Market size and forecast 2025-2030 ($ million)
Data Table on Others - Market size and forecast 2025-2030 ($ million)
Chart on Others - Year-over-year growth 2025-2030 (%)
Data Table on Others - Year-over-year growth 2025-2030 (%)

10.7 Market opportunity by Packaging

Market opportunity by Packaging ($ million)
Data Table on Market opportunity by Packaging ($ million)

11. Customer Landscape

11.1 Customer landscape overview

Analysis of price sensitivity, lifecycle, customer purchase basket, adoption rates, and purchase criteria

12. Geographic Landscape

12.1 Geographic segmentation

Chart on Market share by geography 2025-2030 (%)
Data Table on Market share by geography 2025-2030 (%)

12.2 Geographic comparison

Chart on Geographic comparison
Data Table on Geographic comparison

12.3 Middle East and Africa - Market size and forecast 2025-2030

Chart on Middle East and Africa - Market size and forecast 2025-2030 ($ million)
Data Table on Middle East and Africa - Market size and forecast 2025-2030 ($ million)
Chart on Middle East and Africa - Year-over-year growth 2025-2030 (%)
Data Table on Middle East and Africa - Year-over-year growth 2025-2030 (%)
Chart on Regional Comparison - Middle East and Africa
Data Table on Regional Comparison - Middle East and Africa

12.3.1 Turkey - Market size and forecast 2025-2030

Chart on Turkey - Market size and forecast 2025-2030 ($ million)
Data Table on Turkey - Market size and forecast 2025-2030 ($ million)
Chart on Turkey - Year-over-year growth 2025-2030 (%)
Data Table on Turkey - Year-over-year growth 2025-2030 (%)

12.3.2 South Africa - Market size and forecast 2025-2030

Chart on South Africa - Market size and forecast 2025-2030 ($ million)
Data Table on South Africa - Market size and forecast 2025-2030 ($ million)
Chart on South Africa - Year-over-year growth 2025-2030 (%)
Data Table on South Africa - Year-over-year growth 2025-2030 (%)

12.3.3 Saudi Arabia - Market size and forecast 2025-2030

Chart on Saudi Arabia - Market size and forecast 2025-2030 ($ million)
Data Table on Saudi Arabia - Market size and forecast 2025-2030 ($ million)
Chart on Saudi Arabia - Year-over-year growth 2025-2030 (%)
Data Table on Saudi Arabia - Year-over-year growth 2025-2030 (%)

12.3.4 UAE - Market size and forecast 2025-2030

Chart on UAE - Market size and forecast 2025-2030 ($ million)
Data Table on UAE - Market size and forecast 2025-2030 ($ million)
Chart on UAE - Year-over-year growth 2025-2030 (%)
Data Table on UAE - Year-over-year growth 2025-2030 (%)

12.3.5 Egypt - Market size and forecast 2025-2030

Chart on Egypt - Market size and forecast 2025-2030 ($ million)
Data Table on Egypt - Market size and forecast 2025-2030 ($ million)
Chart on Egypt - Year-over-year growth 2025-2030 (%)
Data Table on Egypt - Year-over-year growth 2025-2030 (%)

12.4 Europe - Market size and forecast 2025-2030

Chart on Europe - Market size and forecast 2025-2030 ($ million)
Data Table on Europe - Market size and forecast 2025-2030 ($ million)
Chart on Europe - Year-over-year growth 2025-2030 (%)
Data Table on Europe - Year-over-year growth 2025-2030 (%)
Chart on Regional Comparison - Europe
Data Table on Regional Comparison - Europe

12.4.1 Germany - Market size and forecast 2025-2030

Chart on Germany - Market size and forecast 2025-2030 ($ million)
Data Table on Germany - Market size and forecast 2025-2030 ($ million)
Chart on Germany - Year-over-year growth 2025-2030 (%)
Data Table on Germany - Year-over-year growth 2025-2030 (%)

12.4.2 France - Market size and forecast 2025-2030

Chart on France - Market size and forecast 2025-2030 ($ million)
Data Table on France - Market size and forecast 2025-2030 ($ million)
Chart on France - Year-over-year growth 2025-2030 (%)
Data Table on France - Year-over-year growth 2025-2030 (%)

12.4.3 UK - Market size and forecast 2025-2030

Chart on UK - Market size and forecast 2025-2030 ($ million)
Data Table on UK - Market size and forecast 2025-2030 ($ million)
Chart on UK - Year-over-year growth 2025-2030 (%)
Data Table on UK - Year-over-year growth 2025-2030 (%)

12.4.4 Italy - Market size and forecast 2025-2030

Chart on Italy - Market size and forecast 2025-2030 ($ million)
Data Table on Italy - Market size and forecast 2025-2030 ($ million)
Chart on Italy - Year-over-year growth 2025-2030 (%)
Data Table on Italy - Year-over-year growth 2025-2030 (%)

12.4.5 Spain - Market size and forecast 2025-2030

Chart on Spain - Market size and forecast 2025-2030 ($ million)
Data Table on Spain - Market size and forecast 2025-2030 ($ million)
Chart on Spain - Year-over-year growth 2025-2030 (%)
Data Table on Spain - Year-over-year growth 2025-2030 (%)

12.4.6 The Netherlands - Market size and forecast 2025-2030

Chart on The Netherlands - Market size and forecast 2025-2030 ($ million)
Data Table on The Netherlands - Market size and forecast 2025-2030 ($ million)
Chart on The Netherlands - Year-over-year growth 2025-2030 (%)
Data Table on The Netherlands - Year-over-year growth 2025-2030 (%)

12.5 North America - Market size and forecast 2025-2030

Chart on North America - Market size and forecast 2025-2030 ($ million)
Data Table on North America - Market size and forecast 2025-2030 ($ million)
Chart on North America - Year-over-year growth 2025-2030 (%)
Data Table on North America - Year-over-year growth 2025-2030 (%)
Chart on Regional Comparison - North America
Data Table on Regional Comparison - North America

12.5.1 US - Market size and forecast 2025-2030

Chart on US - Market size and forecast 2025-2030 ($ million)
Data Table on US - Market size and forecast 2025-2030 ($ million)
Chart on US - Year-over-year growth 2025-2030 (%)
Data Table on US - Year-over-year growth 2025-2030 (%)

12.5.2 Canada - Market size and forecast 2025-2030

Chart on Canada - Market size and forecast 2025-2030 ($ million)
Data Table on Canada - Market size and forecast 2025-2030 ($ million)
Chart on Canada - Year-over-year growth 2025-2030 (%)
Data Table on Canada - Year-over-year growth 2025-2030 (%)

12.5.3 Mexico - Market size and forecast 2025-2030

Chart on Mexico - Market size and forecast 2025-2030 ($ million)
Data Table on Mexico - Market size and forecast 2025-2030 ($ million)
Chart on Mexico - Year-over-year growth 2025-2030 (%)
Data Table on Mexico - Year-over-year growth 2025-2030 (%)

12.6 APAC - Market size and forecast 2025-2030

Chart on APAC - Market size and forecast 2025-2030 ($ million)
Data Table on APAC - Market size and forecast 2025-2030 ($ million)
Chart on APAC - Year-over-year growth 2025-2030 (%)
Data Table on APAC - Year-over-year growth 2025-2030 (%)
Chart on Regional Comparison - APAC
Data Table on Regional Comparison - APAC

12.6.1 China - Market size and forecast 2025-2030

Chart on China - Market size and forecast 2025-2030 ($ million)
Data Table on China - Market size and forecast 2025-2030 ($ million)
Chart on China - Year-over-year growth 2025-2030 (%)
Data Table on China - Year-over-year growth 2025-2030 (%)

12.6.2 India - Market size and forecast 2025-2030

Chart on India - Market size and forecast 2025-2030 ($ million)
Data Table on India - Market size and forecast 2025-2030 ($ million)
Chart on India - Year-over-year growth 2025-2030 (%)
Data Table on India - Year-over-year growth 2025-2030 (%)

12.6.3 Japan - Market size and forecast 2025-2030

Chart on Japan - Market size and forecast 2025-2030 ($ million)
Data Table on Japan - Market size and forecast 2025-2030 ($ million)
Chart on Japan - Year-over-year growth 2025-2030 (%)
Data Table on Japan - Year-over-year growth 2025-2030 (%)

12.6.4 South Korea - Market size and forecast 2025-2030

Chart on South Korea - Market size and forecast 2025-2030 ($ million)
Data Table on South Korea - Market size and forecast 2025-2030 ($ million)
Chart on South Korea - Year-over-year growth 2025-2030 (%)
Data Table on South Korea - Year-over-year growth 2025-2030 (%)

12.6.5 Australia - Market size and forecast 2025-2030

Chart on Australia - Market size and forecast 2025-2030 ($ million)
Data Table on Australia - Market size and forecast 2025-2030 ($ million)
Chart on Australia - Year-over-year growth 2025-2030 (%)
Data Table on Australia - Year-over-year growth 2025-2030 (%)

12.6.6 Indonesia - Market size and forecast 2025-2030

Chart on Indonesia - Market size and forecast 2025-2030 ($ million)
Data Table on Indonesia - Market size and forecast 2025-2030 ($ million)
Chart on Indonesia - Year-over-year growth 2025-2030 (%)
Data Table on Indonesia - Year-over-year growth 2025-2030 (%)

12.7 South America - Market size and forecast 2025-2030

Chart on South America - Market size and forecast 2025-2030 ($ million)
Data Table on South America - Market size and forecast 2025-2030 ($ million)
Chart on South America - Year-over-year growth 2025-2030 (%)
Data Table on South America - Year-over-year growth 2025-2030 (%)
Chart on Regional Comparison - South America
Data Table on Regional Comparison - South America

12.7.1 Brazil - Market size and forecast 2025-2030

Chart on Brazil - Market size and forecast 2025-2030 ($ million)
Data Table on Brazil - Market size and forecast 2025-2030 ($ million)
Chart on Brazil - Year-over-year growth 2025-2030 (%)
Data Table on Brazil - Year-over-year growth 2025-2030 (%)

12.7.2 Argentina - Market size and forecast 2025-2030

Chart on Argentina - Market size and forecast 2025-2030 ($ million)
Data Table on Argentina - Market size and forecast 2025-2030 ($ million)
Chart on Argentina - Year-over-year growth 2025-2030 (%)
Data Table on Argentina - Year-over-year growth 2025-2030 (%)

12.7.3 Colombia - Market size and forecast 2025-2030

Chart on Colombia - Market size and forecast 2025-2030 ($ million)
Data Table on Colombia - Market size and forecast 2025-2030 ($ million)
Chart on Colombia - Year-over-year growth 2025-2030 (%)
Data Table on Colombia - Year-over-year growth 2025-2030 (%)

12.8 Market opportunity by geography

Market opportunity by geography ($ million)
Data Tables on Market opportunity by geography ($ million)

13. Drivers, Challenges, and Opportunity

13.1 Market drivers

Health benefits of pine honey
Increasing demand for monofloral honey
Growth in organized retailing globally

13.2 Market challenges

Production concentrated in certain geographic areas
Presence of substitute products
Stringent regulations imposed by various government agencies

13.3 Impact of drivers and challenges

Impact of drivers and challenges in 2025 and 2030

13.4 Market opportunities

Increasing popularity of plant-based food products
Increasing focus on online sales of pine honey products
Increasing awareness about gluten-free food products

14. Competitive Landscape

14.1 Overview

14.2

Overview on criticality of inputs and factors of differentiation

14.3 Landscape disruption

Overview on factors of disruption

14.4 Industry risks

Impact of key risks on business

15. Competitive Analysis

15.1 Companies profiled

Companies covered

15.2 Company ranking index

15.3 Market positioning of companies

Matrix on companies position and classification

15.4 Avaton Honey

Avaton Honey - Overview
Avaton Honey - Product / Service
Avaton Honey - Key offerings
SWOT

15.5 Buram GmbH

Buram GmbH - Overview
Buram GmbH - Product / Service
Buram GmbH - Key offerings
SWOT

15.6 FromAnatolia

FromAnatolia - Overview
FromAnatolia - Product / Service
FromAnatolia - Key offerings
SWOT

15.7 Iliaki Melissokomia

Iliaki Melissokomia - Overview
Iliaki Melissokomia - Product / Service
Iliaki Melissokomia - Key offerings
SWOT

15.8 Manavlar Gıda

Manavlar Gıda - Overview
Manavlar Gıda - Product / Service
Manavlar Gıda - Key offerings
SWOT

15.9 Nirra Co.

Nirra Co. - Overview
Nirra Co. - Product / Service
Nirra Co. - Key offerings
SWOT

15.10 Queenscent Honey Products

Queenscent Honey Products - Overview
Queenscent Honey Products - Product / Service
Queenscent Honey Products - Key offerings
SWOT

15.11 Si Mel Savidakis and Co.

Si Mel Savidakis and Co. - Overview
Si Mel Savidakis and Co. - Product / Service
Si Mel Savidakis and Co. - Key offerings
SWOT

15.12 Smari Honey

Smari Honey - Overview
Smari Honey - Product / Service
Smari Honey - Key offerings
SWOT

15.13 THASSOS

THASSOS - Overview
THASSOS - Product / Service
THASSOS - Key offerings
SWOT

15.14 The Monk Honey

The Monk Honey - Overview
The Monk Honey - Product / Service
The Monk Honey - Key offerings
SWOT

16. Appendix

16.1 Scope of the report

Market definition
Objectives
Notes and caveats

16.2 Inclusions and exclusions checklist

Inclusions checklist
Exclusions checklist

16.3 Currency conversion rates for US$

16.4 Research methodology

16.5 Data procurement

Information sources

16.6 Data validation

16.7 Validation techniques employed for market sizing

16.8 Data synthesis

16.9 360 degree market analysis

16.10 List of abbreviations

Research Methodology

Technavio presents a detailed picture of the market by way of study, synthesis, and summation of data from multiple sources. The analysts have presented the various facets of the market with a particular focus on identifying the key industry influencers. The data thus presented is comprehensive, reliable, and the result of extensive research, both primary and secondary.

INFORMATION SOURCES

Primary sources

  • Manufacturers and suppliers
  • Channel partners
  • Industry experts
  • Strategic decision makers

Secondary sources

  • Industry journals and periodicals
  • Government data
  • Financial reports of key industry players
  • Historical data
  • Press releases

DATA ANALYSIS

Data Synthesis

  • Collation of data
  • Estimation of key figures
  • Analysis of derived insights

Data Validation

  • Triangulation with data models
  • Reference against proprietary databases
  • Corroboration with industry experts

REPORT WRITING

Qualitative

  • Market drivers
  • Market challenges
  • Market trends
  • Five forces analysis

Quantitative

  • Market size and forecast
  • Market segmentation
  • Geographical insights
  • Competitive landscape

Interested in this report?

Get your sample now to see our research methodology and insights!

Download Now

Frequently Asked Questions

Pine Honey market growth will increase by USD 63.3 million during 2026-2030.

The Pine Honey market is expected to grow at a CAGR of 4.7% during 2026-2030.

Pine Honey market is segmented by Product (Conventional pine honey, Organic pine honey) Application (Food and beverages, Food additives, Others) Packaging (Glass jars, Bulk containers, Plastic bottles, Others)

Avaton Honey, Buram GmbH, FromAnatolia, Iliaki Melissokomia, Manavlar Gıda, Nirra Co., Queenscent Honey Products, Si Mel Savidakis and Co., Smari Honey, THASSOS, The Monk Honey are a few of the key vendors in the Pine Honey market.

Middle East and Africa will register the highest growth rate of 54.8% among the other regions. Therefore, the Pine Honey market in Middle East and Africa is expected to garner significant business opportunities for the vendors during the forecast period.

Turkey, South Africa, Saudi Arabia, UAE, Egypt, Germany, France, UK, Italy, Spain, The Netherlands, US, Canada, Mexico, China, India, Japan, South Korea, Australia, Indonesia, Brazil, Argentina, Colombia

  • Health benefits of pine honey is the driving factor this market.

The Pine Honey market vendors should focus on grabbing business opportunities from the Product segment as it accounted for the largest market share in the base year.