Pipeline Integrity Management Market Analysis, Size, and Forecast 2026-2030: North America (US, Canada, and Mexico), APAC (China, Japan, and India), Europe (Germany, UK, and France), Middle East and Africa (Saudi Arabia, UAE, and South Africa), South America (Brazil, Argentina, and Colombia), and Rest of World (ROW)

Pipeline Integrity Management Market Analysis, Size, and Forecast 2026-2030:
North America (US, Canada, and Mexico), APAC (China, Japan, and India), Europe (Germany, UK, and France), Middle East and Africa (Saudi Arabia, UAE, and South Africa), South America (Brazil, Argentina, and Colombia), and Rest of World (ROW)

Published: Jan 2026 296 Pages SKU: IRTNTR72149

Market Overview at a Glance

$2.60 B
Market Opportunity
4.9%
CAGR 2025 - 2030
35.8%
North America Growth
$
Onshore segment 2024

Pipeline Integrity Management Market Size 2026-2030

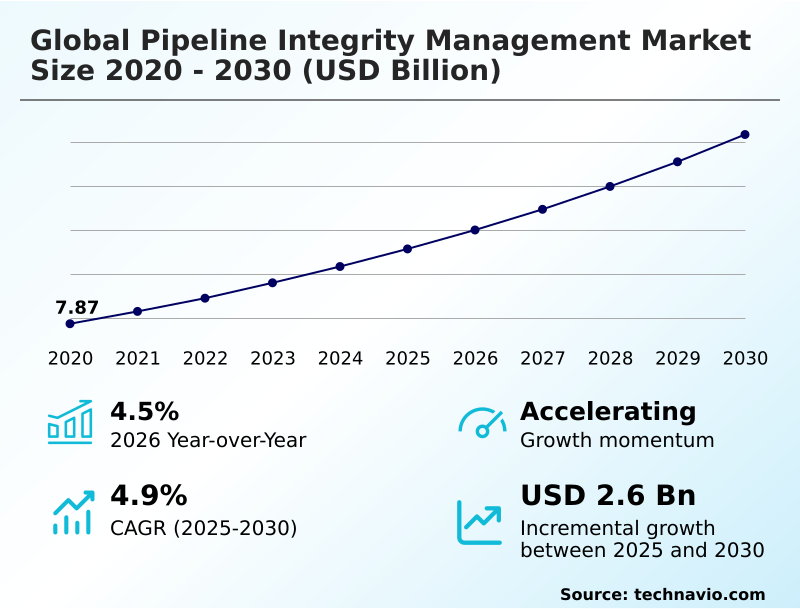
The pipeline integrity management market size is valued to increase by USD 2.60 billion, at a CAGR of 4.9% from 2025 to 2030. Stringent regulatory requirements associated with pipeline integrity management will drive the pipeline integrity management market.

Major Market Trends & Insights

  • North America dominated the market and accounted for a 35.8% growth during the forecast period.
  • By Deployment - Onshore segment was valued at in 2024
  • By Service - Inspection service segment accounted for the largest market revenue share in 2024

Market Size & Forecast

  • Market Opportunities: USD 4.30 billion
  • Market Future Opportunities: USD 2.60 billion
  • CAGR from 2025 to 2030 : 4.9%

Market Summary

  • The pipeline integrity management market is fundamentally shaped by the need to ensure the safety and reliability of critical energy infrastructure. A primary driver is stringent regulatory compliance management, which compels operators to invest in advanced technologies for risk mitigation.
  • Key trends revolve around digitalization, where digital twin technology and sophisticated pipeline data analytics are transforming reactive maintenance into proactive strategies. For instance, an operator of an aging network can leverage predictive maintenance models derived from ongoing corrosion monitoring and pipeline strain monitoring to optimize capital expenditure.
  • By employing risk-based inspection (RBI), the firm can prioritize which segments require immediate intervention, such as hydrostatic testing or material property verification, thereby enhancing safety while managing costs effectively. However, the industry grapples with the persistent challenge of stress corrosion cracking (SCC) and the complexities of inspecting assets with unpiggable pipeline solutions.
  • This dynamic landscape fosters continuous innovation in non-destructive testing (NDT) and leak detection systems to maintain operational resilience.

What will be the Size of the Pipeline Integrity Management Market during the forecast period?

Get Key Insights on Market Forecast (PDF) Request Free Sample

How is the Pipeline Integrity Management Market Segmented?

The pipeline integrity management industry research report provides comprehensive data (region-wise segment analysis), with forecasts and estimates in "USD million" for the period 2026-2030, as well as historical data from 2020-2024 for the following segments.

  • Deployment
    • Onshore
    • Offshore
  • Service
    • Inspection service
    • Cleaning service
    • Others
  • Type
    • Crude oil
    • Natural gas
    • Refined products
    • LNG
  • Geography
    • North America
      • US
      • Canada
      • Mexico
    • APAC
      • China
      • Japan
      • India
    • Europe
      • Germany
      • UK
      • France
    • Middle East and Africa
      • Saudi Arabia
      • UAE
      • South Africa
    • South America
      • Brazil
      • Argentina
      • Colombia
    • Rest of World (ROW)

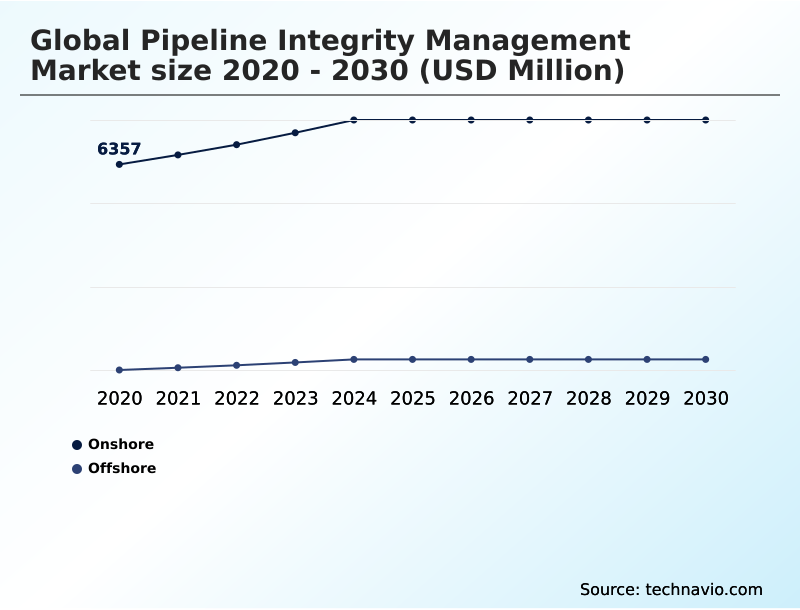
By Deployment Insights

The onshore segment is estimated to witness significant growth during the forecast period.

The onshore segment of the pipeline integrity management market encompasses terrestrial networks where comprehensive asset integrity management is essential. Operators utilize techniques such as inline inspection (ILI) and cathodic protection systems to mitigate threats like corrosion and third-party damage.

The deployment of advanced non-destructive testing (NDT) has improved flaw detection rates by over 15% in onshore settings.

Continuous corrosion monitoring and routine pipeline pigging are standard, supported by ultrasonic testing (UT) and magnetic flux leakage (MFL) for precise defect characterization.

Innovations in smart pig technology and pipeline coating inspection are crucial for maintaining structural integrity and regulatory compliance across these extensive and accessible networks, which form the backbone of continental energy transport.

Request Free Sample

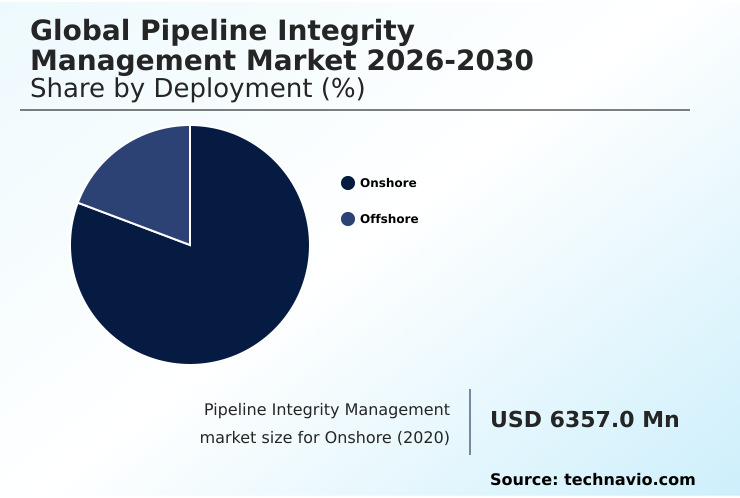
The Onshore segment was valued at in 2024 and showed a gradual increase during the forecast period.

Request Free Sample

Regional Analysis

North America is estimated to contribute 35.8% to the growth of the global market during the forecast period.Technavio’s analysts have elaborately explained the regional trends and drivers that shape the market during the forecast period.

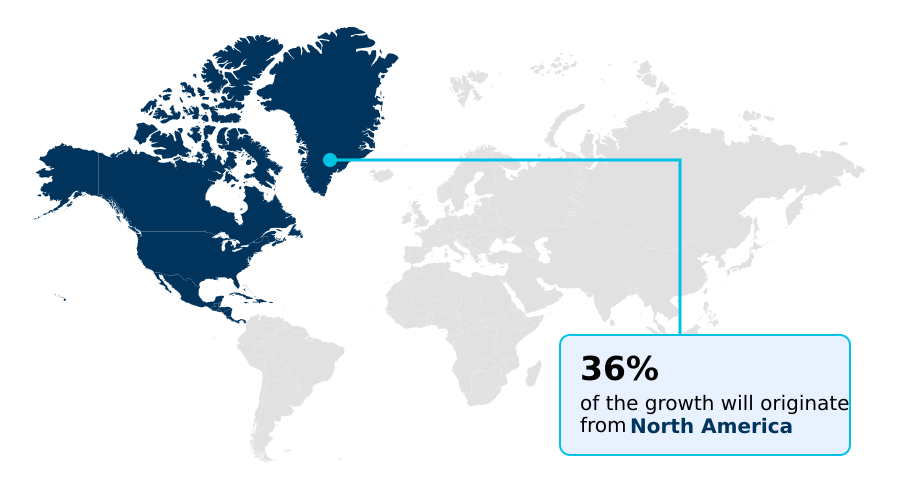
See How Pipeline Integrity Management Market Demand is Rising in North America Request Free Sample

The geographic landscape of the pipeline integrity management market is diverse, with regional priorities shaped by infrastructure age, environmental conditions, and regulatory frameworks.

In North America, geohazard assessment for landslides and seismic activity is critical, accounting for over 15% of integrity budgets in certain high-risk corridors. Here, the integration of GIS for pipeline management is standard practice.

Across expansive territories in the Middle East and APAC, satellite-based pipeline surveillance provides cost-effective pipeline right-of-way monitoring, offering surveillance coverage for over 99% of remote routes.

In Europe's North Sea, subsea pipeline inspection robotics and advanced direct current voltage gradient (DCVG) surveys are essential for offshore assets.

Meanwhile, drone-based inspection is gaining traction globally for its ability to conduct rapid visual assessments and support hydrostatic testing logistics.

Market Dynamics

Our researchers analyzed the data with 2025 as the base year, along with the key drivers, trends, and challenges. A holistic analysis of drivers will help companies refine their marketing strategies to gain a competitive advantage.

  • The global pipeline integrity management market is evolving beyond conventional inspection to embrace a holistic, data-driven framework. A key focus is on managing aging pipeline infrastructure, where the cost of pipeline integrity failure necessitates proactive strategies. Operators are enhancing pipeline safety standards through rigorous pipeline integrity audit procedures and advanced risk assessment models for pipelines.
  • For assets previously deemed hard to assess, new NDT methods for unpiggable pipelines are becoming critical. Technologies such as ultrasonic testing for pipeline welds and advanced pipeline crack detection technologies improve defect identification. Concurrently, the use of durable pipeline corrosion prevention coatings and addressing issues like hydrogen embrittlement in pipelines are vital for extending asset life.
  • The integration of real-time pipeline monitoring solutions and satellite monitoring for pipeline threats helps in early threat identification and third-party damage risk mitigation.
  • This digital transformation is powered by AI in pipeline anomaly detection and specialized software for pipeline integrity data, with the use of a digital twin for pipeline operations improving threat response times by more than double compared to traditional methods.
  • Innovations in subsea pipeline inspection robotics and a focus on regulatory compliance for gas pipelines further define the sector's trajectory toward safer, more reliable energy transport.

What are the key market drivers leading to the rise in the adoption of Pipeline Integrity Management Industry?

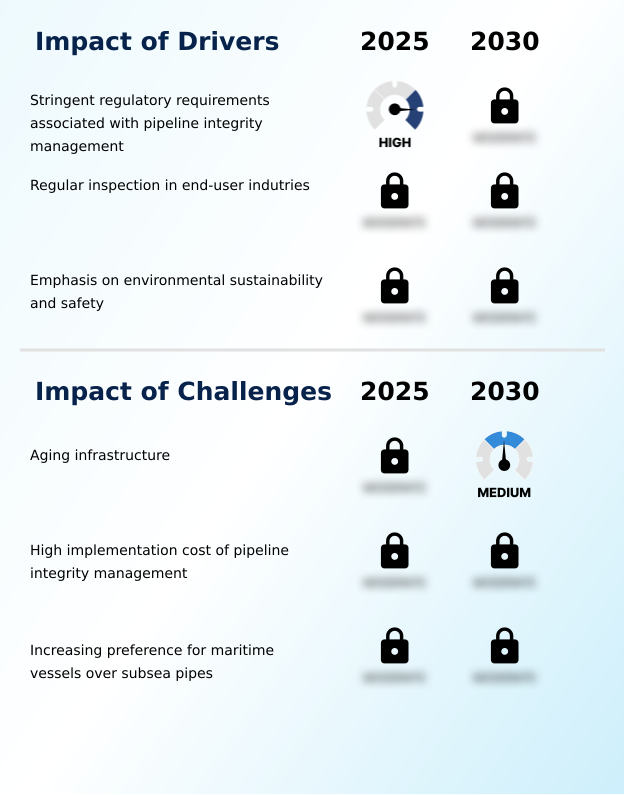
  • Stringent regulatory requirements associated with pipeline integrity management are a key driver for the market's growth.

  • Stringent regulations and a heightened focus on safety are primary drivers compelling investment in advanced integrity solutions.
  • The enforcement of rigorous regulatory compliance management frameworks, particularly for onshore pipeline safety, has led to a more than 25% increase in spending on certified leak detection systems in high-consequence areas.
  • The adoption of a formal integrity management program (IMP) is now standard practice, with risk-based inspection (RBI) methodologies helping to decrease significant incidents by over 40% through targeted interventions.
  • This proactive approach is central to effective asset integrity management and includes comprehensive environmental risk assessment and strategies for third-party damage prevention.
  • Adherence to evolving pipeline safety standards not only ensures operational continuity but also reinforces public trust and environmental stewardship, solidifying compliance as a catalyst for technological innovation.

What are the market trends shaping the Pipeline Integrity Management Industry?

  • The adoption of artificial intelligence and digital technologies is an emerging trend, reshaping pipeline integrity management by enhancing data analysis and predictive capabilities.

  • Key market trends are centered on digitalization and automation, which are revolutionizing how pipeline operators manage assets. The implementation of digital twin technology allows for virtual simulations that have improved failure prediction accuracy by over 20%.
  • Concurrently, the use of AI in pipeline anomaly detection is streamlining workflows, with some firms reporting a 15% reduction in false-positive alerts from inline inspection data. This shift supports advanced predictive maintenance models and comprehensive pipeline lifecycle management.
  • Other significant trends include the expansion of remote pipeline monitoring and the deployment of real-time monitoring systems, which enhance visibility into asset conditions. Furthermore, automated defect recognition systems are becoming integral to processing the vast amounts of data generated, increasing both the speed and reliability of integrity assessments.

What challenges does the Pipeline Integrity Management Industry face during its growth?

  • The challenge of aging infrastructure significantly affects the growth and operational dynamics of the industry.

  • The primary challenge facing the market is the complexity of managing aging pipeline infrastructure, which is highly susceptible to degradation mechanisms like stress corrosion cracking (SCC). These older assets see a 30% higher incidence of integrity threats compared to newer lines. Addressing this requires significant investment in advanced pipeline repair technologies and comprehensive fitness-for-service (FFS) assessment.
  • The transition to new energy sources introduces further complexity, with hydrogen pipeline compatibility and the integrity of carbon capture pipelines demanding new material and operational considerations. Moreover, providing unpiggable pipeline solutions for complex network segments remains a technical hurdle, although such solutions now cover 15% more of the network than a decade ago.
  • Finally, ensuring subsea pipeline integrity and conducting detailed pipeline failure analysis present ongoing operational and financial challenges.

Exclusive Technavio Analysis on Customer Landscape

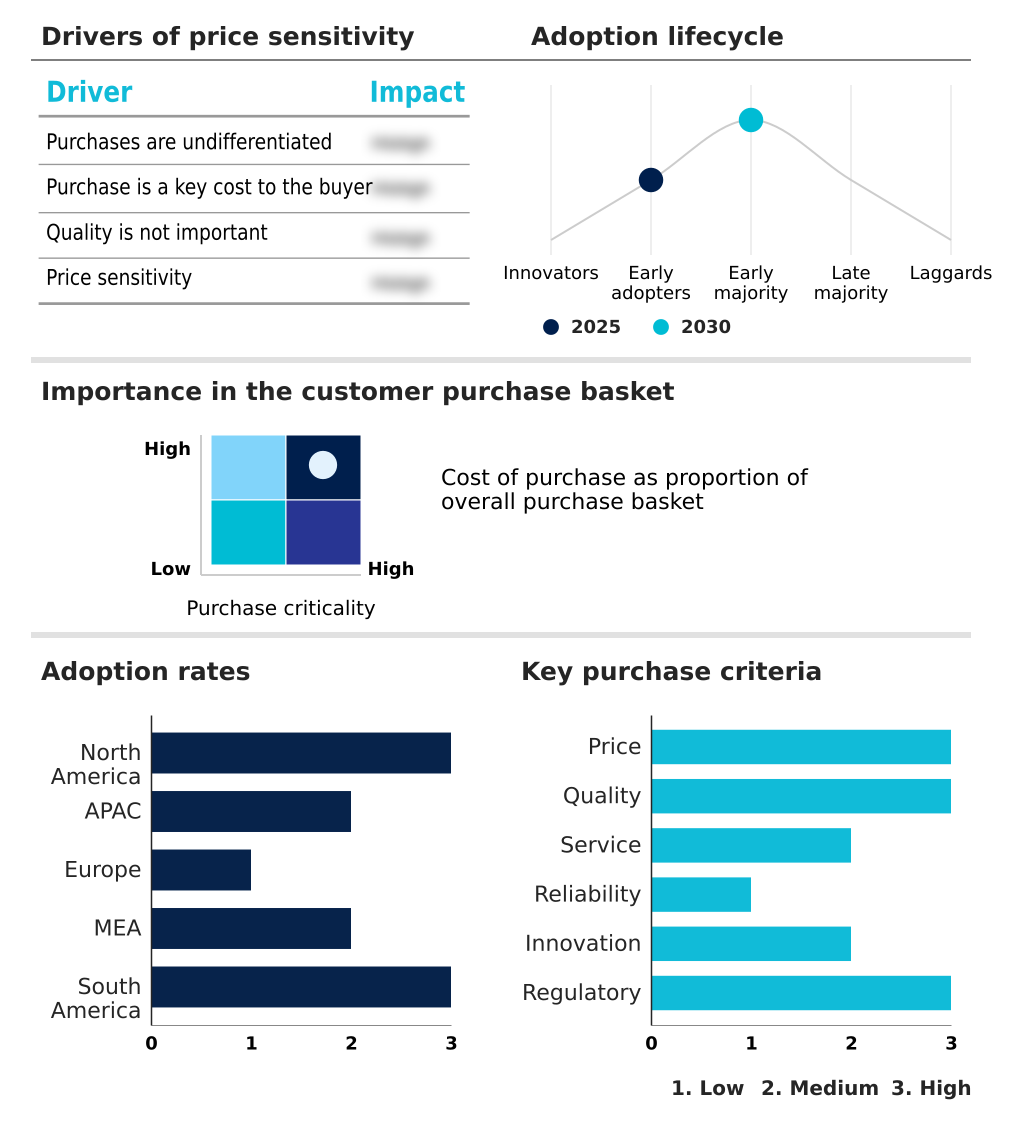
The pipeline integrity management market forecasting report includes the adoption lifecycle of the market, covering from the innovator’s stage to the laggard’s stage. It focuses on adoption rates in different regions based on penetration. Furthermore, the pipeline integrity management market report also includes key purchase criteria and drivers of price sensitivity to help companies evaluate and develop their market growth analysis strategies.

Customer Landscape of Pipeline Integrity Management Industry

Competitive Landscape

Companies are implementing various strategies, such as strategic alliances, pipeline integrity management market forecast, partnerships, mergers and acquisitions, geographical expansion, and product/service launches, to enhance their presence in the industry.

Aker Solutions ASA - Delivers engineering assessments and life cycle evaluations for subsea and onshore pipeline systems, ensuring safe operations through risk modeling and predictive maintenance for enhanced asset reliability.

The industry research and growth report includes detailed analyses of the competitive landscape of the market and information about key companies, including:

  • Aker Solutions ASA
  • Audubon Companies LLC
  • Azuria Corp.
  • Baker Hughes Co.
  • Brand Industrial Services Inc.
  • Bureau Veritas SA
  • Dexon Technology PLC
  • Emerson Electric Co.
  • Fluor Corp.
  • General Electric Co.
  • Halliburton Co.
  • Intertek Group Plc
  • Pembina Pipeline Corp.
  • ROSEN Swiss AG
  • SGS SA
  • T.D. Williamson Inc.
  • TechnipFMC plc
  • TUV Rheinland Group
  • TWI Ltd.
  • Yokogawa Electric Corp.

Qualitative and quantitative analysis of companies has been conducted to help clients understand the wider business environment as well as the strengths and weaknesses of key industry players. Data is qualitatively analyzed to categorize companies as pure play, category-focused, industry-focused, and diversified; it is quantitatively analyzed to categorize companies as dominant, leading, strong, tentative, and weak.

Recent Development and News in Pipeline integrity management market

  • In August 2024, the Pipeline and Hazardous Materials Safety Administration released a congressional report highlighting the challenges and detection gaps in applying current sensor technologies to nonmetallic plastic distribution pipes.
  • In October 2024, Enbridge announced a collaboration with Microsoft to deploy AI and intelligent automation for enhancing pipeline integrity, aiming to proactively identify maintenance needs and improve leak prevention measures.
  • In January 2025, the Pipeline and Hazardous Materials Safety Administration issued a final rule on gas pipeline leak detection and repair, establishing new protocols and performance standards for advanced detection systems to reduce methane emissions.
  • In January 2025, DarkVision Technologies launched its Kraken in-line inspection platform, which uses advanced acoustic imaging to provide high-resolution internal views of pipelines for identifying subtle defects.

Dive into Technavio’s robust research methodology, blending expert interviews, extensive data synthesis, and validated models for unparalleled Pipeline Integrity Management Market insights. See full methodology.

Market Scope
Page number 296
Base year 2025
Historic period 2020-2024
Forecast period 2026-2030
Growth momentum & CAGR Accelerate at a CAGR of 4.9%
Market growth 2026-2030 USD 2600.9 million
Market structure Fragmented
YoY growth 2025-2026(%) 4.5%
Key countries US, Canada, Mexico, China, Japan, India, South Korea, Australia, Indonesia, Russia, Germany, UK, France, Italy, Spain, Saudi Arabia, UAE, South Africa, Israel, Turkey, Brazil, Argentina and Colombia
Competitive landscape Leading Companies, Market Positioning of Companies, Competitive Strategies, and Industry Risks

Request Free Sample

Research Analyst Overview

  • The pipeline integrity management market is defined by a critical shift from reactive repairs to proactive, intelligence-led strategies. A comprehensive asset integrity management program, incorporating systematic risk-based inspection (RBI) and fitness-for-service (FFS) assessment, has demonstrated the capacity to reduce unscheduled downtime by up to 25%.
  • This evolution is driven by advanced technologies, including inline inspection (ILI) with magnetic flux leakage (MFL) and ultrasonic testing (UT) for precise anomaly detection. Innovations in non-destructive testing (NDT) and pipeline pigging are addressing challenges like stress corrosion cracking (SCC).
  • Operators are deploying robust cathodic protection systems, conducting pipeline coating inspection, and using direct current voltage gradient (DCVG) surveys to combat corrosion. Furthermore, acoustic emission monitoring and pipeline strain monitoring provide real-time insights, complemented by sophisticated pipeline data analytics and digital twin technology.
  • Adherence to stringent regulatory compliance management is pushing the adoption of superior leak detection systems, while material property verification and hydrostatic testing ensure structural soundness.

What are the Key Data Covered in this Pipeline Integrity Management Market Research and Growth Report?

  • What is the expected growth of the Pipeline Integrity Management Market between 2026 and 2030?

    • USD 2.60 billion, at a CAGR of 4.9%

  • What segmentation does the market report cover?

    • The report is segmented by Deployment (Onshore, and Offshore), Service (Inspection service, Cleaning service, and Others), Type (Crude oil, Natural gas, Refined products, and LNG) and Geography (North America, APAC, Europe, Middle East and Africa, South America)

  • Which regions are analyzed in the report?

    • North America, APAC, Europe, Middle East and Africa and South America

  • What are the key growth drivers and market challenges?

    • Stringent regulatory requirements associated with pipeline integrity management, Aging infrastructure

  • Who are the major players in the Pipeline Integrity Management Market?

    • Aker Solutions ASA, Audubon Companies LLC, Azuria Corp., Baker Hughes Co., Brand Industrial Services Inc., Bureau Veritas SA, Dexon Technology PLC, Emerson Electric Co., Fluor Corp., General Electric Co., Halliburton Co., Intertek Group Plc, Pembina Pipeline Corp., ROSEN Swiss AG, SGS SA, T.D. Williamson Inc., TechnipFMC plc, TUV Rheinland Group, TWI Ltd. and Yokogawa Electric Corp.

Market Research Insights

  • Market dynamics are increasingly influenced by technological integration, where advanced pipeline integrity software and smart pig technology enhance operational efficiency. The adoption of remote pipeline monitoring has reduced manual inspection needs, with some operators reporting travel cost reductions of over 30% in inaccessible areas.
  • Similarly, the use of drone-based inspection has accelerated survey timelines by up to 50% compared to traditional ground crews. In demanding environments, ensuring subsea pipeline integrity benefits from specialized robotics and real-time data feeds.
  • This shift toward automated and data-centric approaches, including solutions for previously unpiggable pipeline sections, allows for more accurate lifecycle management and better-informed maintenance decisions, directly impacting asset reliability and safety performance.

We can help! Our analysts can customize this pipeline integrity management market research report to meet your requirements.

Get in touch

1. Executive Summary

1.1 Market overview

Executive Summary - Chart on Market Overview
Executive Summary - Data Table on Market Overview
Executive Summary - Chart on Global Market Characteristics
Executive Summary - Chart on Market by Geography
Executive Summary - Chart on Market Segmentation by Deployment
Executive Summary - Chart on Market Segmentation by Service
Executive Summary - Chart on Market Segmentation by Type
Executive Summary - Chart on Incremental Growth
Executive Summary - Data Table on Incremental Growth
Executive Summary - Chart on Company Market Positioning

2. Technavio Analysis

2.1 Analysis of price sensitivity, lifecycle, customer purchase basket, adoption rates, and purchase criteria

2.2 Criticality of inputs and Factors of differentiation

Chart on Overview on criticality of inputs and factors of differentiation

2.3 Factors of disruption

Chart on Overview on factors of disruption

2.4 Impact of drivers and challenges

Chart on Impact of drivers and challenges in 2025 and 2030

3. Market Landscape

3.1 Market ecosystem

Chart on Parent Market
Data Table on - Parent Market

3.2 Market characteristics

Chart on Market characteristics analysis

3.3 Value chain analysis

Chart on Value chain analysis

4. Market Sizing

4.1 Market definition

Data Table on Offerings of companies included in the market definition

4.2 Market segment analysis

Market segments

4.3 Market size 2025

4.4 Market outlook: Forecast for 2025-2030

Chart on Global - Market size and forecast 2025-2030 ($ million)
Data Table on Global - Market size and forecast 2025-2030 ($ million)
Chart on Global Market: Year-over-year growth 2025-2030 (%)
Data Table on Global Market: Year-over-year growth 2025-2030 (%)

5. Historic Market Size

5.1 Global Pipeline Integrity Management Market 2020 - 2024

Historic Market Size - Data Table on Global Pipeline Integrity Management Market 2020 - 2024 ($ million)

5.2 Deployment segment analysis 2020 - 2024

Historic Market Size - Deployment Segment 2020 - 2024 ($ million)

5.3 Service segment analysis 2020 - 2024

Historic Market Size - Service Segment 2020 - 2024 ($ million)

5.4 Type segment analysis 2020 - 2024

Historic Market Size - Type Segment 2020 - 2024 ($ million)

5.5 Geography segment analysis 2020 - 2024

Historic Market Size - Geography Segment 2020 - 2024 ($ million)

5.6 Country segment analysis 2020 - 2024

Historic Market Size - Country Segment 2020 - 2024 ($ million)

6. Qualitative Analysis

6.1 Impact of AI in global pipeline integrity management market

7. Five Forces Analysis

7.1 Five forces summary

Five forces analysis - Comparison between 2025 and 2030

7.2 Bargaining power of buyers

Bargaining power of buyers - Impact of key factors 2025 and 2030

7.3 Bargaining power of suppliers

Bargaining power of suppliers - Impact of key factors in 2025 and 2030

7.4 Threat of new entrants

Threat of new entrants - Impact of key factors in 2025 and 2030

7.5 Threat of substitutes

Threat of substitutes - Impact of key factors in 2025 and 2030

7.6 Threat of rivalry

Threat of rivalry - Impact of key factors in 2025 and 2030

7.7 Market condition

Chart on Market condition - Five forces 2025 and 2030

8. Market Segmentation by Deployment

8.1 Market segments

Chart on Deployment - Market share 2025-2030 (%)
Data Table on Deployment - Market share 2025-2030 (%)

8.2 Comparison by Deployment

Chart on Comparison by Deployment
Data Table on Comparison by Deployment

8.3 Onshore - Market size and forecast 2025-2030

Chart on Onshore - Market size and forecast 2025-2030 ($ million)
Data Table on Onshore - Market size and forecast 2025-2030 ($ million)
Chart on Onshore - Year-over-year growth 2025-2030 (%)
Data Table on Onshore - Year-over-year growth 2025-2030 (%)

8.4 Offshore - Market size and forecast 2025-2030

Chart on Offshore - Market size and forecast 2025-2030 ($ million)
Data Table on Offshore - Market size and forecast 2025-2030 ($ million)
Chart on Offshore - Year-over-year growth 2025-2030 (%)
Data Table on Offshore - Year-over-year growth 2025-2030 (%)

8.5 Market opportunity by Deployment

Market opportunity by Deployment ($ million)
Data Table on Market opportunity by Deployment ($ million)

9. Market Segmentation by Service

9.1 Market segments

Chart on Service - Market share 2025-2030 (%)
Data Table on Service - Market share 2025-2030 (%)

9.2 Comparison by Service

Chart on Comparison by Service
Data Table on Comparison by Service

9.3 Inspection service - Market size and forecast 2025-2030

Chart on Inspection service - Market size and forecast 2025-2030 ($ million)
Data Table on Inspection service - Market size and forecast 2025-2030 ($ million)
Chart on Inspection service - Year-over-year growth 2025-2030 (%)
Data Table on Inspection service - Year-over-year growth 2025-2030 (%)

9.4 Cleaning service - Market size and forecast 2025-2030

Chart on Cleaning service - Market size and forecast 2025-2030 ($ million)
Data Table on Cleaning service - Market size and forecast 2025-2030 ($ million)
Chart on Cleaning service - Year-over-year growth 2025-2030 (%)
Data Table on Cleaning service - Year-over-year growth 2025-2030 (%)

9.5 Others - Market size and forecast 2025-2030

Chart on Others - Market size and forecast 2025-2030 ($ million)
Data Table on Others - Market size and forecast 2025-2030 ($ million)
Chart on Others - Year-over-year growth 2025-2030 (%)
Data Table on Others - Year-over-year growth 2025-2030 (%)

9.6 Market opportunity by Service

Market opportunity by Service ($ million)
Data Table on Market opportunity by Service ($ million)

10. Market Segmentation by Type

10.1 Market segments

Chart on Type - Market share 2025-2030 (%)
Data Table on Type - Market share 2025-2030 (%)

10.2 Comparison by Type

Chart on Comparison by Type
Data Table on Comparison by Type

10.3 Crude oil - Market size and forecast 2025-2030

Chart on Crude oil - Market size and forecast 2025-2030 ($ million)
Data Table on Crude oil - Market size and forecast 2025-2030 ($ million)
Chart on Crude oil - Year-over-year growth 2025-2030 (%)
Data Table on Crude oil - Year-over-year growth 2025-2030 (%)

10.4 Natural gas - Market size and forecast 2025-2030

Chart on Natural gas - Market size and forecast 2025-2030 ($ million)
Data Table on Natural gas - Market size and forecast 2025-2030 ($ million)
Chart on Natural gas - Year-over-year growth 2025-2030 (%)
Data Table on Natural gas - Year-over-year growth 2025-2030 (%)

10.5 Refined products - Market size and forecast 2025-2030

Chart on Refined products - Market size and forecast 2025-2030 ($ million)
Data Table on Refined products - Market size and forecast 2025-2030 ($ million)
Chart on Refined products - Year-over-year growth 2025-2030 (%)
Data Table on Refined products - Year-over-year growth 2025-2030 (%)

10.6 LNG - Market size and forecast 2025-2030

Chart on LNG - Market size and forecast 2025-2030 ($ million)
Data Table on LNG - Market size and forecast 2025-2030 ($ million)
Chart on LNG - Year-over-year growth 2025-2030 (%)
Data Table on LNG - Year-over-year growth 2025-2030 (%)

10.7 Market opportunity by Type

Market opportunity by Type ($ million)
Data Table on Market opportunity by Type ($ million)

11. Customer Landscape

11.1 Customer landscape overview

Analysis of price sensitivity, lifecycle, customer purchase basket, adoption rates, and purchase criteria

12. Geographic Landscape

12.1 Geographic segmentation

Chart on Market share by geography 2025-2030 (%)
Data Table on Market share by geography 2025-2030 (%)

12.2 Geographic comparison

Chart on Geographic comparison
Data Table on Geographic comparison

12.3 North America - Market size and forecast 2025-2030

Chart on North America - Market size and forecast 2025-2030 ($ million)
Data Table on North America - Market size and forecast 2025-2030 ($ million)
Chart on North America - Year-over-year growth 2025-2030 (%)
Data Table on North America - Year-over-year growth 2025-2030 (%)
Chart on Regional Comparison - North America
Data Table on Regional Comparison - North America

12.3.1 US - Market size and forecast 2025-2030

Chart on US - Market size and forecast 2025-2030 ($ million)
Data Table on US - Market size and forecast 2025-2030 ($ million)
Chart on US - Year-over-year growth 2025-2030 (%)
Data Table on US - Year-over-year growth 2025-2030 (%)

12.3.2 Canada - Market size and forecast 2025-2030

Chart on Canada - Market size and forecast 2025-2030 ($ million)
Data Table on Canada - Market size and forecast 2025-2030 ($ million)
Chart on Canada - Year-over-year growth 2025-2030 (%)
Data Table on Canada - Year-over-year growth 2025-2030 (%)

12.3.3 Mexico - Market size and forecast 2025-2030

Chart on Mexico - Market size and forecast 2025-2030 ($ million)
Data Table on Mexico - Market size and forecast 2025-2030 ($ million)
Chart on Mexico - Year-over-year growth 2025-2030 (%)
Data Table on Mexico - Year-over-year growth 2025-2030 (%)

12.4 APAC - Market size and forecast 2025-2030

Chart on APAC - Market size and forecast 2025-2030 ($ million)
Data Table on APAC - Market size and forecast 2025-2030 ($ million)
Chart on APAC - Year-over-year growth 2025-2030 (%)
Data Table on APAC - Year-over-year growth 2025-2030 (%)
Chart on Regional Comparison - APAC
Data Table on Regional Comparison - APAC

12.4.1 China - Market size and forecast 2025-2030

Chart on China - Market size and forecast 2025-2030 ($ million)
Data Table on China - Market size and forecast 2025-2030 ($ million)
Chart on China - Year-over-year growth 2025-2030 (%)
Data Table on China - Year-over-year growth 2025-2030 (%)

12.4.2 Japan - Market size and forecast 2025-2030

Chart on Japan - Market size and forecast 2025-2030 ($ million)
Data Table on Japan - Market size and forecast 2025-2030 ($ million)
Chart on Japan - Year-over-year growth 2025-2030 (%)
Data Table on Japan - Year-over-year growth 2025-2030 (%)

12.4.3 India - Market size and forecast 2025-2030

Chart on India - Market size and forecast 2025-2030 ($ million)
Data Table on India - Market size and forecast 2025-2030 ($ million)
Chart on India - Year-over-year growth 2025-2030 (%)
Data Table on India - Year-over-year growth 2025-2030 (%)

12.4.4 South Korea - Market size and forecast 2025-2030

Chart on South Korea - Market size and forecast 2025-2030 ($ million)
Data Table on South Korea - Market size and forecast 2025-2030 ($ million)
Chart on South Korea - Year-over-year growth 2025-2030 (%)
Data Table on South Korea - Year-over-year growth 2025-2030 (%)

12.4.5 Australia - Market size and forecast 2025-2030

Chart on Australia - Market size and forecast 2025-2030 ($ million)
Data Table on Australia - Market size and forecast 2025-2030 ($ million)
Chart on Australia - Year-over-year growth 2025-2030 (%)
Data Table on Australia - Year-over-year growth 2025-2030 (%)

12.4.6 Indonesia - Market size and forecast 2025-2030

Chart on Indonesia - Market size and forecast 2025-2030 ($ million)
Data Table on Indonesia - Market size and forecast 2025-2030 ($ million)
Chart on Indonesia - Year-over-year growth 2025-2030 (%)
Data Table on Indonesia - Year-over-year growth 2025-2030 (%)

12.5 Europe - Market size and forecast 2025-2030

Chart on Europe - Market size and forecast 2025-2030 ($ million)
Data Table on Europe - Market size and forecast 2025-2030 ($ million)
Chart on Europe - Year-over-year growth 2025-2030 (%)
Data Table on Europe - Year-over-year growth 2025-2030 (%)
Chart on Regional Comparison - Europe
Data Table on Regional Comparison - Europe

12.5.1 Russia - Market size and forecast 2025-2030

Chart on Russia - Market size and forecast 2025-2030 ($ million)
Data Table on Russia - Market size and forecast 2025-2030 ($ million)
Chart on Russia - Year-over-year growth 2025-2030 (%)
Data Table on Russia - Year-over-year growth 2025-2030 (%)

12.5.2 Germany - Market size and forecast 2025-2030

Chart on Germany - Market size and forecast 2025-2030 ($ million)
Data Table on Germany - Market size and forecast 2025-2030 ($ million)
Chart on Germany - Year-over-year growth 2025-2030 (%)
Data Table on Germany - Year-over-year growth 2025-2030 (%)

12.5.3 UK - Market size and forecast 2025-2030

Chart on UK - Market size and forecast 2025-2030 ($ million)
Data Table on UK - Market size and forecast 2025-2030 ($ million)
Chart on UK - Year-over-year growth 2025-2030 (%)
Data Table on UK - Year-over-year growth 2025-2030 (%)

12.5.4 France - Market size and forecast 2025-2030

Chart on France - Market size and forecast 2025-2030 ($ million)
Data Table on France - Market size and forecast 2025-2030 ($ million)
Chart on France - Year-over-year growth 2025-2030 (%)
Data Table on France - Year-over-year growth 2025-2030 (%)

12.5.5 Italy - Market size and forecast 2025-2030

Chart on Italy - Market size and forecast 2025-2030 ($ million)
Data Table on Italy - Market size and forecast 2025-2030 ($ million)
Chart on Italy - Year-over-year growth 2025-2030 (%)
Data Table on Italy - Year-over-year growth 2025-2030 (%)

12.5.6 Spain - Market size and forecast 2025-2030

Chart on Spain - Market size and forecast 2025-2030 ($ million)
Data Table on Spain - Market size and forecast 2025-2030 ($ million)
Chart on Spain - Year-over-year growth 2025-2030 (%)
Data Table on Spain - Year-over-year growth 2025-2030 (%)

12.6 Middle East and Africa - Market size and forecast 2025-2030

Chart on Middle East and Africa - Market size and forecast 2025-2030 ($ million)
Data Table on Middle East and Africa - Market size and forecast 2025-2030 ($ million)
Chart on Middle East and Africa - Year-over-year growth 2025-2030 (%)
Data Table on Middle East and Africa - Year-over-year growth 2025-2030 (%)
Chart on Regional Comparison - Middle East and Africa
Data Table on Regional Comparison - Middle East and Africa

12.6.1 Saudi Arabia - Market size and forecast 2025-2030

Chart on Saudi Arabia - Market size and forecast 2025-2030 ($ million)
Data Table on Saudi Arabia - Market size and forecast 2025-2030 ($ million)
Chart on Saudi Arabia - Year-over-year growth 2025-2030 (%)
Data Table on Saudi Arabia - Year-over-year growth 2025-2030 (%)

12.6.2 UAE - Market size and forecast 2025-2030

Chart on UAE - Market size and forecast 2025-2030 ($ million)
Data Table on UAE - Market size and forecast 2025-2030 ($ million)
Chart on UAE - Year-over-year growth 2025-2030 (%)
Data Table on UAE - Year-over-year growth 2025-2030 (%)

12.6.3 South Africa - Market size and forecast 2025-2030

Chart on South Africa - Market size and forecast 2025-2030 ($ million)
Data Table on South Africa - Market size and forecast 2025-2030 ($ million)
Chart on South Africa - Year-over-year growth 2025-2030 (%)
Data Table on South Africa - Year-over-year growth 2025-2030 (%)

12.6.4 Israel - Market size and forecast 2025-2030

Chart on Israel - Market size and forecast 2025-2030 ($ million)
Data Table on Israel - Market size and forecast 2025-2030 ($ million)
Chart on Israel - Year-over-year growth 2025-2030 (%)
Data Table on Israel - Year-over-year growth 2025-2030 (%)

12.6.5 Turkey - Market size and forecast 2025-2030

Chart on Turkey - Market size and forecast 2025-2030 ($ million)
Data Table on Turkey - Market size and forecast 2025-2030 ($ million)
Chart on Turkey - Year-over-year growth 2025-2030 (%)
Data Table on Turkey - Year-over-year growth 2025-2030 (%)

12.7 South America - Market size and forecast 2025-2030

Chart on South America - Market size and forecast 2025-2030 ($ million)
Data Table on South America - Market size and forecast 2025-2030 ($ million)
Chart on South America - Year-over-year growth 2025-2030 (%)
Data Table on South America - Year-over-year growth 2025-2030 (%)
Chart on Regional Comparison - South America
Data Table on Regional Comparison - South America

12.7.1 Brazil - Market size and forecast 2025-2030

Chart on Brazil - Market size and forecast 2025-2030 ($ million)
Data Table on Brazil - Market size and forecast 2025-2030 ($ million)
Chart on Brazil - Year-over-year growth 2025-2030 (%)
Data Table on Brazil - Year-over-year growth 2025-2030 (%)

12.7.2 Argentina - Market size and forecast 2025-2030

Chart on Argentina - Market size and forecast 2025-2030 ($ million)
Data Table on Argentina - Market size and forecast 2025-2030 ($ million)
Chart on Argentina - Year-over-year growth 2025-2030 (%)
Data Table on Argentina - Year-over-year growth 2025-2030 (%)

12.7.3 Colombia - Market size and forecast 2025-2030

Chart on Colombia - Market size and forecast 2025-2030 ($ million)
Data Table on Colombia - Market size and forecast 2025-2030 ($ million)
Chart on Colombia - Year-over-year growth 2025-2030 (%)
Data Table on Colombia - Year-over-year growth 2025-2030 (%)

12.8 Market opportunity by geography

Market opportunity by geography ($ million)
Data Tables on Market opportunity by geography ($ million)

13. Drivers, Challenges, and Opportunity

13.1 Market drivers

Stringent regulatory requirements associated with pipeline integrity management
Regular inspection in end-user indutries
Emphasis on environmental sustainability and safety

13.2 Market challenges

Aging infrastructure
High implementation cost of pipeline integrity management
Increasing preference for maritime vessels over subsea pipes

13.3 Impact of drivers and challenges

Impact of drivers and challenges in 2025 and 2030

13.4 Market opportunities

Adoption of artificial intelligence and digital technologies
Focus on sustainability and energy transition readiness
Advancements in risk assessment and predictive maintenance

14. Competitive Landscape

14.1 Overview

14.2

Overview on criticality of inputs and factors of differentiation

14.3 Landscape disruption

Overview on factors of disruption

14.4 Industry risks

Impact of key risks on business

15. Competitive Analysis

15.1 Companies profiled

Companies covered

15.2 Company ranking index

15.3 Market positioning of companies

Matrix on companies position and classification

15.4 Aker Solutions ASA

Aker Solutions ASA - Overview
Aker Solutions ASA - Business segments
Aker Solutions ASA - Key news
Aker Solutions ASA - Key offerings
Aker Solutions ASA - Segment focus
SWOT

15.5 Baker Hughes Co.

Baker Hughes Co. - Overview
Baker Hughes Co. - Business segments
Baker Hughes Co. - Key news
Baker Hughes Co. - Key offerings
Baker Hughes Co. - Segment focus
SWOT

15.6 Bureau Veritas SA

Bureau Veritas SA - Overview
Bureau Veritas SA - Business segments
Bureau Veritas SA - Key offerings
Bureau Veritas SA - Segment focus
SWOT

15.7 Dexon Technology PLC

Dexon Technology PLC - Overview
Dexon Technology PLC - Product / Service
Dexon Technology PLC - Key offerings
SWOT

15.8 Emerson Electric Co.

Emerson Electric Co. - Overview
Emerson Electric Co. - Business segments
Emerson Electric Co. - Key news
Emerson Electric Co. - Key offerings
Emerson Electric Co. - Segment focus
SWOT

15.9 Fluor Corp.

Fluor Corp. - Overview
Fluor Corp. - Business segments
Fluor Corp. - Key news
Fluor Corp. - Key offerings
Fluor Corp. - Segment focus
SWOT

15.10 General Electric Co.

General Electric Co. - Overview
General Electric Co. - Business segments
General Electric Co. - Key news
General Electric Co. - Key offerings
General Electric Co. - Segment focus
SWOT

15.11 Halliburton Co.

Halliburton Co. - Overview
Halliburton Co. - Business segments
Halliburton Co. - Key news
Halliburton Co. - Key offerings
Halliburton Co. - Segment focus
SWOT

15.12 Intertek Group Plc

Intertek Group Plc - Overview
Intertek Group Plc - Business segments
Intertek Group Plc - Key offerings
Intertek Group Plc - Segment focus
SWOT

15.13 ROSEN Swiss AG

ROSEN Swiss AG - Overview
ROSEN Swiss AG - Product / Service
ROSEN Swiss AG - Key offerings
SWOT

15.14 SGS SA

SGS SA - Overview
SGS SA - Business segments
SGS SA - Key offerings
SGS SA - Segment focus
SWOT

15.15 T.D. Williamson Inc.

T.D. Williamson Inc. - Overview
T.D. Williamson Inc. - Product / Service
T.D. Williamson Inc. - Key offerings
SWOT

15.16 TechnipFMC plc

TechnipFMC plc - Overview
TechnipFMC plc - Business segments
TechnipFMC plc - Key news
TechnipFMC plc - Key offerings
TechnipFMC plc - Segment focus
SWOT

15.17 TUV Rheinland Group

TUV Rheinland Group - Overview
TUV Rheinland Group - Product / Service
TUV Rheinland Group - Key offerings
SWOT

15.18 Yokogawa Electric Corp.

Yokogawa Electric Corp. - Overview
Yokogawa Electric Corp. - Business segments
Yokogawa Electric Corp. - Key news
Yokogawa Electric Corp. - Key offerings
Yokogawa Electric Corp. - Segment focus
SWOT

16. Appendix

16.1 Scope of the report

Market definition
Objectives
Notes and caveats

16.2 Inclusions and exclusions checklist

Inclusions checklist
Exclusions checklist

16.3 Currency conversion rates for US$

16.4 Research methodology

16.5 Data procurement

Information sources

16.6 Data validation

16.7 Validation techniques employed for market sizing

16.8 Data synthesis

16.9 360 degree market analysis

16.10 List of abbreviations

Research Methodology

Technavio presents a detailed picture of the market by way of study, synthesis, and summation of data from multiple sources. The analysts have presented the various facets of the market with a particular focus on identifying the key industry influencers. The data thus presented is comprehensive, reliable, and the result of extensive research, both primary and secondary.

INFORMATION SOURCES

Primary sources

  • Manufacturers and suppliers
  • Channel partners
  • Industry experts
  • Strategic decision makers

Secondary sources

  • Industry journals and periodicals
  • Government data
  • Financial reports of key industry players
  • Historical data
  • Press releases

DATA ANALYSIS

Data Synthesis

  • Collation of data
  • Estimation of key figures
  • Analysis of derived insights

Data Validation

  • Triangulation with data models
  • Reference against proprietary databases
  • Corroboration with industry experts

REPORT WRITING

Qualitative

  • Market drivers
  • Market challenges
  • Market trends
  • Five forces analysis

Quantitative

  • Market size and forecast
  • Market segmentation
  • Geographical insights
  • Competitive landscape

Interested in this report?

Get your sample now to see our research methodology and insights!

Download Now

Frequently Asked Questions

Pipeline Integrity Management market growth will increase by USD 2600.9 million during 2026-2030.

The Pipeline Integrity Management market is expected to grow at a CAGR of 4.9% during 2026-2030.

Pipeline Integrity Management market is segmented by Deployment (Onshore , Offshore) Service (Inspection service, Cleaning service, Others) Type (Crude oil, Natural gas, Refined products, LNG)

Aker Solutions ASA, Audubon Companies LLC, Azuria Corp., Baker Hughes Co., Brand Industrial Services Inc., Bureau Veritas SA, Dexon Technology PLC, Emerson Electric Co., Fluor Corp., General Electric Co., Halliburton Co., Intertek Group Plc, Pembina Pipeline Corp., ROSEN Swiss AG, SGS SA, T.D. Williamson Inc., TechnipFMC plc, TUV Rheinland Group, TWI Ltd., Yokogawa Electric Corp. are a few of the key vendors in the Pipeline Integrity Management market.

North America will register the highest growth rate of 35.8% among the other regions. Therefore, the Pipeline Integrity Management market in North America is expected to garner significant business opportunities for the vendors during the forecast period.

US, Canada, Mexico, China, Japan, India, South Korea, Australia, Indonesia, Russia, Germany, UK, France, Italy, Spain, Saudi Arabia, UAE, South Africa, Israel, Turkey, Brazil, Argentina, Colombia

  • Stringent regulatory requirements associated with pipeline integrity management is the driving factor this market.

The Pipeline Integrity Management market vendors should focus on grabbing business opportunities from the Deployment segment as it accounted for the largest market share in the base year.