Plant Asset Management (PAM) Market Analysis, Size, and Forecast 2026-2030: North America (US, Canada, and Mexico), Europe (Germany, UK, and France), APAC (China, Japan, and India), Middle East and Africa (Saudi Arabia, UAE, and South Africa), South America (Brazil and Argentina), and Rest of World (ROW)

Plant Asset Management (PAM) Market Analysis, Size, and Forecast 2026-2030:
North America (US, Canada, and Mexico), Europe (Germany, UK, and France), APAC (China, Japan, and India), Middle East and Africa (Saudi Arabia, UAE, and South Africa), South America (Brazil and Argentina), and Rest of World (ROW)

Published: May 2026 303 Pages SKU: IRTNTR71182

Market Overview at a Glance

$2.99 B
Market Opportunity
8.3%
CAGR 2025 - 2030
51.2%
North America Growth
$3.77 B
Cloud segment 2024

Plant Asset Management (PAM) Market Size 2026-2030

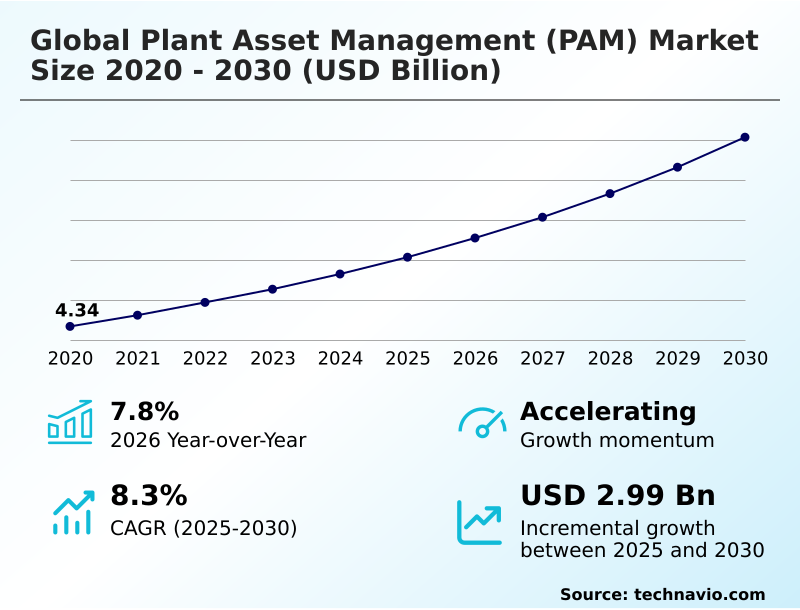
The Plant Asset Management (PAM) Market size was valued at USD 6.07 billion in 2025, growing at a CAGR of 8.3% during the forecast period 2026-2030.

Major Market Trends & Insights

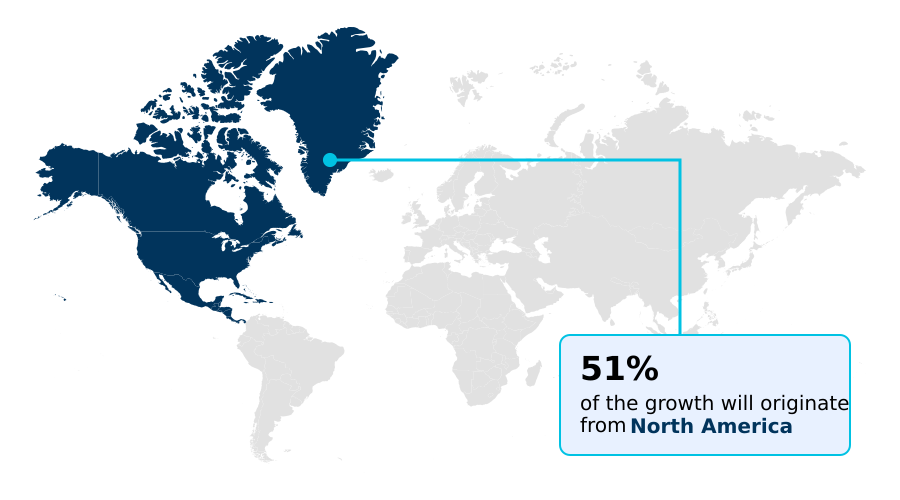
  • North America dominated the market and accounted for a 51.2% growth during the forecast period.
  • By Deployment - Cloud segment was valued at USD 3.77 billion in 2024
  • By End-user - Power industry segment accounted for the largest market revenue share in 2024

Market Size & Forecast

  • Historic Market Opportunities 2020-2024: USD 4.73 billion
  • Market Future Opportunities 2025-2030: USD 2.99 billion
  • CAGR from 2025 to 2030 : 8.3%

Market Summary

  • The plant asset management (PAM) market is defined by a strategic shift from reactive to predictive maintenance, with leading organizations reducing unplanned downtime by up to 40%. Implementations focused on asset reliability have shown to increase overall equipment effectiveness by more than 15% within the initial two years.
  • For instance, a chemical processing facility leverages PAM systems to monitor equipment vibration and temperature, using predictive maintenance alerts to schedule repairs before a catastrophic failure occurs, thereby preventing costly production halts and ensuring safety. This transition is largely driven by stringent regulatory compliance for environmental emissions, compelling industries to optimize asset performance for better energy efficiency.
  • However, a primary challenge remains the integration of modern PAM software with legacy operational technology, which can create data silos and hinder the achievement of a unified, real-time view of asset health across an enterprise.

What will be the Size of the Plant Asset Management (PAM) Market during the forecast period?

Get Key Insights on Market Forecast (PDF) Request Free Sample

How is the Plant Asset Management (PAM) Market Segmented?

The plant asset management (pam) industry research report provides comprehensive data (region-wise segment analysis), with forecasts and analysis for the period 2026-2030, as well as historical data from 2020-2024 for the following segments.

  • Deployment
    • Cloud
    • On-premises
  • End-user
    • Power industry
    • Pulp and paper industry
    • Oil and gas industry
    • Refining industry
    • Others
  • Component
    • Software
    • Services
  • Geography
    • North America
      • US
      • Canada
      • Mexico
    • Europe
      • Germany
      • UK
      • France
    • APAC
      • China
      • Japan
      • India
    • Middle East and Africa
      • Saudi Arabia
      • UAE
      • South Africa
    • South America
      • Brazil
      • Argentina
    • Rest of World (ROW)

How is the Plant Asset Management (PAM) Market Segmented by Deployment?

The cloud segment is estimated to witness significant growth during the forecast period.

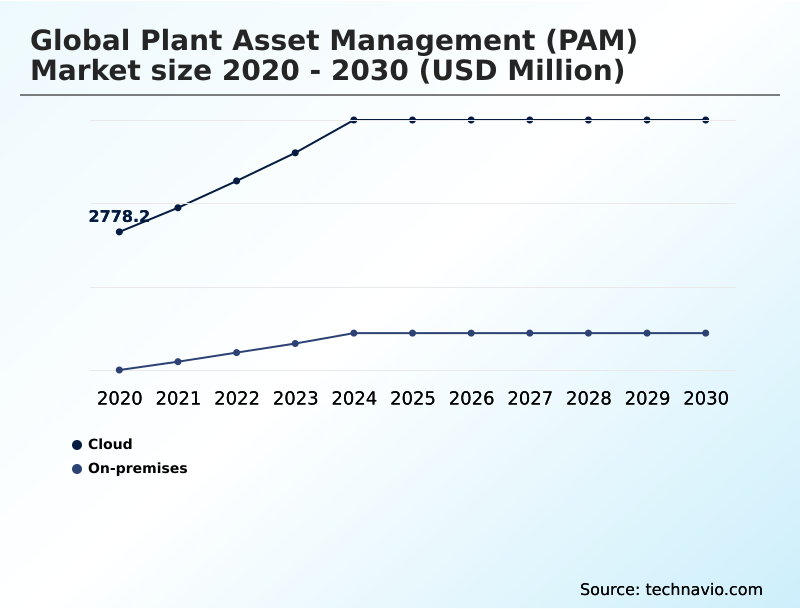
Cloud-based plant asset management (PAM) solutions feature a 15% higher adoption rate among small-to-medium enterprises than on-premise alternatives, driven by lower capital expenditure.

This deployment model improves the efficiency of remote diagnostics by over 40%, enabling centralized expert teams to support multiple sites and facilitate better data interoperability.

Leveraging cloud infrastructure for EAM solutions allows for the continuous integration of advanced machine learning algorithms, which enhances predictive accuracy for reducing unplanned downtime.

The scalability of cloud-native PAM supports dynamic operational adjustments without significant hardware overhauls, offering a more agile approach to asset management.

By centralizing data, organizations achieve a unified view of asset health, streamlining maintenance workflows and resource allocation for improved business outcomes.

Request Free Sample

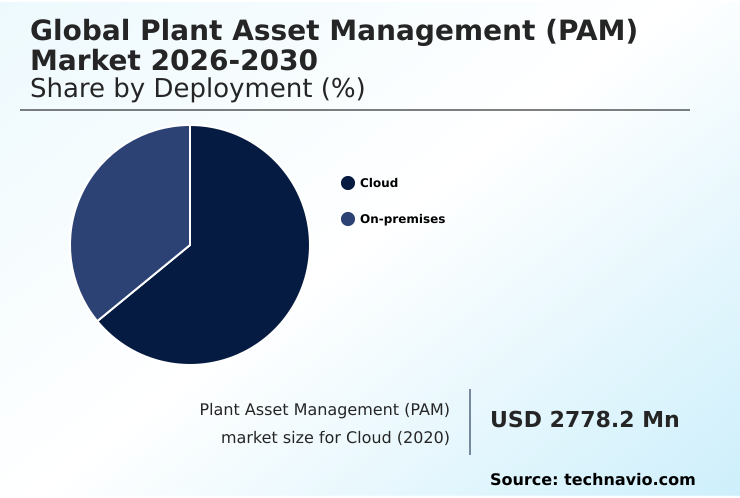
The Cloud segment was valued at USD 3.77 billion in 2024 and showed a gradual increase during the forecast period.

Request Free Sample

How demand for the Plant Asset Management (PAM) market is rising in the leading region?

North America is estimated to contribute 51.2% to the growth of the global market during the forecast period.Technavio’s analysts have elaborately explained the regional trends and drivers that shape the market during the forecast period.

See How Plant Asset Management (PAM) Market demand is rising in North America Request Free Sample

North America accounts for 51% of the global Plant Asset Management (PAM) market, driven by mature industrial automation and a strong focus on digital transformation.

The US, with a market value of $2,258 million, leads the region due to early adoption in the power and oil and gas industries.

In contrast, the APAC region is experiencing adoption growth that is nearly 1.5 times faster, particularly in the manufacturing sectors of China and India, fueled by government-led smart factory initiatives.

This regional difference highlights a strategic divergence: North America focuses on optimizing existing infrastructure for maintenance cost reduction, while APAC prioritizes integrating advanced IIoT sensors and asset integrity management systems into new capital projects to build supply chain resilience from the ground up.

This dynamic shapes how vendors tailor solutions for modernization versus greenfield deployments.

What are the key Drivers, Trends, and Challenges in the Plant Asset Management (PAM) Market?

Our researchers analyzed the data with 2025 as the base year, along with the key drivers, trends, and challenges. A holistic analysis of drivers will help companies refine their marketing strategies to gain a competitive advantage.

  • Understanding plant asset management software benefits is the first step for organizations aiming to enhance operational efficiency and reduce lifecycle costs. When evaluating the best pam systems for manufacturing, decision-makers must consider factors such as scalability, integration with existing enterprise systems, and the depth of analytical capabilities.
  • For many, the primary challenge is to figure out how to implement predictive maintenance effectively. The process typically begins with deploying iot solutions for equipment monitoring to capture real-time data on asset health, such as vibration, temperature, and pressure.
  • Organizations that successfully integrate these technologies often see a 20% greater reduction in unplanned downtime compared to those relying on scheduled maintenance alone. Furthermore, creating a digital twin for asset lifecycle management provides a virtual environment to simulate performance, test maintenance strategies, and train personnel without impacting live operations.
  • This approach allows for a more holistic view of asset health, from design and commissioning to decommissioning. The use of advanced diagnostics enables a shift from time-based to condition-based interventions, with some facilities improving spare parts inventory accuracy by over 30% by eliminating the guesswork associated with potential failures.

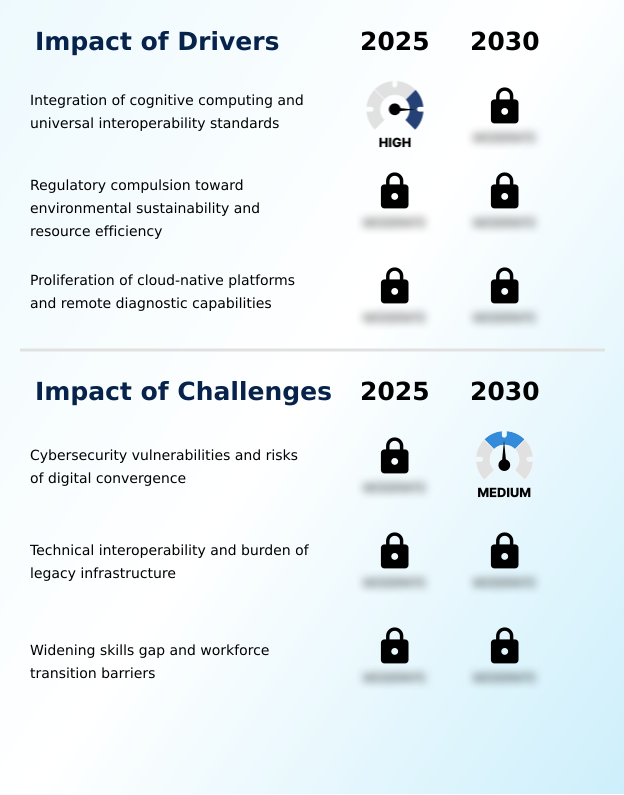
What are the key market drivers leading to the rise in the adoption of Plant Asset Management (PAM) Industry?

  • A key market driver is the convergence of cognitive computing with universal interoperability standards, which enhances autonomous asset management capabilities.

  • Increasingly stringent environmental regulations are a significant driver for the Plant Asset Management (PAM) market, with systems capable of optimizing energy consumption demonstrating a reduction of up to 15% in operational costs.
  • Adherence to new regulatory compliance mandates has directly fueled a 20% rise in adoption within the power and chemical industries, as companies seek to minimize their carbon footprint reduction.
  • This push for sustainability goals is compelling organizations to invest in cloud-native PAM and advanced asset performance management platforms.
  • These solutions provide the granular data needed to track emissions at the individual asset level, linking operational efficiency directly to environmental stewardship and corporate responsibility targets.

What are the market trends shaping the Plant Asset Management (PAM) Industry?

  • The integration of generative AI with predictive analytics is an emerging market trend, enabling more sophisticated and prescriptive asset maintenance strategies.

  • A primary trend reshaping the Plant Asset Management (PAM) market is the adoption of digital twin technology, which improves fault detection and diagnostics accuracy by over 30% compared to traditional condition monitoring. These virtual models provide a real-time, dynamic representation of physical assets, enabling operators to simulate performance and optimize maintenance scheduling.
  • The integration of generative AI applications further enhances these systems, providing prescriptive analytics and conversational interfaces that can generate diagnostic reports 50% faster than manual analysis. This convergence of technologies supports the evolution of the smart factory by enabling more sophisticated, data-driven decision making.
  • As a result, organizations are better equipped to improve asset health indexing and move toward fully autonomous operational workflows.

What challenges does the Plant Asset Management (PAM) Industry face during its growth?

  • A significant challenge affecting industry growth is the increase in cybersecurity vulnerabilities arising from digital convergence and IT/OT integration.

  • The convergence of IT and operational technology introduces significant security risks, with OT-targeted cyberattacks capable of increasing unplanned downtime by more than 200% compared to typical mechanical failures. This issue of operational technology security is a primary challenge for the Plant Asset Management (PAM) market.
  • Furthermore, a persistent skills gap, with an estimated 35% shortfall in personnel proficient in both mechanical engineering and data science, hinders the effective use of advanced analytics. The difficulty of legacy system integration further complicates the security landscape, as older, vulnerable cyber-physical systems are connected to modern networks.
  • Addressing this IT/OT convergence and the associated workforce productivity deficit is critical for realizing the full benefits of digital industrial technologies.

Exclusive Technavio Analysis on Customer Landscape

The plant asset management (pam) market forecasting report includes the adoption lifecycle of the market, covering from the innovator’s stage to the laggard’s stage. It focuses on adoption rates in different regions based on penetration. Furthermore, the plant asset management (pam) market report also includes key purchase criteria and drivers of price sensitivity to help companies evaluate and develop their market growth analysis strategies.

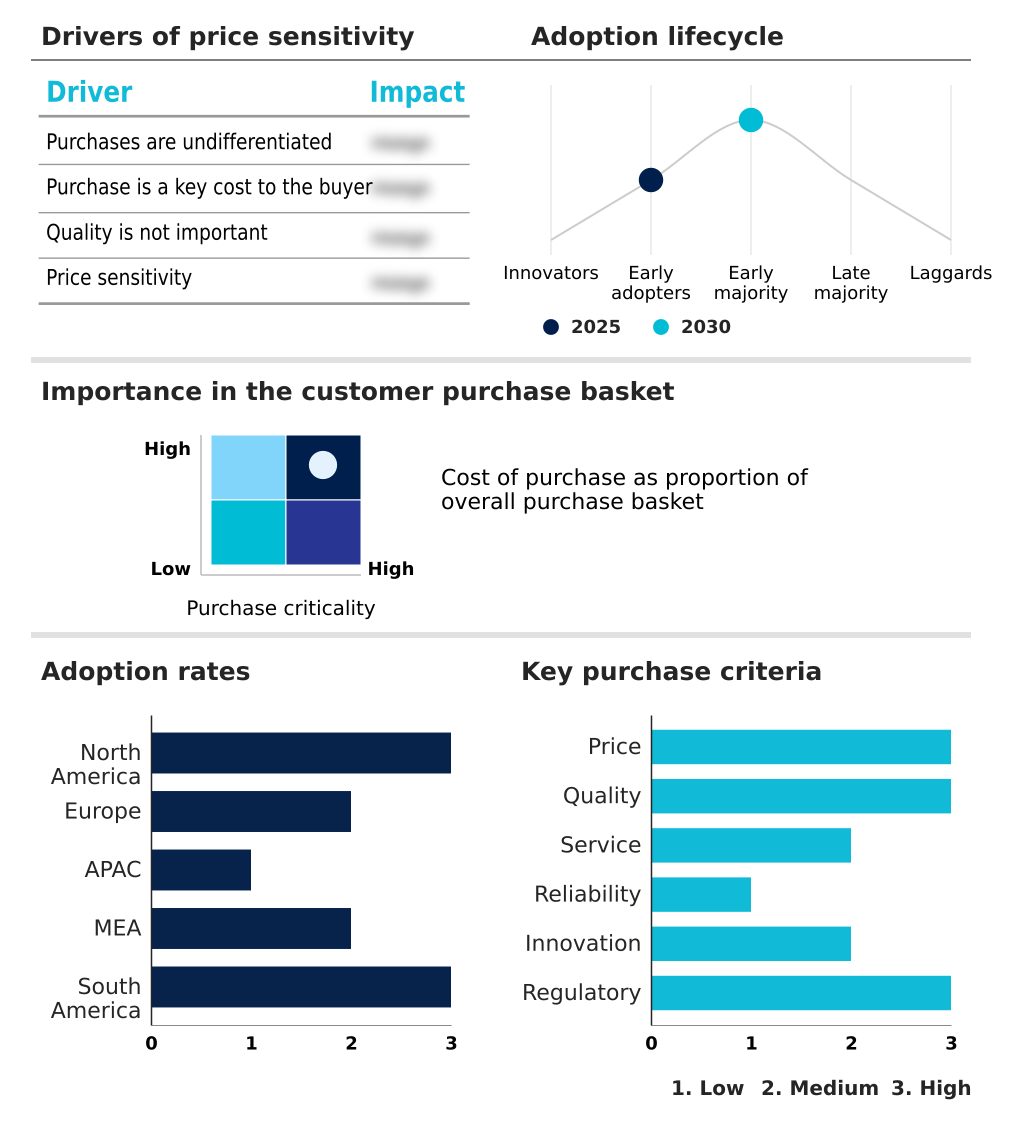
Customer Landscape of Plant Asset Management (PAM) Industry

Competitive Landscape

Companies are implementing various strategies, such as strategic alliances, plant asset management (pam) market forecast, partnerships, mergers and acquisitions, geographical expansion, and product/service launches, to enhance their presence in the industry.

AB SKF - The company offers plant asset management solutions, including integrated asset lifecycle management platforms that enhance operational oversight and performance.

The industry research and growth report includes detailed analyses of the competitive landscape of the market and information about key companies, including:

  • AB SKF
  • ABB Ltd.
  • Aspen Technology Inc.
  • AVEVA Group Plc
  • Dassault Systemes SE
  • Emerson Electric Co.
  • Endress Hauser Grp Services
  • Hexagon AB
  • Hitachi Ltd.
  • Honeywell International Inc.
  • IBM Corp.
  • IFS World Operations AB
  • Oracle Corp.
  • Rockwell Automation Inc.
  • SAP SE
  • Schneider Electric SE
  • Yokogawa Electric Corp.

Qualitative and quantitative analysis of companies has been conducted to help clients understand the wider business environment as well as the strengths and weaknesses of key industry players. Data is qualitatively analyzed to categorize companies as pure play, category-focused, industry-focused, and diversified; it is quantitatively analyzed to categorize companies as dominant, leading, strong, tentative, and weak.

Market Intelligence Radar: High-Impact Developments & Growth Signals

  • In the Diversified Support Services industry, the shift toward outcome-based contracts for industrial maintenance has intensified, directly impacting the Plant Asset Management (PAM) market by making uptime optimization and asset reliability metrics essential for service provider profitability. This trend compels providers to adopt advanced PAM tools to guarantee performance levels, linking their revenue directly to effective data-driven decision making.
  • The widespread adoption of digital workflow management and mobile platforms for field service operations is reshaping industrial support, creating demand in the Plant Asset Management (PAM) market for solutions with robust data interoperability and mobile-first work order management capabilities to improve workforce productivity.
  • A growing client emphasis on meeting sustainability goals and comprehensive ESG reporting requirements is driving demand for support services that can quantify environmental impact. This affects the Plant Asset Management (PAM) market by prioritizing solutions that enable precise carbon footprint reduction and energy consumption tracking at the individual asset level.
  • Stricter occupational safety regulations and liability standards for third-party contractors are compelling support service firms to enhance oversight. This boosts the Plant Asset Management (PAM) market by increasing the need for integrated safety, compliance, and remote diagnostics modules to ensure procedural adherence and mitigate operational risks.

Dive into Technavio’s robust research methodology, blending expert interviews, extensive data synthesis, and validated models for unparalleled Plant Asset Management (PAM) Market insights. See full methodology.

Market Scope
Page number 303
Base year 2025
Historic period 2020-2024
Forecast period 2026-2030
Growth momentum & CAGR Accelerate at a CAGR of 8.3%
Market growth 2026-2030 USD 2993.6 million
Market structure Fragmented
YoY growth 2025-2026(%) 7.8%
Key countries US, Canada, Mexico, Germany, UK, France, Italy, Spain, The Netherlands, China, Japan, India, South Korea, Australia, Indonesia, Saudi Arabia, UAE, South Africa, Qatar, Nigeria, Brazil, Argentina and Chile
Competitive landscape Leading Companies, Market Positioning of Companies, Competitive Strategies, and Industry Risks

Request Free Sample

Research Analyst Overview

  • The Plant Asset Management (PAM) market ecosystem operates with a significant reliance, over 65%, on specialized technology providers for critical components like IIoT sensors, edge computing hardware, and advanced analytics software. These suppliers form the foundation of the value chain, enabling PAM solution providers to build comprehensive platforms for asset performance management.
  • End-users, primarily in capital-intensive sectors such as power generation, oil and gas, and manufacturing, adopt these systems to improve asset reliability by up to 25% and ensure adherence to standards like ISO 55000. System integrators and consultants play a crucial role in bridging the gap between modern software and legacy system integration, a challenge that affects a majority of industrial facilities.
  • This interaction among technology suppliers, solution vendors, and service partners creates a complex but interconnected network focused on delivering measurable operational efficiency.

What are the Key Data Covered in this Plant Asset Management (PAM) Market Research and Growth Report?

  • What is the expected growth of the Plant Asset Management (PAM) Market between 2026 and 2030?

    • The Plant Asset Management (PAM) Market is expected to grow by USD 2.99 billion during 2026-2030, registering a CAGR of 8.3%. Year-over-year growth in 2026 is estimated at 7.8%%. This acceleration is shaped by integration of cognitive computing and universal interoperability standards, which is intensifying demand across multiple end-use verticals covered in the report.

  • What segmentation does the market report cover?

    • The report is segmented by Deployment (Cloud, and On-premises), End-user (Power industry, Pulp and paper industry, Oil and gas industry, Refining industry, and Others), Component (Software, and Services) and Geography (North America, Europe, APAC, Middle East and Africa, South America). Among these, the Cloud segment is estimated to witness significant growth during the forecast period, driven by rising adoption across key application areas. Each segment includes detailed qualitative and quantitative analysis, along with historical data from 2020-2024 and forecasts through 2030 with year-over-year growth rates.

  • Which regions are analyzed in the report?

    • The report covers North America, Europe, APAC, Middle East and Africa and South America. North America is estimated to contribute 51.2% to market growth during the forecast period. Country-level analysis includes US, Canada, Mexico, Germany, UK, France, Italy, Spain, The Netherlands, China, Japan, India, South Korea, Australia, Indonesia, Saudi Arabia, UAE, South Africa, Qatar, Nigeria, Brazil, Argentina and Chile, with dedicated market size tables and year-over-year growth for each.

  • What are the key growth drivers and market challenges?

    • The primary driver is integration of cognitive computing and universal interoperability standards, which is accelerating investment and industry demand. The main challenge is cybersecurity vulnerabilities and risks of digital convergence, creating operational barriers for key market participants. The report quantifies the impact of each driver and challenge across 2026 and 2030 with comparative analysis.

  • Who are the major players in the Plant Asset Management (PAM) Market?

    • Key vendors include AB SKF, ABB Ltd., Aspen Technology Inc., AVEVA Group Plc, Dassault Systemes SE, Emerson Electric Co., Endress Hauser Grp Services, Hexagon AB, Hitachi Ltd., Honeywell International Inc., IBM Corp., IFS World Operations AB, Oracle Corp., Rockwell Automation Inc., SAP SE, Schneider Electric SE and Yokogawa Electric Corp.. The report provides qualitative and quantitative analysis categorizing companies as dominant, leading, strong, tentative, and weak based on their market positioning. Company profiles include business segment analysis, SWOT assessment, key offerings, and recent strategic developments.

Market Research Insights

  • The competitive landscape, where the top five vendors account for over 45% of the market, is characterized by intense innovation in analytics and industrial automation. Leading firms like ABB Ltd. and Emerson Electric Co. are embedding AI-driven analytics into their platforms to enhance predictive accuracy, with some solutions improving fault detection by over 25%.
  • These advancements directly address enterprise demand for greater uptime optimization and operational efficiency. Strategic partnerships between software developers and hardware manufacturers are accelerating R&D cycles, leading to more integrated and resilient cyber-physical systems. However, the industry grapples with the ongoing challenge of legacy system integration, which can slow down the adoption of newer, more capable technologies across established industrial facilities.

We can help! Our analysts can customize this plant asset management (pam) market research report to meet your requirements.

Get in touch

1. Executive Summary

1.1 Market overview

Executive Summary - Chart on Market Overview
Executive Summary - Data Table on Market Overview
Executive Summary - Chart on Global Market Characteristics
Executive Summary - Chart on Market by Geography
Executive Summary - Chart on Market Segmentation by Deployment
Executive Summary - Chart on Market Segmentation by End-user
Executive Summary - Chart on Market Segmentation by Component
Executive Summary - Chart on Incremental Growth
Executive Summary - Data Table on Incremental Growth
Executive Summary - Chart on Company Market Positioning

2. Technavio Analysis

2.1 Analysis of price sensitivity, lifecycle, customer purchase basket, adoption rates, and purchase criteria

2.2 Criticality of inputs and Factors of differentiation

Chart on Overview on criticality of inputs and factors of differentiation

2.3 Factors of disruption

Chart on Overview on factors of disruption

2.4 Impact of drivers and challenges

Chart on Impact of drivers and challenges in 2025 and 2030

3. Market Landscape

3.1 Market ecosystem

Chart on Parent Market
Data Table on - Parent Market

3.2 Market characteristics

Chart on Market characteristics analysis

3.3 Value chain analysis

Chart on Value chain analysis

4. Market Sizing

4.1 Market definition

Data Table on Offerings of companies included in the market definition

4.2 Market segment analysis

Market segments

4.3 Market size 2025

4.4 Market outlook: Forecast for 2025-2030

Chart on Global - Market size and forecast 2025-2030 ($ million)
Data Table on Global - Market size and forecast 2025-2030 ($ million)
Chart on Global Market: Year-over-year growth 2025-2030 (%)
Data Table on Global Market: Year-over-year growth 2025-2030 (%)

5. Historic Market Size

5.1 Global Plant Asset Management (PAM) Market 2020 - 2024

Historic Market Size - Data Table on Global Plant Asset Management (PAM) Market 2020 - 2024 ($ million)

5.2 Deployment segment analysis 2020 - 2024

Historic Market Size - Deployment Segment 2020 - 2024 ($ million)

5.3 End-user segment analysis 2020 - 2024

Historic Market Size - End-user Segment 2020 - 2024 ($ million)

5.4 Component segment analysis 2020 - 2024

Historic Market Size - Component Segment 2020 - 2024 ($ million)

5.5 Geography segment analysis 2020 - 2024

Historic Market Size - Geography Segment 2020 - 2024 ($ million)

5.6 Country segment analysis 2020 - 2024

Historic Market Size - Country Segment 2020 - 2024 ($ million)

6. Qualitative Analysis

6.1 Impact of AI in Global Plant Asset Management (PAM) Market

7. Five Forces Analysis

7.1 Five forces summary

Five forces analysis - Comparison between 2025 and 2030

7.2 Bargaining power of buyers

Bargaining power of buyers - Impact of key factors 2025 and 2030

7.3 Bargaining power of suppliers

Bargaining power of suppliers - Impact of key factors in 2025 and 2030

7.4 Threat of new entrants

Threat of new entrants - Impact of key factors in 2025 and 2030

7.5 Threat of substitutes

Threat of substitutes - Impact of key factors in 2025 and 2030

7.6 Threat of rivalry

Threat of rivalry - Impact of key factors in 2025 and 2030

7.7 Market condition

Chart on Market condition - Five forces 2025 and 2030

8. Market Segmentation by Deployment

8.1 Market segments

Chart on Deployment - Market share 2025-2030 (%)
Data Table on Deployment - Market share 2025-2030 (%)

8.2 Comparison by Deployment

Chart on Comparison by Deployment
Data Table on Comparison by Deployment

8.3 Cloud - Market size and forecast 2025-2030

Chart on Cloud - Market size and forecast 2025-2030 ($ million)
Data Table on Cloud - Market size and forecast 2025-2030 ($ million)
Chart on Cloud - Year-over-year growth 2025-2030 (%)
Data Table on Cloud - Year-over-year growth 2025-2030 (%)

8.4 On-premises - Market size and forecast 2025-2030

Chart on On-premises - Market size and forecast 2025-2030 ($ million)
Data Table on On-premises - Market size and forecast 2025-2030 ($ million)
Chart on On-premises - Year-over-year growth 2025-2030 (%)
Data Table on On-premises - Year-over-year growth 2025-2030 (%)

8.5 Market opportunity by Deployment

Market opportunity by Deployment ($ million)
Data Table on Market opportunity by Deployment ($ million)

9. Market Segmentation by End-user

9.1 Market segments

Chart on End-user - Market share 2025-2030 (%)
Data Table on End-user - Market share 2025-2030 (%)

9.2 Comparison by End-user

Chart on Comparison by End-user
Data Table on Comparison by End-user

9.3 Power industry - Market size and forecast 2025-2030

Chart on Power industry - Market size and forecast 2025-2030 ($ million)
Data Table on Power industry - Market size and forecast 2025-2030 ($ million)
Chart on Power industry - Year-over-year growth 2025-2030 (%)
Data Table on Power industry - Year-over-year growth 2025-2030 (%)

9.4 Pulp and paper industry - Market size and forecast 2025-2030

Chart on Pulp and paper industry - Market size and forecast 2025-2030 ($ million)
Data Table on Pulp and paper industry - Market size and forecast 2025-2030 ($ million)
Chart on Pulp and paper industry - Year-over-year growth 2025-2030 (%)
Data Table on Pulp and paper industry - Year-over-year growth 2025-2030 (%)

9.5 Oil and gas industry - Market size and forecast 2025-2030

Chart on Oil and gas industry - Market size and forecast 2025-2030 ($ million)
Data Table on Oil and gas industry - Market size and forecast 2025-2030 ($ million)
Chart on Oil and gas industry - Year-over-year growth 2025-2030 (%)
Data Table on Oil and gas industry - Year-over-year growth 2025-2030 (%)

9.6 Refining industry - Market size and forecast 2025-2030

Chart on Refining industry - Market size and forecast 2025-2030 ($ million)
Data Table on Refining industry - Market size and forecast 2025-2030 ($ million)
Chart on Refining industry - Year-over-year growth 2025-2030 (%)
Data Table on Refining industry - Year-over-year growth 2025-2030 (%)

9.7 Others - Market size and forecast 2025-2030

Chart on Others - Market size and forecast 2025-2030 ($ million)
Data Table on Others - Market size and forecast 2025-2030 ($ million)
Chart on Others - Year-over-year growth 2025-2030 (%)
Data Table on Others - Year-over-year growth 2025-2030 (%)

9.8 Market opportunity by End-user

Market opportunity by End-user ($ million)
Data Table on Market opportunity by End-user ($ million)

10. Market Segmentation by Component

10.1 Market segments

Chart on Component - Market share 2025-2030 (%)
Data Table on Component - Market share 2025-2030 (%)

10.2 Comparison by Component

Chart on Comparison by Component
Data Table on Comparison by Component

10.3 Software - Market size and forecast 2025-2030

Chart on Software - Market size and forecast 2025-2030 ($ million)
Data Table on Software - Market size and forecast 2025-2030 ($ million)
Chart on Software - Year-over-year growth 2025-2030 (%)
Data Table on Software - Year-over-year growth 2025-2030 (%)

10.4 Services - Market size and forecast 2025-2030

Chart on Services - Market size and forecast 2025-2030 ($ million)
Data Table on Services - Market size and forecast 2025-2030 ($ million)
Chart on Services - Year-over-year growth 2025-2030 (%)
Data Table on Services - Year-over-year growth 2025-2030 (%)

10.5 Market opportunity by Component

Market opportunity by Component ($ million)
Data Table on Market opportunity by Component ($ million)

11. Customer Landscape

11.1 Customer landscape overview

Analysis of price sensitivity, lifecycle, customer purchase basket, adoption rates, and purchase criteria

12. Geographic Landscape

12.1 Geographic segmentation

Chart on Market share by geography 2025-2030 (%)
Data Table on Market share by geography 2025-2030 (%)

12.2 Geographic comparison

Chart on Geographic comparison
Data Table on Geographic comparison

12.3 North America - Market size and forecast 2025-2030

Chart on North America - Market size and forecast 2025-2030 ($ million)
Data Table on North America - Market size and forecast 2025-2030 ($ million)
Chart on North America - Year-over-year growth 2025-2030 (%)
Data Table on North America - Year-over-year growth 2025-2030 (%)
Chart on Regional Comparison - North America
Data Table on Regional Comparison - North America

12.3.1 US - Market size and forecast 2025-2030

Chart on US - Market size and forecast 2025-2030 ($ million)
Data Table on US - Market size and forecast 2025-2030 ($ million)
Chart on US - Year-over-year growth 2025-2030 (%)
Data Table on US - Year-over-year growth 2025-2030 (%)

12.3.2 Canada - Market size and forecast 2025-2030

Chart on Canada - Market size and forecast 2025-2030 ($ million)
Data Table on Canada - Market size and forecast 2025-2030 ($ million)
Chart on Canada - Year-over-year growth 2025-2030 (%)
Data Table on Canada - Year-over-year growth 2025-2030 (%)

12.3.3 Mexico - Market size and forecast 2025-2030

Chart on Mexico - Market size and forecast 2025-2030 ($ million)
Data Table on Mexico - Market size and forecast 2025-2030 ($ million)
Chart on Mexico - Year-over-year growth 2025-2030 (%)
Data Table on Mexico - Year-over-year growth 2025-2030 (%)

12.4 Europe - Market size and forecast 2025-2030

Chart on Europe - Market size and forecast 2025-2030 ($ million)
Data Table on Europe - Market size and forecast 2025-2030 ($ million)
Chart on Europe - Year-over-year growth 2025-2030 (%)
Data Table on Europe - Year-over-year growth 2025-2030 (%)
Chart on Regional Comparison - Europe
Data Table on Regional Comparison - Europe

12.4.1 Germany - Market size and forecast 2025-2030

Chart on Germany - Market size and forecast 2025-2030 ($ million)
Data Table on Germany - Market size and forecast 2025-2030 ($ million)
Chart on Germany - Year-over-year growth 2025-2030 (%)
Data Table on Germany - Year-over-year growth 2025-2030 (%)

12.4.2 UK - Market size and forecast 2025-2030

Chart on UK - Market size and forecast 2025-2030 ($ million)
Data Table on UK - Market size and forecast 2025-2030 ($ million)
Chart on UK - Year-over-year growth 2025-2030 (%)
Data Table on UK - Year-over-year growth 2025-2030 (%)

12.4.3 France - Market size and forecast 2025-2030

Chart on France - Market size and forecast 2025-2030 ($ million)
Data Table on France - Market size and forecast 2025-2030 ($ million)
Chart on France - Year-over-year growth 2025-2030 (%)
Data Table on France - Year-over-year growth 2025-2030 (%)

12.4.4 Italy - Market size and forecast 2025-2030

Chart on Italy - Market size and forecast 2025-2030 ($ million)
Data Table on Italy - Market size and forecast 2025-2030 ($ million)
Chart on Italy - Year-over-year growth 2025-2030 (%)
Data Table on Italy - Year-over-year growth 2025-2030 (%)

12.4.5 Spain - Market size and forecast 2025-2030

Chart on Spain - Market size and forecast 2025-2030 ($ million)
Data Table on Spain - Market size and forecast 2025-2030 ($ million)
Chart on Spain - Year-over-year growth 2025-2030 (%)
Data Table on Spain - Year-over-year growth 2025-2030 (%)

12.4.6 The Netherlands - Market size and forecast 2025-2030

Chart on The Netherlands - Market size and forecast 2025-2030 ($ million)
Data Table on The Netherlands - Market size and forecast 2025-2030 ($ million)
Chart on The Netherlands - Year-over-year growth 2025-2030 (%)
Data Table on The Netherlands - Year-over-year growth 2025-2030 (%)

12.5 APAC - Market size and forecast 2025-2030

Chart on APAC - Market size and forecast 2025-2030 ($ million)
Data Table on APAC - Market size and forecast 2025-2030 ($ million)
Chart on APAC - Year-over-year growth 2025-2030 (%)
Data Table on APAC - Year-over-year growth 2025-2030 (%)
Chart on Regional Comparison - APAC
Data Table on Regional Comparison - APAC

12.5.1 China - Market size and forecast 2025-2030

Chart on China - Market size and forecast 2025-2030 ($ million)
Data Table on China - Market size and forecast 2025-2030 ($ million)
Chart on China - Year-over-year growth 2025-2030 (%)
Data Table on China - Year-over-year growth 2025-2030 (%)

12.5.2 Japan - Market size and forecast 2025-2030

Chart on Japan - Market size and forecast 2025-2030 ($ million)
Data Table on Japan - Market size and forecast 2025-2030 ($ million)
Chart on Japan - Year-over-year growth 2025-2030 (%)
Data Table on Japan - Year-over-year growth 2025-2030 (%)

12.5.3 India - Market size and forecast 2025-2030

Chart on India - Market size and forecast 2025-2030 ($ million)
Data Table on India - Market size and forecast 2025-2030 ($ million)
Chart on India - Year-over-year growth 2025-2030 (%)
Data Table on India - Year-over-year growth 2025-2030 (%)

12.5.4 South Korea - Market size and forecast 2025-2030

Chart on South Korea - Market size and forecast 2025-2030 ($ million)
Data Table on South Korea - Market size and forecast 2025-2030 ($ million)
Chart on South Korea - Year-over-year growth 2025-2030 (%)
Data Table on South Korea - Year-over-year growth 2025-2030 (%)

12.5.5 Australia - Market size and forecast 2025-2030

Chart on Australia - Market size and forecast 2025-2030 ($ million)
Data Table on Australia - Market size and forecast 2025-2030 ($ million)
Chart on Australia - Year-over-year growth 2025-2030 (%)
Data Table on Australia - Year-over-year growth 2025-2030 (%)

12.5.6 Indonesia - Market size and forecast 2025-2030

Chart on Indonesia - Market size and forecast 2025-2030 ($ million)
Data Table on Indonesia - Market size and forecast 2025-2030 ($ million)
Chart on Indonesia - Year-over-year growth 2025-2030 (%)
Data Table on Indonesia - Year-over-year growth 2025-2030 (%)

12.6 Middle East and Africa - Market size and forecast 2025-2030

Chart on Middle East and Africa - Market size and forecast 2025-2030 ($ million)
Data Table on Middle East and Africa - Market size and forecast 2025-2030 ($ million)
Chart on Middle East and Africa - Year-over-year growth 2025-2030 (%)
Data Table on Middle East and Africa - Year-over-year growth 2025-2030 (%)
Chart on Regional Comparison - Middle East and Africa
Data Table on Regional Comparison - Middle East and Africa

12.6.1 Saudi Arabia - Market size and forecast 2025-2030

Chart on Saudi Arabia - Market size and forecast 2025-2030 ($ million)
Data Table on Saudi Arabia - Market size and forecast 2025-2030 ($ million)
Chart on Saudi Arabia - Year-over-year growth 2025-2030 (%)
Data Table on Saudi Arabia - Year-over-year growth 2025-2030 (%)

12.6.2 UAE - Market size and forecast 2025-2030

Chart on UAE - Market size and forecast 2025-2030 ($ million)
Data Table on UAE - Market size and forecast 2025-2030 ($ million)
Chart on UAE - Year-over-year growth 2025-2030 (%)
Data Table on UAE - Year-over-year growth 2025-2030 (%)

12.6.3 South Africa - Market size and forecast 2025-2030

Chart on South Africa - Market size and forecast 2025-2030 ($ million)
Data Table on South Africa - Market size and forecast 2025-2030 ($ million)
Chart on South Africa - Year-over-year growth 2025-2030 (%)
Data Table on South Africa - Year-over-year growth 2025-2030 (%)

12.6.4 Qatar - Market size and forecast 2025-2030

Chart on Qatar - Market size and forecast 2025-2030 ($ million)
Data Table on Qatar - Market size and forecast 2025-2030 ($ million)
Chart on Qatar - Year-over-year growth 2025-2030 (%)
Data Table on Qatar - Year-over-year growth 2025-2030 (%)

12.6.5 Nigeria - Market size and forecast 2025-2030

Chart on Nigeria - Market size and forecast 2025-2030 ($ million)
Data Table on Nigeria - Market size and forecast 2025-2030 ($ million)
Chart on Nigeria - Year-over-year growth 2025-2030 (%)
Data Table on Nigeria - Year-over-year growth 2025-2030 (%)

12.7 South America - Market size and forecast 2025-2030

Chart on South America - Market size and forecast 2025-2030 ($ million)
Data Table on South America - Market size and forecast 2025-2030 ($ million)
Chart on South America - Year-over-year growth 2025-2030 (%)
Data Table on South America - Year-over-year growth 2025-2030 (%)
Chart on Regional Comparison - South America
Data Table on Regional Comparison - South America

12.7.1 Brazil - Market size and forecast 2025-2030

Chart on Brazil - Market size and forecast 2025-2030 ($ million)
Data Table on Brazil - Market size and forecast 2025-2030 ($ million)
Chart on Brazil - Year-over-year growth 2025-2030 (%)
Data Table on Brazil - Year-over-year growth 2025-2030 (%)

12.7.2 Argentina - Market size and forecast 2025-2030

Chart on Argentina - Market size and forecast 2025-2030 ($ million)
Data Table on Argentina - Market size and forecast 2025-2030 ($ million)
Chart on Argentina - Year-over-year growth 2025-2030 (%)
Data Table on Argentina - Year-over-year growth 2025-2030 (%)

12.7.3 Chile - Market size and forecast 2025-2030

Chart on Chile - Market size and forecast 2025-2030 ($ million)
Data Table on Chile - Market size and forecast 2025-2030 ($ million)
Chart on Chile - Year-over-year growth 2025-2030 (%)
Data Table on Chile - Year-over-year growth 2025-2030 (%)

12.8 Market opportunity by geography

Market opportunity by geography ($ million)
Data Tables on Market opportunity by geography ($ million)

13. Drivers, Challenges, and Opportunity

13.1 Market drivers

Integration of cognitive computing and universal interoperability standards
Regulatory compulsion toward environmental sustainability and resource efficiency
Proliferation of cloud-native platforms and remote diagnostic capabilities

13.2 Market challenges

Cybersecurity vulnerabilities and risks of digital convergence
Technical interoperability and burden of legacy infrastructure
Widening skills gap and workforce transition barriers

13.3 Impact of drivers and challenges

Impact of drivers and challenges in 2025 and 2030

13.4 Market opportunities

Integration of generative AI and predictive analytics in asset maintenance
Proliferation of edge computing and industrial IOT infrastructure
Adoption of digital twin technology for holistic asset lifecycle and management

14. Competitive Landscape

14.1 Overview

14.2

Overview on criticality of inputs and factors of differentiation

14.3 Landscape disruption

Overview on factors of disruption

14.4 Industry risks

Impact of key risks on business

15. Competitive Analysis

15.1 Companies profiled

Companies covered

15.2 Company ranking index

15.3 Market positioning of companies

Matrix on companies position and classification

15.4 AB SKF

AB SKF - Overview
AB SKF - Business segments
AB SKF - Key news
AB SKF - Key offerings
AB SKF - Segment focus
SWOT

15.5 ABB Ltd.

ABB Ltd. - Overview
ABB Ltd. - Business segments
ABB Ltd. - Key news
ABB Ltd. - Key offerings
ABB Ltd. - Segment focus
SWOT

15.6 Dassault Systemes SE

Dassault Systemes SE - Overview
Dassault Systemes SE - Business segments
Dassault Systemes SE - Key news
Dassault Systemes SE - Key offerings
Dassault Systemes SE - Segment focus
SWOT

15.7 Emerson Electric Co.

Emerson Electric Co. - Overview
Emerson Electric Co. - Business segments
Emerson Electric Co. - Key news
Emerson Electric Co. - Key offerings
Emerson Electric Co. - Segment focus
SWOT

15.8 Endress Hauser Grp Services

Endress Hauser Grp Services - Overview
Endress Hauser Grp Services - Product / Service
Endress Hauser Grp Services - Key news
Endress Hauser Grp Services - Key offerings
SWOT

15.9 Hexagon AB

Hexagon AB - Overview
Hexagon AB - Business segments
Hexagon AB - Key news
Hexagon AB - Key offerings
Hexagon AB - Segment focus
SWOT

15.10 Hitachi Ltd.

Hitachi Ltd. - Overview
Hitachi Ltd. - Business segments
Hitachi Ltd. - Key news
Hitachi Ltd. - Key offerings
Hitachi Ltd. - Segment focus
SWOT

15.11 Honeywell International Inc.

Honeywell International Inc. - Overview
Honeywell International Inc. - Business segments
Honeywell International Inc. - Key news
Honeywell International Inc. - Key offerings
Honeywell International Inc. - Segment focus
SWOT

15.12 IBM Corp.

IBM Corp. - Overview
IBM Corp. - Business segments
IBM Corp. - Key news
IBM Corp. - Key offerings
IBM Corp. - Segment focus
SWOT

15.13 IFS World Operations AB

IFS World Operations AB - Overview
IFS World Operations AB - Product / Service
IFS World Operations AB - Key offerings
SWOT

15.14 Oracle Corp.

Oracle Corp. - Overview
Oracle Corp. - Business segments
Oracle Corp. - Key news
Oracle Corp. - Key offerings
Oracle Corp. - Segment focus
SWOT

15.15 Rockwell Automation Inc.

Rockwell Automation Inc. - Overview
Rockwell Automation Inc. - Business segments
Rockwell Automation Inc. - Key news
Rockwell Automation Inc. - Key offerings
Rockwell Automation Inc. - Segment focus
SWOT

15.16 SAP SE

SAP SE - Overview
SAP SE - Business segments
SAP SE - Key news
SAP SE - Key offerings
SAP SE - Segment focus
SWOT

15.17 Schneider Electric SE

Schneider Electric SE - Overview
Schneider Electric SE - Business segments
Schneider Electric SE - Key news
Schneider Electric SE - Key offerings
Schneider Electric SE - Segment focus
SWOT

15.18 Yokogawa Electric Corp.

Yokogawa Electric Corp. - Overview
Yokogawa Electric Corp. - Business segments
Yokogawa Electric Corp. - Key news
Yokogawa Electric Corp. - Key offerings
Yokogawa Electric Corp. - Segment focus
SWOT

16. Appendix

16.1 Scope of the report

Market definition
Objectives
Notes and caveats

16.2 Inclusions and exclusions checklist

Inclusions checklist
Exclusions checklist

16.3 Currency conversion rates for US$

16.4 Research methodology

16.5 Data procurement

Information sources

16.6 Data validation

16.7 Validation techniques employed for market sizing

16.8 Data synthesis

16.9 360 degree market analysis

16.10 List of abbreviations

Research Methodology

Technavio presents a detailed picture of the market by way of study, synthesis, and summation of data from multiple sources. The analysts have presented the various facets of the market with a particular focus on identifying the key industry influencers. The data thus presented is comprehensive, reliable, and the result of extensive research, both primary and secondary.

INFORMATION SOURCES

Primary sources

  • Manufacturers and suppliers
  • Channel partners
  • Industry experts
  • Strategic decision makers

Secondary sources

  • Industry journals and periodicals
  • Government data
  • Financial reports of key industry players
  • Historical data
  • Press releases

DATA ANALYSIS

Data Synthesis

  • Collation of data
  • Estimation of key figures
  • Analysis of derived insights

Data Validation

  • Triangulation with data models
  • Reference against proprietary databases
  • Corroboration with industry experts

REPORT WRITING

Qualitative

  • Market drivers
  • Market challenges
  • Market trends
  • Five forces analysis

Quantitative

  • Market size and forecast
  • Market segmentation
  • Geographical insights
  • Competitive landscape

Interested in this report?

Get your sample now to see our research methodology and insights!

Download Now

Frequently Asked Questions

Plant Asset Management (PAM) market growth will increase by USD 2993.6 million during 2026-2030.

The Plant Asset Management (PAM) market is expected to grow at a CAGR of 8.3% during 2026-2030.

Plant Asset Management (PAM) market is segmented by Deployment (Cloud, On-premises) End-user (Power industry, Pulp and paper industry, Oil and gas industry, Refining industry, Others) Component (Software, Services)

AB SKF, ABB Ltd., Aspen Technology Inc., AVEVA Group Plc, Dassault Systemes SE, Emerson Electric Co., Endress Hauser Grp Services, Hexagon AB, Hitachi Ltd., Honeywell International Inc., IBM Corp., IFS World Operations AB, Oracle Corp., Rockwell Automation Inc., SAP SE, Schneider Electric SE, Yokogawa Electric Corp. are a few of the key vendors in the Plant Asset Management (PAM) market.

North America will register the highest growth rate of 51.2% among the other regions. Therefore, the Plant Asset Management (PAM) market in North America is expected to garner significant business opportunities for the vendors during the forecast period.

US, Canada, Mexico, Germany, UK, France, Italy, Spain, The Netherlands, China, Japan, India, South Korea, Australia, Indonesia, Saudi Arabia, UAE, South Africa, Qatar, Nigeria, Brazil, Argentina, Chile

  • Integration of cognitive computing and universal interoperability standards is the driving factor this market.

The Plant Asset Management (PAM) market vendors should focus on grabbing business opportunities from the Deployment segment as it accounted for the largest market share in the base year.
RIA - Research AI Assistant
Ask RIA