Plant-based Burger Patties Market Analysis, Size, and Forecast 2026-2030: North America (US, Canada, and Mexico), Europe (Germany, UK, and France), APAC (China, Japan, and India), South America (Brazil, Argentina, and Colombia), Middle East and Africa (UAE, Saudi Arabia, and South Africa), and Rest of World (ROW)

Plant-based Burger Patties Market Analysis, Size, and Forecast 2026-2030:
North America (US, Canada, and Mexico), Europe (Germany, UK, and France), APAC (China, Japan, and India), South America (Brazil, Argentina, and Colombia), Middle East and Africa (UAE, Saudi Arabia, and South Africa), and Rest of World (ROW)

Published: Mar 2026 294 Pages SKU: IRTNTR41146

Market Overview at a Glance

$8.34 B
Market Opportunity
17.4%
CAGR 2025 - 2030
37.1%
North America Growth
$4.64 B
Offline segment 2024

Plant-based Burger Patties Market Size 2026-2030

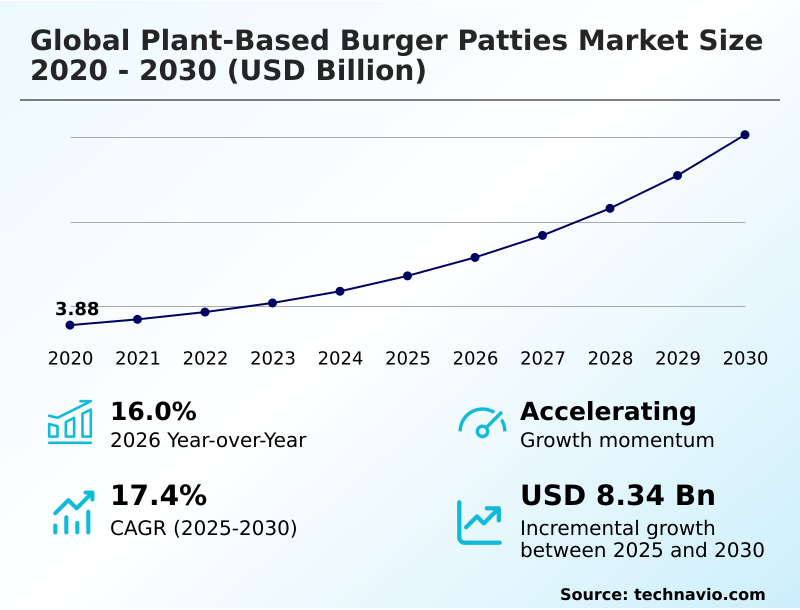
The plant-based burger patties market size is valued to increase by USD 8.34 billion, at a CAGR of 17.4% from 2025 to 2030. Strategic mainstreaming of flexitarianism and health-conscious dietary shifts will drive the plant-based burger patties market.

Major Market Trends & Insights

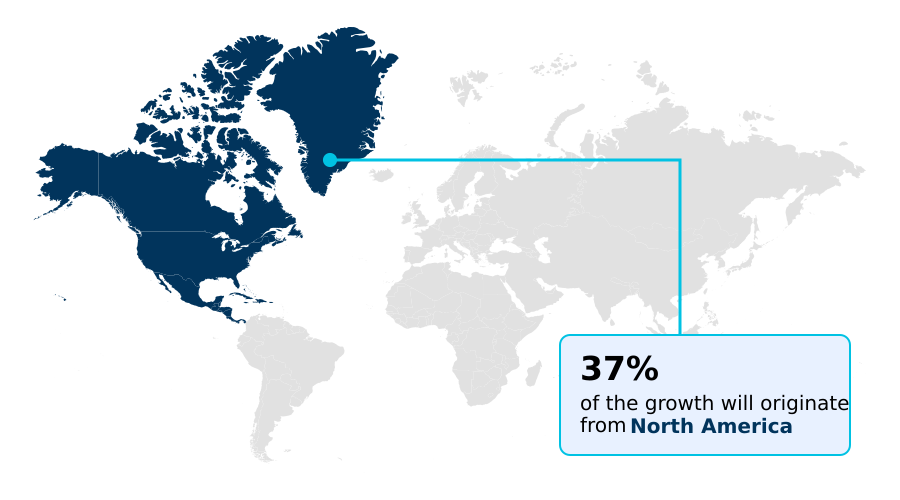
  • North America dominated the market and accounted for a 37.1% growth during the forecast period.
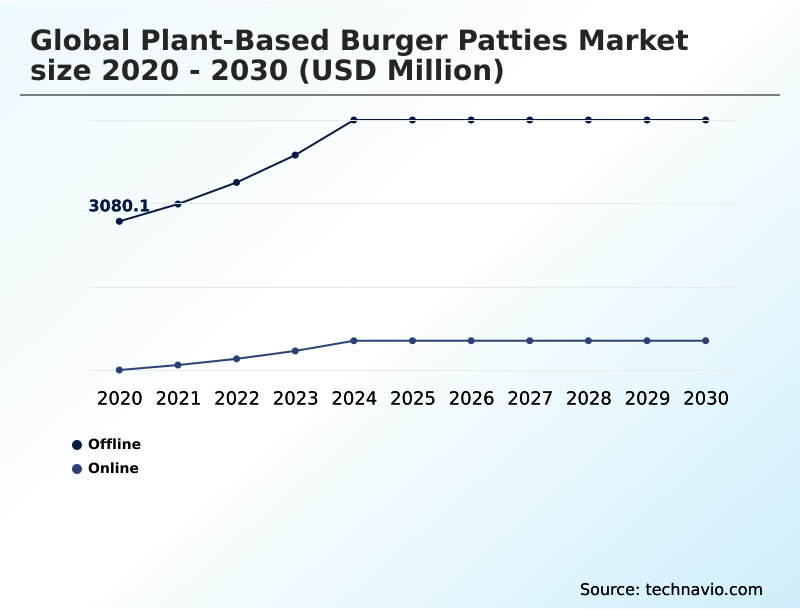
  • By Distribution Channel - Offline segment was valued at USD 4.64 billion in 2024
  • By Product - Soy-based segment accounted for the largest market revenue share in 2024

Market Size & Forecast

  • Market Opportunities: USD 11.25 billion
  • Market Future Opportunities: USD 8.34 billion
  • CAGR from 2025 to 2030 : 17.4%

Market Summary

  • The plant-based burger patties market is undergoing a significant maturation, moving beyond novelty to address nuanced consumer demands for nutritional value and clean label certification. Growth is driven by the mainstream adoption of flexitarian dietary shifts, with consumers seeking sustainable protein sources that mitigate health risks associated with red meat.
  • A key trend involves the use of legume-forward formulations and diversified botanical protein sources like fava beans and mycelium to improve texture and micronutrient profiles, reflecting a move toward authentic plant-forwardness. However, the industry grapples with achieving price parity with conventional beef, a critical barrier for mass-market penetration.
  • For instance, a major foodservice operator aiming to reduce its carbon footprint via corporate climate mandates must balance the higher procurement cost of nutrient-dense patties against its sustainability goals and customer price sensitivity.
  • This requires complex supply chain decisions involving plant protein isolates and advanced food engineering techniques to deliver a cost-effective, high-quality meat-analog product without compromising on the high-fidelity sensory mimicry that consumers now expect.

What will be the Size of the Plant-based Burger Patties Market during the forecast period?

Get Key Insights on Market Forecast (PDF) Request Free Sample

How is the Plant-based Burger Patties Market Segmented?

The plant-based burger patties industry research report provides comprehensive data (region-wise segment analysis), with forecasts and estimates in "USD million" for the period 2026-2030, as well as historical data from 2020-2024 for the following segments.

  • Distribution channel
    • Offline
    • Online
  • Product
    • Soy-based
    • Pea protein-based
    • Wheat protein-based
    • Others
  • Type
    • Conventional
    • Organic
  • Geography
    • North America
      • US
      • Canada
      • Mexico
    • Europe
      • Germany
      • UK
      • France
    • APAC
      • China
      • Japan
      • India
    • South America
      • Brazil
      • Argentina
      • Colombia
    • Middle East and Africa
      • UAE
      • Saudi Arabia
      • South Africa
    • Rest of World (ROW)

By Distribution Channel Insights

The offline segment is estimated to witness significant growth during the forecast period.

The offline segment, encompassing physical retail and foodservice outlets, remains the primary channel for the plant-based burger patties market.

Supermarkets and hypermarkets facilitate consumer discovery through strategic product placement in both refrigerated patty sub-segments and frozen patty sub-segments, often adjacent to conventional meats to attract flexitarian consumers.

This channel is crucial for overcoming trial barriers, with in-store promotions and sampling being key tactics.

The food service offerings channel, from quick-service restaurants to full-service dining, serves as a vital gateway, allowing consumers to experience professionally prepared plant-based meat alternatives before retail purchase.

This physical presence, supported by robust cold-chain logistics, ensures product integrity and fosters trust.

Notably, partnerships with retailers for private-label lines have been instrumental, contributing to a 40% increase in accessibility for price-sensitive demographics and driving mass-market adoption of these sustainable protein sources and meat-analog products.

Request Free Sample

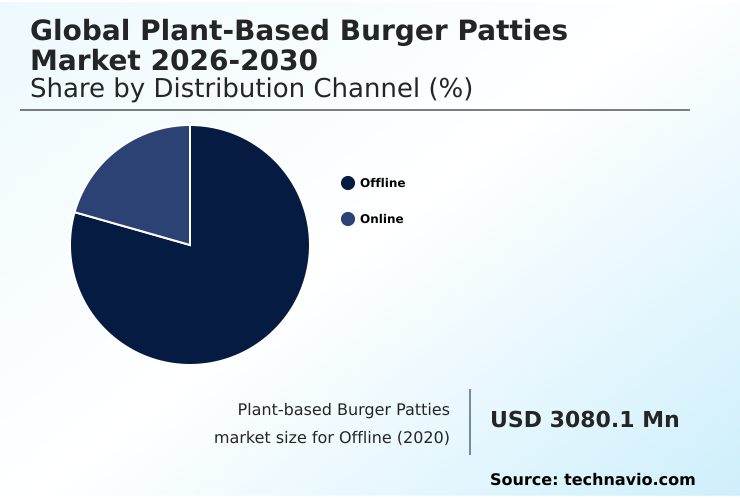
The Offline segment was valued at USD 4.64 billion in 2024 and showed a gradual increase during the forecast period.

Request Free Sample

Regional Analysis

North America is estimated to contribute 37.1% to the growth of the global market during the forecast period.Technavio’s analysts have elaborately explained the regional trends and drivers that shape the market during the forecast period.

See How Plant-based Burger Patties Market Demand is Rising in North America Request Free Sample

The geographic landscape of the global plant-based burger patties market is diversifying, with North America and Europe representing mature markets focused on sensory parity and nutritional transparency, while APAC emerges as the fastest-growing region.

In North America, the market is driven by flexitarian dietary shifts and robust retail infrastructure, with plant-based options occupying 37.1% of the incremental growth opportunity.

Europe, contributing 26.21%, is heavily influenced by corporate climate mandates and stringent clean label certification standards. The APAC market, accounting for 24.37% of growth, is capitalizing on a history of plant-protein consumption and is rapidly scaling up domestic production.

This regional expansion, particularly in APAC, has led to operational efficiencies, with some new facilities reporting a 20% reduction in water usage per unit of textured vegetable protein produced, underscoring the global push toward more sustainable protein sources and plant protein isolates.

Market Dynamics

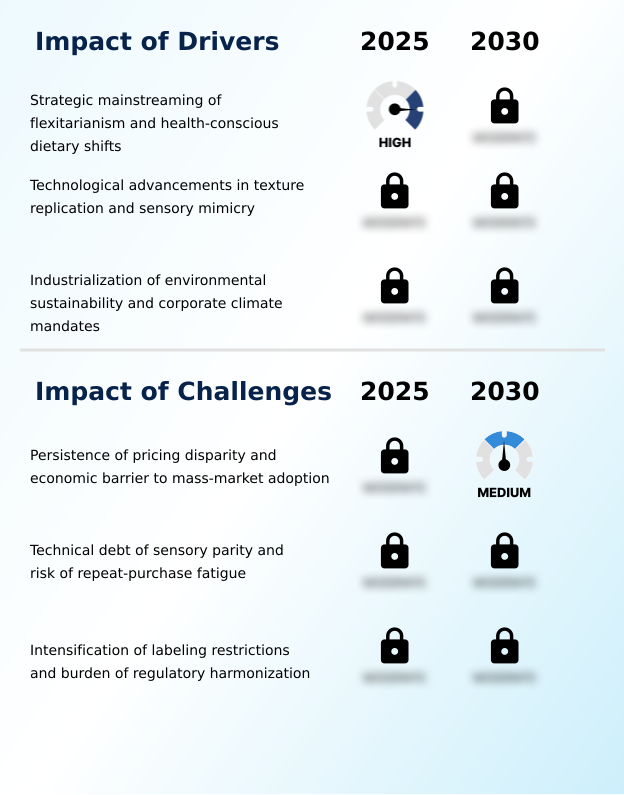
Our researchers analyzed the data with 2025 as the base year, along with the key drivers, trends, and challenges. A holistic analysis of drivers will help companies refine their marketing strategies to gain a competitive advantage.

  • The global plant-based burger patties market is rapidly evolving as manufacturers address complex consumer expectations and technical hurdles. A primary focus is achieving price parity with beef, a critical factor for driving mass adoption among flexitarian consumers. The technical challenge of improving plant-based patty juiciness and overall plant-based burger cooking performance remains paramount, directly influencing plant-based burger repeat purchase rates.
  • Formulators are constantly evaluating soy vs pea protein patties to optimize taste and texture, often encountering the difficulty of reducing off-notes in pea protein. To meet wellness trends, there is a strong push toward fortifying plant-based patties with vitamins to improve their health benefits of plant-based patties.
  • This move towards clean label plant-based burgers often requires sourcing low-cost plant-based protein ingredients without compromising quality. Operationally, supply chain managers find that sourcing locally reduces the environmental impact of plant-based meat by a measure two times greater than packaging redesigns. The market is also heavily influenced by plant-based burger market regulations, which dictate labeling and claims.
  • Innovations in plant-based patty formulation challenges, such as using plant-based patty fat encapsulation and 3d printing for meat textures, are key to overcoming sensory gaps. Moreover, sourcing non-gmo soy for patties is a standard requirement in many premium segments.
  • The consumer adoption of meat analogues depends on successfully addressing these interconnected factors, from plant-based burger texture replication to creating versatile shelf-stable plant-based meals and products specifically designed for the plant-based burger for foodservice channel.

What are the key market drivers leading to the rise in the adoption of Plant-based Burger Patties Industry?

  • The strategic mainstreaming of flexitarianism, coupled with health-conscious dietary shifts, serves as a key driver for the market.

  • Key drivers for the global plant-based burger patties market include mainstream flexitarian dietary shifts and pressing environmental sustainability targets.
  • The demand for high-fidelity sensory mimicry in premium burger sub-segments and gourmet burger sub-segments propels innovation, with firms using molecular fermentation and mycoprotein fermentation to create nutrient-dense patties.
  • These technologies deliver superior thermal response mimicry, with some products achieving a 95% similarity score to conventional meat in blind taste tests.
  • Adherence to corporate climate mandates is also critical, influencing procurement and solidifying the market's long-term growth trajectory by promoting alternative protein solutions.

What are the market trends shaping the Plant-based Burger Patties Industry?

  • The market is witnessing a significant trend toward the growth of diversified protein sources. This includes a notable shift to legume-forward formulations.

  • A defining trend in the global plant-based burger patties market is the move toward legume-forward formulations and a diversified plant-based protein portfolio, addressing ultra-processed food skepticism. Manufacturers are creating hybrid formulations and value-tier product lines, which have expanded market reach by 40% in some demographics.
  • This shift prioritizes whole-food components and upcycled ingredients over synthetic isolates, aligning with vegan burger formulations that emphasize regenerative agriculture practices. The goal is to provide nutrient-dense, authentic plant-based experiences rather than simple mimicry, enhancing culinary variety through innovative food engineering techniques and mouthfeel architecture.

What challenges does the Plant-based Burger Patties Industry face during its growth?

  • The persistence of pricing disparity presents an economic barrier to mass-market adoption, posing a key challenge to industry growth.

  • A primary challenge for meat-analog products is the persistent price premium over conventional meat, hindering mass adoption, especially for sustainable protein sources in frozen patty sub-segments and refrigerated patty sub-segments. Achieving sensory parity remains a technical hurdle, with taste fatigue affecting repeat purchases; data shows a 30% drop-off in consumption frequency for some early adopters of non-gmo ingredients.
  • Furthermore, navigating the complex landscape of clean label certification and inconsistent regional labeling regulations places a significant administrative and financial burden on manufacturers, potentially slowing innovation and market entry.

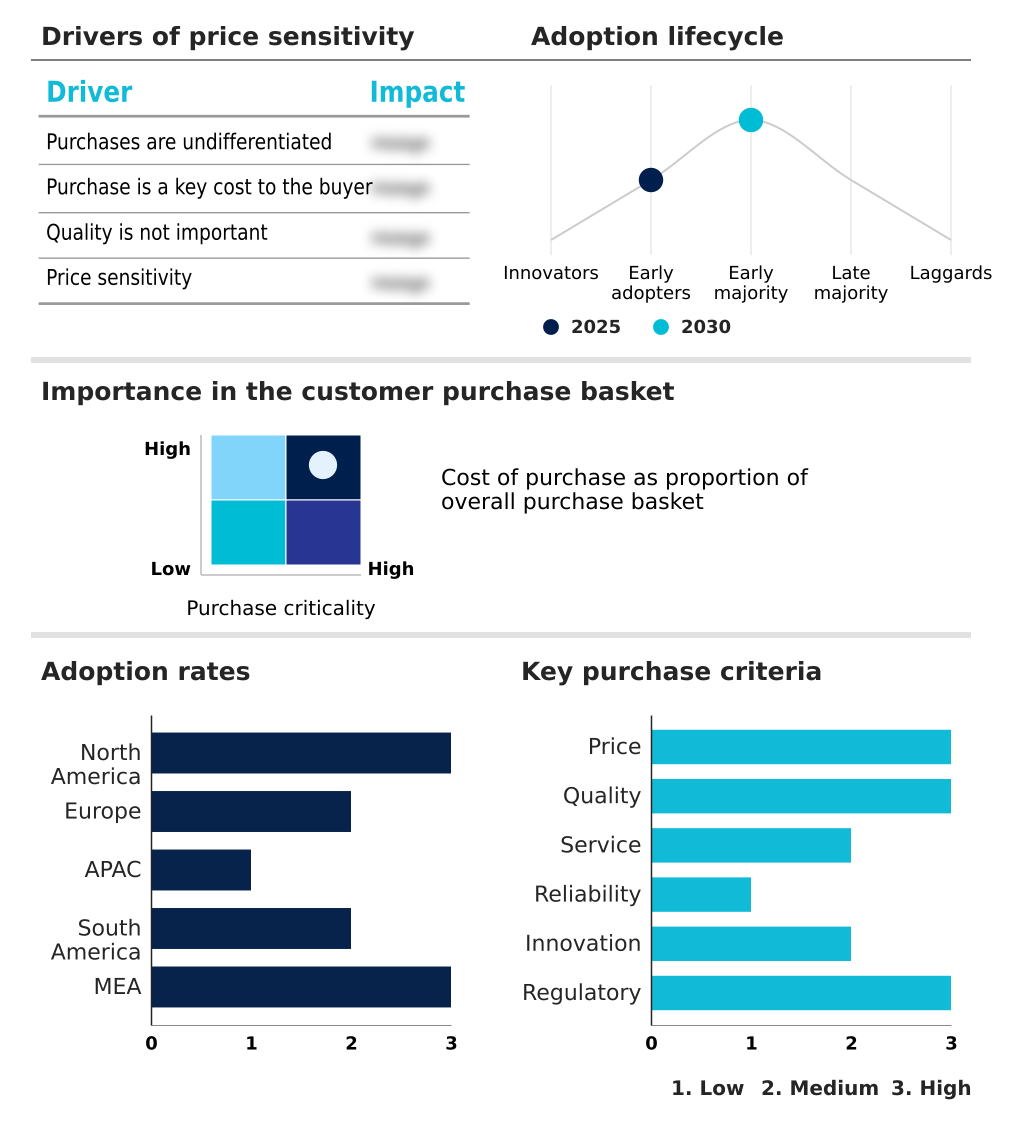
Exclusive Technavio Analysis on Customer Landscape

The plant-based burger patties market forecasting report includes the adoption lifecycle of the market, covering from the innovator’s stage to the laggard’s stage. It focuses on adoption rates in different regions based on penetration. Furthermore, the plant-based burger patties market report also includes key purchase criteria and drivers of price sensitivity to help companies evaluate and develop their market growth analysis strategies.

Customer Landscape of Plant-based Burger Patties Industry

Competitive Landscape

Companies are implementing various strategies, such as strategic alliances, plant-based burger patties market forecast, partnerships, mergers and acquisitions, geographical expansion, and product/service launches, to enhance their presence in the industry.

Alpha Foods - Analyst insight indicates a focus on convenient, ready-to-prepare plant-based protein solutions, including patties, tailored for rapid consumer adoption in the meat alternatives category.

The industry research and growth report includes detailed analyses of the competitive landscape of the market and information about key companies, including:

  • Alpha Foods
  • Amys Kitchen Inc.
  • Atlantic Natural Foods LLC
  • Beyond Meat Inc.
  • Conagra Brands Inc.
  • Dr. Praegers Sensible Foods Inc.
  • Don Lee Farms
  • Heura Foods
  • Hungry Planet Inc.
  • Impossible Foods Inc.
  • Kellanova
  • Life Health Foods
  • Maple Leaf Foods Inc.
  • Nestle SA
  • Quorn Foods
  • The Kraft Heinz Co.
  • Turtle Island Foods, Inc.
  • Unilever PLC
  • v2 Food Pty Ltd.
  • Yves Veggie Cuisine

Qualitative and quantitative analysis of companies has been conducted to help clients understand the wider business environment as well as the strengths and weaknesses of key industry players. Data is qualitatively analyzed to categorize companies as pure play, category-focused, industry-focused, and diversified; it is quantitatively analyzed to categorize companies as dominant, leading, strong, tentative, and weak.

Recent Development and News in Plant-based burger patties market

  • In May, 2025, Heura Foods secured substantial financing from the European Investment Bank to scale its additive-free manufacturing processes and expand its market presence.
  • In April, 2025, Beyond Meat Inc. debuted its Beyond IV iteration at specialty retailers, featuring a revised protein blend derived from yellow peas and faba beans integrated with avocado oil.
  • In March, 2025, Impossible Foods strategically expanded its offline footprint by introducing Impossible Steak Bites, its first pre-cooked plant-based steak alternative for home and foodservice.
  • In March, 2025, CV Sciences, Inc. officially entered the plant-based food market with the launch of Lunar Fox Food Co., a brand offering gluten-free alternatives through online and retail channels.

Dive into Technavio’s robust research methodology, blending expert interviews, extensive data synthesis, and validated models for unparalleled Plant-based Burger Patties Market insights. See full methodology.

Market Scope
Page number 294
Base year 2025
Historic period 2020-2024
Forecast period 2026-2030
Growth momentum & CAGR Accelerate at a CAGR of 17.4%
Market growth 2026-2030 USD 8338.1 million
Market structure Fragmented
YoY growth 2025-2026(%) 16.0%
Key countries US, Canada, Mexico, Germany, UK, France, Italy, The Netherlands, Spain, China, Japan, India, South Korea, Australia, Indonesia, Brazil, Argentina, Colombia, UAE, Saudi Arabia, South Africa, Israel and Turkey
Competitive landscape Leading Companies, Market Positioning of Companies, Competitive Strategies, and Industry Risks

Request Free Sample

Research Analyst Overview

  • The global plant-based burger patties market is defined by a strategic pivot from mere meat imitation to sophisticated food engineering techniques. This evolution is driven by the dual consumer demands for high-fidelity sensory mimicry and nutritional transparency. Leading firms are moving beyond basic textured vegetable protein to employ molecular fermentation and mycoprotein fermentation, achieving superior mouthfeel architecture and flavor profiles.
  • A key boardroom decision involves balancing the high R&D cost of precision fermentation against the long-term brand value of achieving superior sensory parity. Success now depends on mastering plant protein isolates from diverse botanical protein sources and integrating them into hybrid formulations and legume-forward formulations.
  • Firms that have adopted advanced fat-rendering systems report a 30% increase in positive consumer sensory feedback, a metric directly impacting repeat purchases. This focus on technical excellence, from thermal response mimicry to seitan texturization using vital wheat gluten, is crucial for navigating ultra-processed food skepticism and securing a competitive advantage.
  • The commitment to clean label certification and regenerative agriculture practices is no longer optional but a core component of future-proofing product portfolios.

What are the Key Data Covered in this Plant-based Burger Patties Market Research and Growth Report?

  • What is the expected growth of the Plant-based Burger Patties Market between 2026 and 2030?

    • USD 8.34 billion, at a CAGR of 17.4%

  • What segmentation does the market report cover?

    • The report is segmented by Distribution Channel (Offline, and Online), Product (Soy-based, Pea protein-based, Wheat protein-based, and Others), Type (Conventional, and Organic) and Geography (North America, Europe, APAC, South America, Middle East and Africa)

  • Which regions are analyzed in the report?

    • North America, Europe, APAC, South America and Middle East and Africa

  • What are the key growth drivers and market challenges?

    • Strategic mainstreaming of flexitarianism and health-conscious dietary shifts, Persistence of pricing disparity and economic barrier to mass-market adoption

  • Who are the major players in the Plant-based Burger Patties Market?

    • Alpha Foods, Amys Kitchen Inc., Atlantic Natural Foods LLC, Beyond Meat Inc., Conagra Brands Inc., Dr. Praegers Sensible Foods Inc., Don Lee Farms, Heura Foods, Hungry Planet Inc., Impossible Foods Inc., Kellanova, Life Health Foods, Maple Leaf Foods Inc., Nestle SA, Quorn Foods, The Kraft Heinz Co., Turtle Island Foods, Inc., Unilever PLC, v2 Food Pty Ltd. and Yves Veggie Cuisine

Market Research Insights

  • Market dynamics for plant-based meat alternatives are increasingly shaped by the convergence of consumer wellness goals and corporate sustainability objectives. The transition toward flexitarian dietary shifts is no longer a niche trend but a core driver, influencing product development across premium burger sub-segments and gourmet burger sub-segments.
  • For manufacturers, this has led to a focus on vegan burger formulations that offer tangible benefits. For example, firms leveraging advanced alternative protein solutions have reported a 15% improvement in consumer repeat-purchase rates.
  • Moreover, the strategic alignment with environmental sustainability targets is yielding measurable results; adoption of sustainable protein sources has enabled some food service providers to reduce their menu-related carbon footprint by up to 25%.
  • This shift toward plant-based protein portfolio diversification is critical for capturing the modern consumer, who demands both sensory satisfaction and transparent, ethical production from their food service offerings.

We can help! Our analysts can customize this plant-based burger patties market research report to meet your requirements.

Get in touch

1. Executive Summary

1.1 Market overview

Executive Summary - Chart on Market Overview
Executive Summary - Data Table on Market Overview
Executive Summary - Chart on Global Market Characteristics
Executive Summary - Chart on Market by Geography
Executive Summary - Chart on Market Segmentation by Distribution Channel
Executive Summary - Chart on Market Segmentation by Product
Executive Summary - Chart on Market Segmentation by Type
Executive Summary - Chart on Incremental Growth
Executive Summary - Data Table on Incremental Growth
Executive Summary - Chart on Company Market Positioning

2. Technavio Analysis

2.1 Analysis of price sensitivity, lifecycle, customer purchase basket, adoption rates, and purchase criteria

2.2 Criticality of inputs and Factors of differentiation

Chart on Overview on criticality of inputs and factors of differentiation

2.3 Factors of disruption

Chart on Overview on factors of disruption

2.4 Impact of drivers and challenges

Chart on Impact of drivers and challenges in 2025 and 2030

3. Market Landscape

3.1 Market ecosystem

Chart on Parent Market
Data Table on - Parent Market

3.2 Market characteristics

Chart on Market characteristics analysis

3.3 Value chain analysis

Chart on Value chain analysis

4. Market Sizing

4.1 Market definition

Data Table on Offerings of companies included in the market definition

4.2 Market segment analysis

Market segments

4.3 Market size 2025

4.4 Market outlook: Forecast for 2025-2030

Chart on Global - Market size and forecast 2025-2030 ($ million)
Data Table on Global - Market size and forecast 2025-2030 ($ million)
Chart on Global Market: Year-over-year growth 2025-2030 (%)
Data Table on Global Market: Year-over-year growth 2025-2030 (%)

5. Historic Market Size

5.1 Global Plant-Based Burger Patties Market 2020 - 2024

Historic Market Size - Data Table on Global Plant-Based Burger Patties Market 2020 - 2024 ($ million)

5.2 Distribution Channel segment analysis 2020 - 2024

Historic Market Size - Distribution Channel Segment 2020 - 2024 ($ million)

5.3 Product segment analysis 2020 - 2024

Historic Market Size - Product Segment 2020 - 2024 ($ million)

5.4 Type segment analysis 2020 - 2024

Historic Market Size - Type Segment 2020 - 2024 ($ million)

5.5 Geography segment analysis 2020 - 2024

Historic Market Size - Geography Segment 2020 - 2024 ($ million)

5.6 Country segment analysis 2020 - 2024

Historic Market Size - Country Segment 2020 - 2024 ($ million)

6. Qualitative Analysis

6.1 Impact of AI in global plant-based burger patties market

6.2 Impact of geopolitical conflict for global plant-based burger patties market

7. Five Forces Analysis

7.1 Five forces summary

Five forces analysis - Comparison between 2025 and 2030

7.2 Bargaining power of buyers

Bargaining power of buyers - Impact of key factors 2025 and 2030

7.3 Bargaining power of suppliers

Bargaining power of suppliers - Impact of key factors in 2025 and 2030

7.4 Threat of new entrants

Threat of new entrants - Impact of key factors in 2025 and 2030

7.5 Threat of substitutes

Threat of substitutes - Impact of key factors in 2025 and 2030

7.6 Threat of rivalry

Threat of rivalry - Impact of key factors in 2025 and 2030

7.7 Market condition

Chart on Market condition - Five forces 2025 and 2030

8. Market Segmentation by Distribution Channel

8.1 Market segments

Chart on Distribution Channel - Market share 2025-2030 (%)
Data Table on Distribution Channel - Market share 2025-2030 (%)

8.2 Comparison by Distribution Channel

Chart on Comparison by Distribution Channel
Data Table on Comparison by Distribution Channel

8.3 Offline - Market size and forecast 2025-2030

Chart on Offline - Market size and forecast 2025-2030 ($ million)
Data Table on Offline - Market size and forecast 2025-2030 ($ million)
Chart on Offline - Year-over-year growth 2025-2030 (%)
Data Table on Offline - Year-over-year growth 2025-2030 (%)

8.4 Online - Market size and forecast 2025-2030

Chart on Online - Market size and forecast 2025-2030 ($ million)
Data Table on Online - Market size and forecast 2025-2030 ($ million)
Chart on Online - Year-over-year growth 2025-2030 (%)
Data Table on Online - Year-over-year growth 2025-2030 (%)

8.5 Market opportunity by Distribution Channel

Market opportunity by Distribution Channel ($ million)
Data Table on Market opportunity by Distribution Channel ($ million)

9. Market Segmentation by Product

9.1 Market segments

Chart on Product - Market share 2025-2030 (%)
Data Table on Product - Market share 2025-2030 (%)

9.2 Comparison by Product

Chart on Comparison by Product
Data Table on Comparison by Product

9.3 Soy-based - Market size and forecast 2025-2030

Chart on Soy-based - Market size and forecast 2025-2030 ($ million)
Data Table on Soy-based - Market size and forecast 2025-2030 ($ million)
Chart on Soy-based - Year-over-year growth 2025-2030 (%)
Data Table on Soy-based - Year-over-year growth 2025-2030 (%)

9.4 Pea protein-based - Market size and forecast 2025-2030

Chart on Pea protein-based - Market size and forecast 2025-2030 ($ million)
Data Table on Pea protein-based - Market size and forecast 2025-2030 ($ million)
Chart on Pea protein-based - Year-over-year growth 2025-2030 (%)
Data Table on Pea protein-based - Year-over-year growth 2025-2030 (%)

9.5 Wheat protein-based - Market size and forecast 2025-2030

Chart on Wheat protein-based - Market size and forecast 2025-2030 ($ million)
Data Table on Wheat protein-based - Market size and forecast 2025-2030 ($ million)
Chart on Wheat protein-based - Year-over-year growth 2025-2030 (%)
Data Table on Wheat protein-based - Year-over-year growth 2025-2030 (%)

9.6 Others - Market size and forecast 2025-2030

Chart on Others - Market size and forecast 2025-2030 ($ million)
Data Table on Others - Market size and forecast 2025-2030 ($ million)
Chart on Others - Year-over-year growth 2025-2030 (%)
Data Table on Others - Year-over-year growth 2025-2030 (%)

9.7 Market opportunity by Product

Market opportunity by Product ($ million)
Data Table on Market opportunity by Product ($ million)

10. Market Segmentation by Type

10.1 Market segments

Chart on Type - Market share 2025-2030 (%)
Data Table on Type - Market share 2025-2030 (%)

10.2 Comparison by Type

Chart on Comparison by Type
Data Table on Comparison by Type

10.3 Conventional - Market size and forecast 2025-2030

Chart on Conventional - Market size and forecast 2025-2030 ($ million)
Data Table on Conventional - Market size and forecast 2025-2030 ($ million)
Chart on Conventional - Year-over-year growth 2025-2030 (%)
Data Table on Conventional - Year-over-year growth 2025-2030 (%)

10.4 Organic - Market size and forecast 2025-2030

Chart on Organic - Market size and forecast 2025-2030 ($ million)
Data Table on Organic - Market size and forecast 2025-2030 ($ million)
Chart on Organic - Year-over-year growth 2025-2030 (%)
Data Table on Organic - Year-over-year growth 2025-2030 (%)

10.5 Market opportunity by Type

Market opportunity by Type ($ million)
Data Table on Market opportunity by Type ($ million)

11. Customer Landscape

11.1 Customer landscape overview

Analysis of price sensitivity, lifecycle, customer purchase basket, adoption rates, and purchase criteria

12. Geographic Landscape

12.1 Geographic segmentation

Chart on Market share by geography 2025-2030 (%)
Data Table on Market share by geography 2025-2030 (%)

12.2 Geographic comparison

Chart on Geographic comparison
Data Table on Geographic comparison

12.3 North America - Market size and forecast 2025-2030

Chart on North America - Market size and forecast 2025-2030 ($ million)
Data Table on North America - Market size and forecast 2025-2030 ($ million)
Chart on North America - Year-over-year growth 2025-2030 (%)
Data Table on North America - Year-over-year growth 2025-2030 (%)
Chart on Regional Comparison - North America
Data Table on Regional Comparison - North America

12.3.1 US - Market size and forecast 2025-2030

Chart on US - Market size and forecast 2025-2030 ($ million)
Data Table on US - Market size and forecast 2025-2030 ($ million)
Chart on US - Year-over-year growth 2025-2030 (%)
Data Table on US - Year-over-year growth 2025-2030 (%)

12.3.2 Canada - Market size and forecast 2025-2030

Chart on Canada - Market size and forecast 2025-2030 ($ million)
Data Table on Canada - Market size and forecast 2025-2030 ($ million)
Chart on Canada - Year-over-year growth 2025-2030 (%)
Data Table on Canada - Year-over-year growth 2025-2030 (%)

12.3.3 Mexico - Market size and forecast 2025-2030

Chart on Mexico - Market size and forecast 2025-2030 ($ million)
Data Table on Mexico - Market size and forecast 2025-2030 ($ million)
Chart on Mexico - Year-over-year growth 2025-2030 (%)
Data Table on Mexico - Year-over-year growth 2025-2030 (%)

12.4 Europe - Market size and forecast 2025-2030

Chart on Europe - Market size and forecast 2025-2030 ($ million)
Data Table on Europe - Market size and forecast 2025-2030 ($ million)
Chart on Europe - Year-over-year growth 2025-2030 (%)
Data Table on Europe - Year-over-year growth 2025-2030 (%)
Chart on Regional Comparison - Europe
Data Table on Regional Comparison - Europe

12.4.1 Germany - Market size and forecast 2025-2030

Chart on Germany - Market size and forecast 2025-2030 ($ million)
Data Table on Germany - Market size and forecast 2025-2030 ($ million)
Chart on Germany - Year-over-year growth 2025-2030 (%)
Data Table on Germany - Year-over-year growth 2025-2030 (%)

12.4.2 UK - Market size and forecast 2025-2030

Chart on UK - Market size and forecast 2025-2030 ($ million)
Data Table on UK - Market size and forecast 2025-2030 ($ million)
Chart on UK - Year-over-year growth 2025-2030 (%)
Data Table on UK - Year-over-year growth 2025-2030 (%)

12.4.3 France - Market size and forecast 2025-2030

Chart on France - Market size and forecast 2025-2030 ($ million)
Data Table on France - Market size and forecast 2025-2030 ($ million)
Chart on France - Year-over-year growth 2025-2030 (%)
Data Table on France - Year-over-year growth 2025-2030 (%)

12.4.4 Italy - Market size and forecast 2025-2030

Chart on Italy - Market size and forecast 2025-2030 ($ million)
Data Table on Italy - Market size and forecast 2025-2030 ($ million)
Chart on Italy - Year-over-year growth 2025-2030 (%)
Data Table on Italy - Year-over-year growth 2025-2030 (%)

12.4.5 The Netherlands - Market size and forecast 2025-2030

Chart on The Netherlands - Market size and forecast 2025-2030 ($ million)
Data Table on The Netherlands - Market size and forecast 2025-2030 ($ million)
Chart on The Netherlands - Year-over-year growth 2025-2030 (%)
Data Table on The Netherlands - Year-over-year growth 2025-2030 (%)

12.4.6 Spain - Market size and forecast 2025-2030

Chart on Spain - Market size and forecast 2025-2030 ($ million)
Data Table on Spain - Market size and forecast 2025-2030 ($ million)
Chart on Spain - Year-over-year growth 2025-2030 (%)
Data Table on Spain - Year-over-year growth 2025-2030 (%)

12.5 APAC - Market size and forecast 2025-2030

Chart on APAC - Market size and forecast 2025-2030 ($ million)
Data Table on APAC - Market size and forecast 2025-2030 ($ million)
Chart on APAC - Year-over-year growth 2025-2030 (%)
Data Table on APAC - Year-over-year growth 2025-2030 (%)
Chart on Regional Comparison - APAC
Data Table on Regional Comparison - APAC

12.5.1 China - Market size and forecast 2025-2030

Chart on China - Market size and forecast 2025-2030 ($ million)
Data Table on China - Market size and forecast 2025-2030 ($ million)
Chart on China - Year-over-year growth 2025-2030 (%)
Data Table on China - Year-over-year growth 2025-2030 (%)

12.5.2 Japan - Market size and forecast 2025-2030

Chart on Japan - Market size and forecast 2025-2030 ($ million)
Data Table on Japan - Market size and forecast 2025-2030 ($ million)
Chart on Japan - Year-over-year growth 2025-2030 (%)
Data Table on Japan - Year-over-year growth 2025-2030 (%)

12.5.3 India - Market size and forecast 2025-2030

Chart on India - Market size and forecast 2025-2030 ($ million)
Data Table on India - Market size and forecast 2025-2030 ($ million)
Chart on India - Year-over-year growth 2025-2030 (%)
Data Table on India - Year-over-year growth 2025-2030 (%)

12.5.4 South Korea - Market size and forecast 2025-2030

Chart on South Korea - Market size and forecast 2025-2030 ($ million)
Data Table on South Korea - Market size and forecast 2025-2030 ($ million)
Chart on South Korea - Year-over-year growth 2025-2030 (%)
Data Table on South Korea - Year-over-year growth 2025-2030 (%)

12.5.5 Australia - Market size and forecast 2025-2030

Chart on Australia - Market size and forecast 2025-2030 ($ million)
Data Table on Australia - Market size and forecast 2025-2030 ($ million)
Chart on Australia - Year-over-year growth 2025-2030 (%)
Data Table on Australia - Year-over-year growth 2025-2030 (%)

12.5.6 Indonesia - Market size and forecast 2025-2030

Chart on Indonesia - Market size and forecast 2025-2030 ($ million)
Data Table on Indonesia - Market size and forecast 2025-2030 ($ million)
Chart on Indonesia - Year-over-year growth 2025-2030 (%)
Data Table on Indonesia - Year-over-year growth 2025-2030 (%)

12.6 South America - Market size and forecast 2025-2030

Chart on South America - Market size and forecast 2025-2030 ($ million)
Data Table on South America - Market size and forecast 2025-2030 ($ million)
Chart on South America - Year-over-year growth 2025-2030 (%)
Data Table on South America - Year-over-year growth 2025-2030 (%)
Chart on Regional Comparison - South America
Data Table on Regional Comparison - South America

12.6.1 Brazil - Market size and forecast 2025-2030

Chart on Brazil - Market size and forecast 2025-2030 ($ million)
Data Table on Brazil - Market size and forecast 2025-2030 ($ million)
Chart on Brazil - Year-over-year growth 2025-2030 (%)
Data Table on Brazil - Year-over-year growth 2025-2030 (%)

12.6.2 Argentina - Market size and forecast 2025-2030

Chart on Argentina - Market size and forecast 2025-2030 ($ million)
Data Table on Argentina - Market size and forecast 2025-2030 ($ million)
Chart on Argentina - Year-over-year growth 2025-2030 (%)
Data Table on Argentina - Year-over-year growth 2025-2030 (%)

12.6.3 Colombia - Market size and forecast 2025-2030

Chart on Colombia - Market size and forecast 2025-2030 ($ million)
Data Table on Colombia - Market size and forecast 2025-2030 ($ million)
Chart on Colombia - Year-over-year growth 2025-2030 (%)
Data Table on Colombia - Year-over-year growth 2025-2030 (%)

12.7 Middle East and Africa - Market size and forecast 2025-2030

Chart on Middle East and Africa - Market size and forecast 2025-2030 ($ million)
Data Table on Middle East and Africa - Market size and forecast 2025-2030 ($ million)
Chart on Middle East and Africa - Year-over-year growth 2025-2030 (%)
Data Table on Middle East and Africa - Year-over-year growth 2025-2030 (%)
Chart on Regional Comparison - Middle East and Africa
Data Table on Regional Comparison - Middle East and Africa

12.7.1 UAE - Market size and forecast 2025-2030

Chart on UAE - Market size and forecast 2025-2030 ($ million)
Data Table on UAE - Market size and forecast 2025-2030 ($ million)
Chart on UAE - Year-over-year growth 2025-2030 (%)
Data Table on UAE - Year-over-year growth 2025-2030 (%)

12.7.2 Saudi Arabia - Market size and forecast 2025-2030

Chart on Saudi Arabia - Market size and forecast 2025-2030 ($ million)
Data Table on Saudi Arabia - Market size and forecast 2025-2030 ($ million)
Chart on Saudi Arabia - Year-over-year growth 2025-2030 (%)
Data Table on Saudi Arabia - Year-over-year growth 2025-2030 (%)

12.7.3 South Africa - Market size and forecast 2025-2030

Chart on South Africa - Market size and forecast 2025-2030 ($ million)
Data Table on South Africa - Market size and forecast 2025-2030 ($ million)
Chart on South Africa - Year-over-year growth 2025-2030 (%)
Data Table on South Africa - Year-over-year growth 2025-2030 (%)

12.7.4 Israel - Market size and forecast 2025-2030

Chart on Israel - Market size and forecast 2025-2030 ($ million)
Data Table on Israel - Market size and forecast 2025-2030 ($ million)
Chart on Israel - Year-over-year growth 2025-2030 (%)
Data Table on Israel - Year-over-year growth 2025-2030 (%)

12.7.5 Turkey - Market size and forecast 2025-2030

Chart on Turkey - Market size and forecast 2025-2030 ($ million)
Data Table on Turkey - Market size and forecast 2025-2030 ($ million)
Chart on Turkey - Year-over-year growth 2025-2030 (%)
Data Table on Turkey - Year-over-year growth 2025-2030 (%)

12.8 Market opportunity by geography

Market opportunity by geography ($ million)
Data Tables on Market opportunity by geography ($ million)

13. Drivers, Challenges, and Opportunity

13.1 Market drivers

Strategic mainstreaming of flexitarianism and health-conscious dietary shifts
Technological advancements in texture replication and sensory mimicry
Industrialization of environmental sustainability and corporate climate mandates

13.2 Market challenges

Persistence of pricing disparity and economic barrier to mass-market adoption
Technical debt of sensory parity and risk of repeat-purchase fatigue
Intensification of labeling restrictions and burden of regulatory harmonization

13.3 Impact of drivers and challenges

Impact of drivers and challenges in 2025 and 2030

13.4 Market opportunities

Growth of diversified protein sources and legume-forward formulations
Expansion of hybridization and value-tier product accessibility
Integration of clean label certification and nutritional transparency

14. Competitive Landscape

14.1 Overview

14.2

Overview on criticality of inputs and factors of differentiation

14.3 Landscape disruption

Overview on factors of disruption

14.4 Industry risks

Impact of key risks on business

15. Competitive Analysis

15.1 Companies profiled

Companies covered

15.2 Company ranking index

15.3 Market positioning of companies

Matrix on companies position and classification

15.4 Alpha Foods

Alpha Foods - Overview
Alpha Foods - Product / Service
Alpha Foods - Key offerings
SWOT

15.5 Atlantic Natural Foods LLC

Atlantic Natural Foods LLC - Overview
Atlantic Natural Foods LLC - Product / Service
Atlantic Natural Foods LLC - Key offerings
SWOT

15.6 Beyond Meat Inc.

Beyond Meat Inc. - Overview
Beyond Meat Inc. - Product / Service
Beyond Meat Inc. - Key offerings
SWOT

15.7 Conagra Brands Inc.

Conagra Brands Inc. - Overview
Conagra Brands Inc. - Business segments
Conagra Brands Inc. - Key offerings
Conagra Brands Inc. - Segment focus
SWOT

15.8 Hungry Planet Inc.

Hungry Planet Inc. - Overview
Hungry Planet Inc. - Product / Service
Hungry Planet Inc. - Key offerings
SWOT

15.9 Impossible Foods Inc.

Impossible Foods Inc. - Overview
Impossible Foods Inc. - Product / Service
Impossible Foods Inc. - Key offerings
SWOT

15.10 Kellanova

Kellanova - Overview
Kellanova - Business segments
Kellanova - Key offerings
Kellanova - Segment focus
SWOT

15.11 Life Health Foods

Life Health Foods - Overview
Life Health Foods - Product / Service
Life Health Foods - Key offerings
SWOT

15.12 Maple Leaf Foods Inc.

Maple Leaf Foods Inc. - Overview
Maple Leaf Foods Inc. - Business segments
Maple Leaf Foods Inc. - Key offerings
Maple Leaf Foods Inc. - Segment focus
SWOT

15.13 Nestle SA

Nestle SA - Overview
Nestle SA - Business segments
Nestle SA - Key news
Nestle SA - Key offerings
Nestle SA - Segment focus
SWOT

15.14 Quorn Foods

Quorn Foods - Overview
Quorn Foods - Product / Service
Quorn Foods - Key offerings
SWOT

15.15 The Kraft Heinz Co.

The Kraft Heinz Co. - Overview
The Kraft Heinz Co. - Business segments
The Kraft Heinz Co. - Key news
The Kraft Heinz Co. - Key offerings
The Kraft Heinz Co. - Segment focus
SWOT

15.16 Turtle Island Foods, Inc.

Turtle Island Foods, Inc. - Overview
Turtle Island Foods, Inc. - Product / Service
Turtle Island Foods, Inc. - Key offerings
SWOT

15.17 Unilever PLC

Unilever PLC - Overview
Unilever PLC - Business segments
Unilever PLC - Key news
Unilever PLC - Key offerings
Unilever PLC - Segment focus
SWOT

15.18 v2 Food Pty Ltd.

v2 Food Pty Ltd. - Overview
v2 Food Pty Ltd. - Product / Service
v2 Food Pty Ltd. - Key offerings
SWOT

16. Appendix

16.1 Scope of the report

Market definition
Objectives
Notes and caveats

16.2 Inclusions and exclusions checklist

Inclusions checklist
Exclusions checklist

16.3 Currency conversion rates for US$

16.4 Research methodology

16.5 Data procurement

Information sources

16.6 Data validation

16.7 Validation techniques employed for market sizing

16.8 Data synthesis

16.9 360 degree market analysis

16.10 List of abbreviations

Research Methodology

Technavio presents a detailed picture of the market by way of study, synthesis, and summation of data from multiple sources. The analysts have presented the various facets of the market with a particular focus on identifying the key industry influencers. The data thus presented is comprehensive, reliable, and the result of extensive research, both primary and secondary.

INFORMATION SOURCES

Primary sources

  • Manufacturers and suppliers
  • Channel partners
  • Industry experts
  • Strategic decision makers

Secondary sources

  • Industry journals and periodicals
  • Government data
  • Financial reports of key industry players
  • Historical data
  • Press releases

DATA ANALYSIS

Data Synthesis

  • Collation of data
  • Estimation of key figures
  • Analysis of derived insights

Data Validation

  • Triangulation with data models
  • Reference against proprietary databases
  • Corroboration with industry experts

REPORT WRITING

Qualitative

  • Market drivers
  • Market challenges
  • Market trends
  • Five forces analysis

Quantitative

  • Market size and forecast
  • Market segmentation
  • Geographical insights
  • Competitive landscape

Interested in this report?

Get your sample now to see our research methodology and insights!

Download Now

Frequently Asked Questions

Plant-based Burger Patties market growth will increase by USD 8338.1 million during 2026-2030.

The Plant-based Burger Patties market is expected to grow at a CAGR of 17.4% during 2026-2030.

Plant-based Burger Patties market is segmented by Distribution channel (Offline, Online) Product (Soy-based, Pea protein-based, Wheat protein-based, Others) Type (Conventional, Organic)

Alpha Foods, Amys Kitchen Inc., Atlantic Natural Foods LLC, Beyond Meat Inc., Conagra Brands Inc., Dr. Praegers Sensible Foods Inc., Don Lee Farms, Heura Foods, Hungry Planet Inc., Impossible Foods Inc., Kellanova, Life Health Foods, Maple Leaf Foods Inc., Nestle SA, Quorn Foods, The Kraft Heinz Co., Turtle Island Foods, Inc., Unilever PLC, v2 Food Pty Ltd., Yves Veggie Cuisine are a few of the key vendors in the Plant-based Burger Patties market.

North America will register the highest growth rate of 37.1% among the other regions. Therefore, the Plant-based Burger Patties market in North America is expected to garner significant business opportunities for the vendors during the forecast period.

US, Canada, Mexico, Germany, UK, France, Italy, The Netherlands, Spain, China, Japan, India, South Korea, Australia, Indonesia, Brazil, Argentina, Colombia, UAE, Saudi Arabia, South Africa, Israel, Turkey

  • Strategic mainstreaming of flexitarianism and health-conscious dietary shifts is the driving factor this market.

The Plant-based Burger Patties market vendors should focus on grabbing business opportunities from the Distribution channel segment as it accounted for the largest market share in the base year.
RIA - Research AI Assistant
Ask RIA