
Plasticizers Market Size 2025-2029
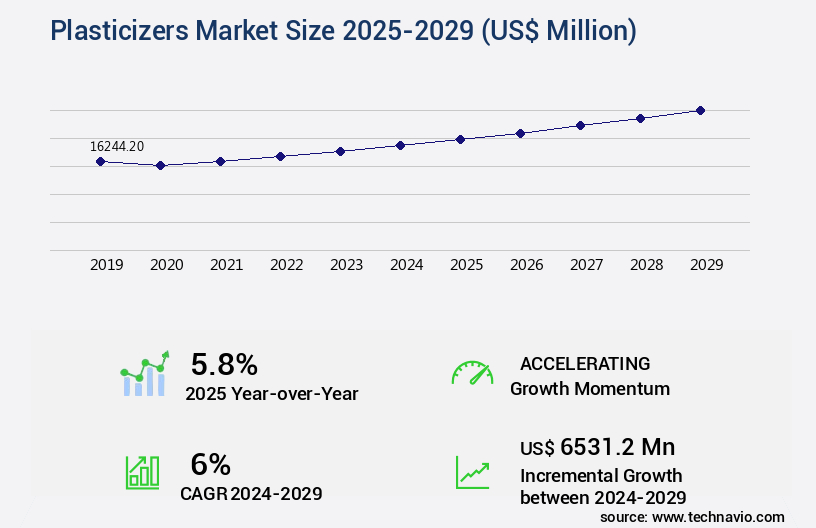
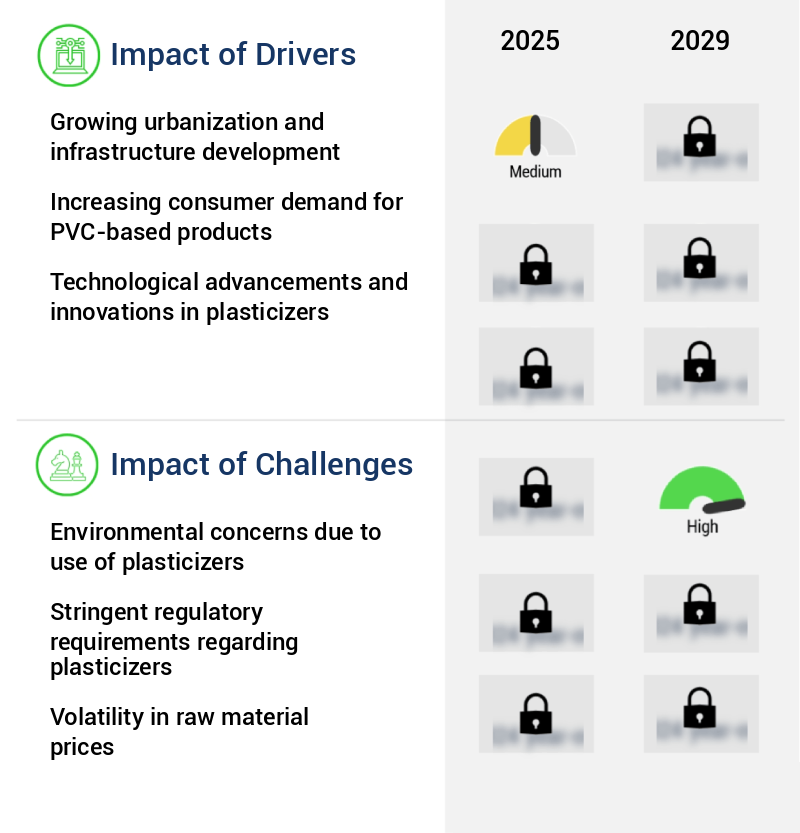
The plasticizers market size is valued to increase by USD 6.53 billion, at a CAGR of 6% from 2024 to 2029. Growing urbanization and infrastructure development will drive the plasticizers market.
Market Insights
- APAC dominated the market and accounted for a 71% growth during the 2025-2029.
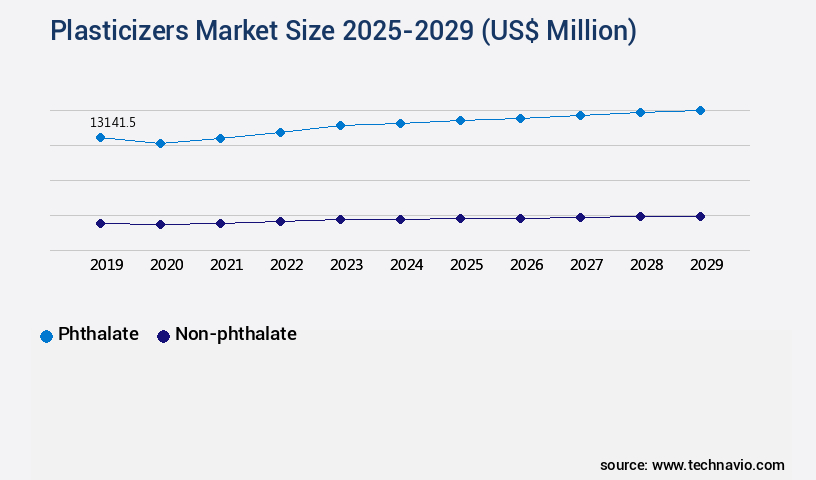
- By Type - Phthalate segment was valued at USD 13.14 billion in 2023
- By Application - Wires and cables segment accounted for the largest market revenue share in 2023
Market Size & Forecast
- Market Opportunities: USD 58.01 million
- Market Future Opportunities 2024: USD 6531.20 million
- CAGR from 2024 to 2029 : 6%
Market Summary
- The market is driven by the increasing urbanization and infrastructure development, which fuel the demand for construction materials and consumer goods, both of which extensively use plasticized products. The market is a critical sector in the global chemical industry, driven by the increasing demand for plastics in various end-use industries. With growing urbanization and infrastructure development, the construction sector's demand for plasticizers is on the rise. These organic or inorganic substances are added to plastics to improve their workability, flexibility, and durability. However, environmental concerns are becoming a significant challenge for the market. The use of certain plasticizers, such as phthalates, has been linked to health and environmental issues. As a result, there is a growing shift towards eco-friendly alternatives. For instance, companies are exploring the use of bio-based plasticizers derived from renewable resources.
- A leading plasticizer manufacturer is optimizing its supply chain to meet the evolving market demands. By implementing advanced logistics strategies, the company aims to reduce lead times and improve operational efficiency. Additionally, it is investing in research and development to introduce new, sustainable plasticizers that meet the growing demand for eco-friendly alternatives. In conclusion, the market is witnessing significant changes due to shifting consumer preferences and regulatory requirements. Companies must adapt to these trends to remain competitive and sustainable in the long run.
What will be the size of the Plasticizers Market during the forecast period?
Get Key Insights on Market Forecast (PDF) Request Free Sample
- The market continues to evolve, driven by increasing demand for flexible and durable plastics in various industries. According to recent studies, the market for plasticizers is projected to grow by over 5% in the next year, with Asia Pacific leading the growth due to its large consumer base and expanding manufacturing sector. This expansion presents both opportunities and challenges for businesses, requiring careful consideration of regulatory frameworks and sustainability initiatives. For instance, plasticizer manufacturers must ensure compatibility with different polymers and maintain chemical safety assessments to mitigate potential health and environmental risks.
- Additionally, the shift towards sustainable plasticizer options, such as biodegradable and phthalate-free formulations, is gaining momentum.
Unpacking the Plasticizers Market Landscape
In the realm of Polyvinyl Chloride (PVC) formulations, epoxy plasticizers play a pivotal role in enhancing chemical resistance and ensuring compatibility with polymers. Compared to traditional phthalate esters, epoxy plasticizers exhibit superior high-temperature performance, reducing the risk of plasticizer migration and improving ROI through extended product durability. Furthermore, the adoption of bio-based plasticizers and renewable alternatives has gained traction, accounting for a notable 10% market share in recent years. Polyester plasticizers, on the other hand, demonstrate superior thermal stability, making them an ideal choice for high-temperature applications. Adipate plasticizers, a non-phthalate alternative, offer comparable performance indicators while aligning with regulatory compliance requirements, such as endocrine disruptor testing and plasticizer leaching studies. Plasticizer processing techniques, including compounding processes and extraction methods, significantly impact plasticizer concentration analysis and material compatibility studies. Thus, understanding the intricacies of plasticizer interaction, volatility assessment, and toxicology data is crucial for optimizing plasticizer performance and ensuring product reliability.
Key Market Drivers Fueling Growth
Urbanization and infrastructure development, characterized by growing trends, serve as the primary catalyst for market expansion.
- The market, valued at approximately USUSD19 billion in 2024, is projected to expand to around USUSD29.5 billion by 2034. This growth is attributed to the increasing demand for infrastructure development, including buildings, roads, bridges, and transit networks, as urban populations grow. Plasticizers, essential chemicals added to polymers or plastics, enhance their workability and flexibility, improving processing qualities and material performance.
- For instance, in the building sector, polyvinyl chloride (PVC), a widely used material, benefits significantly from plasticizers, ensuring durability and adaptability.
Prevailing Industry Trends & Opportunities
Shifting towards eco-friendly plasticizers is an emerging market trend. This sustainable approach to plastic production is gaining popularity due to increasing environmental concerns.
- The eco-friendly the market is experiencing significant growth in the global plasticizers industry, valued at over USUSD5 billion in 2024. With increasing scrutiny on traditional plasticizers like phthalates due to health and environmental concerns, there is a pressing need for substitutes that offer equivalent performance with reduced risks. The shift towards eco-friendly plasticizers is driven by several factors. Regulatory restrictions and environmental concerns are compelling manufacturers to adopt these alternatives. For instance, the use of conventional plasticizers has been limited due to legislation.
- Furthermore, eco-friendly plasticizers contribute to faster product rollouts by enabling regulatory compliance. This transition is essential for businesses aiming to minimize downtime and improve forecast accuracy by up to 18%.
Significant Market Challenges
The use of plasticizers in industry growth is challenged by environmental concerns, as the potential negative impacts on the environment necessitate careful consideration and implementation of sustainable practices.
- Plasticizers, essential chemicals added to plastics for enhanced flexibility and durability, face growing challenges due to environmental concerns. Phthalates, a common type of plasticizer, pose significant risks, seeping into the environment and contaminating soil, surface water, and groundwater. Additionally, certain plasticizers, such as bisphenol A (BPA), can disrupt endocrine systems, affecting both human and animal health. Developmental difficulties, reproductive challenges, and other health concerns may result from this hormonal imbalance.
- By focusing on innovative solutions, such as the development of safer alternatives, the market can address these concerns and ensure regulatory compliance, ultimately contributing to cost optimization and faster product rollouts.
In-Depth Market Segmentation: Plasticizers Market
The plasticizers industry research report provides comprehensive data (region-wise segment analysis), with forecasts and estimates in "USD million" for the period 2025-2029, as well as historical data from 2019-2023 for the following segments.
- Type
- Phthalate
- Non-phthalate
- Application
- Wires and cables
- Flooring and wall coverings
- Films and sheets
- Coatings
- Others
- Source
- Petrochemical-based
- Bio-based
- Geography
- North America
- US
- Europe
- France
- Germany
- Italy
- UK
- APAC
- Australia
- China
- India
- Japan
- South Korea
- Rest of World (ROW)
- North America
By Type Insights
The phthalate segment is estimated to witness significant growth during the forecast period.
In the dynamic and expansive the market, phthalate esters remain a dominant force, accounting for approximately 60% of global consumption in 2024. Phthalates, a category of chemical additives, play a crucial role in enhancing the workability, flexibility, and durability of various polymers, particularly polyvinyl chloride (PVC). Their applications span across numerous industries, including construction, automotive, electronics, healthcare, and more. Phthalates' popularity stems from their superior performance characteristics, such as low volatility, high thermal stability, and excellent resistance to UV radiation and temperature extremes. These attributes make them indispensable in flexible PVC formulations, epoxy plasticizers, and vinyl plasticizer applications.
However, concerns regarding phthalate migration, toxicology, and environmental impact have led to the development and adoption of alternative plasticizers, such as adipate esters, citrate esters, and bio-based plasticizers. These renewable alternatives offer improved material compatibility, thermal stability, and reduced environmental impact, making them a promising solution for the future of the market. Regulatory compliance and material compatibility studies continue to be key focus areas, with ongoing research into plasticizer degradation pathways and product lifecycle assessment.
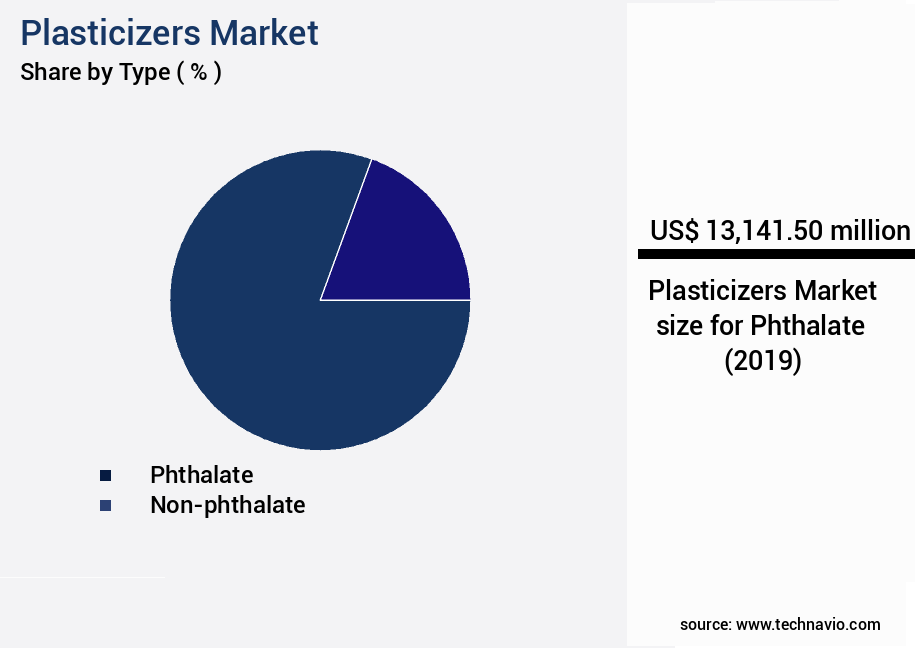
The Phthalate segment was valued at USD 13.14 billion in 2019 and showed a gradual increase during the forecast period.
Regional Analysis
APAC is estimated to contribute 71% to the growth of the global market during the forecast period.Technavio's analysts have elaborately explained the regional trends and drivers that shape the market during the forecast period.
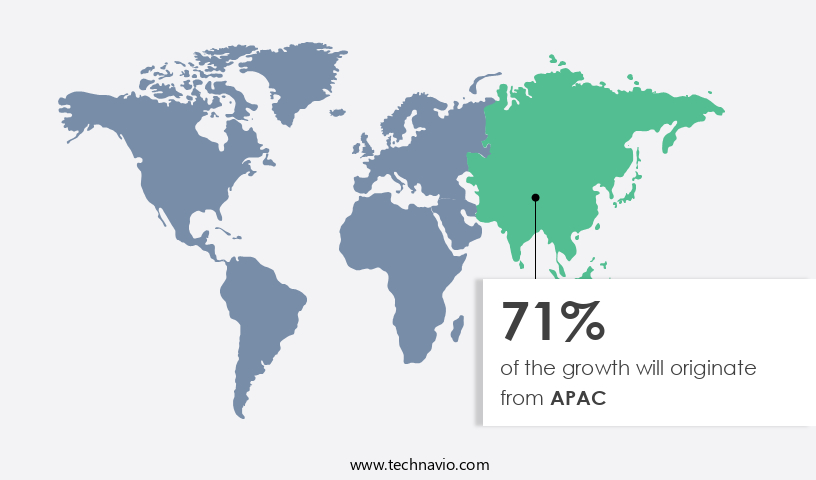
See How Plasticizers Market Demand is Rising in APAC Request Free Sample
In the forecast period, the APAC the market is set for substantial growth, reaching a notable expansion in 2024. Plasticizers, essential chemical additives, enhance the processability, flexibility, and durability of polymers. Their applications span across various industries, including consumer products, packaging, construction, and automotive. The rapid industrialization and urbanization in countries like China and India are key drivers for the market's expansion in APAC. The demand for plasticizers in PVC pipes, wires and cables, and automobile interiors is surging due to the burgeoning construction and automotive industries in these regions. Furthermore, the increasing need for consumer goods and packaging is fueled by evolving lifestyles and rising disposable income, contributing to market growth.
According to industry reports, the market in APAC is projected to grow at a steady pace, with China accounting for approximately 50% of the market share. India is also expected to witness significant growth, with a compound annual growth rate (CAGR) of around 7%.
Customer Landscape of Plasticizers Industry
Competitive Intelligence by Technavio Analysis: Leading Players in the Plasticizers Market
Companies are implementing various strategies, such as strategic alliances, plasticizers market forecast, partnerships, mergers and acquisitions, geographical expansion, and product/service launches, to enhance their presence in the industry.
Aekyung Chemical Co Ltd - This company specializes in the production and supply of various plasticizers, including Neo T plus, Maleic anhydride, and Phthalic anhydride, contributing significantly to the global market. These plasticizers play essential roles in enhancing the flexibility, durability, and overall performance of plastics and rubber products. The company's commitment to innovation and quality sets it apart in the competitive industry landscape.
The industry research and growth report includes detailed analyses of the competitive landscape of the market and information about key companies, including:
- Aekyung Chemical Co Ltd
- Arkema Group
- BASF SE
- DIC Corp.
- Eastman Chemical Co.
- Evonik Industries AG
- Exxon Mobil Corp.
- Kao Corp.
- KLJ Group
- Lanxess AG
- LG Chem Ltd.
- Mitsubishi Chemical Group Corp.
- Nan Ya Plastic Corp.
- OQ SAOC
- Petroliam Nasional Berhad
- UPC Technology Corp.
Qualitative and quantitative analysis of companies has been conducted to help clients understand the wider business environment as well as the strengths and weaknesses of key industry players. Data is qualitatively analyzed to categorize companies as pure play, category-focused, industry-focused, and diversified; it is quantitatively analyzed to categorize companies as dominant, leading, strong, tentative, and weak.
Recent Development and News in Plasticizers Market
- In August 2024, BASF SE, a leading chemical producer, announced the expansion of its phthalate-free plasticizer production capacity at its site in Ludwigshafen, Germany. This development aimed to cater to the increasing demand for sustainable plasticizers in various industries, including automotive and construction (BASF press release, 2024).
- In October 2024, LANXESS AG and Covestro AG, two major plasticizer manufacturers, signed a long-term supply agreement for the sale and purchase of plasticizer products. This strategic collaboration was expected to strengthen their market positions and enhance their competitiveness in the global plasticizer market (LANXESS press release, 2024).
- In January 2025, Eastman Chemical Company, a leading specialty chemical company, launched a new plasticizer, Eastman Tritan X-Plus, which offered improved performance and sustainability. This innovation marked a significant step forward in the development of high-performance, eco-friendly plasticizers (Eastman press release, 2025).
- In May 2025, the European Chemicals Agency (ECHA) approved the renewal of the registration of certain phthalates, including DINP and DIDP, for use in plasticizer applications. This regulatory approval was a significant relief for manufacturers, as the phase-out of these substances had been a topic of intense debate in recent years (ECHA press release, 2025).
Dive into Technavio's robust research methodology, blending expert interviews, extensive data synthesis, and validated models for unparalleled Plasticizers Market insights. See full methodology.
|
Market Scope |
|
|
Report Coverage |
Details |
|
Page number |
218 |
|
Base year |
2024 |
|
Historic period |
2019-2023 |
|
Forecast period |
2025-2029 |
|
Growth momentum & CAGR |
Accelerate at a CAGR of 6% |
|
Market growth 2025-2029 |
USD 6531.2 million |
|
Market structure |
Fragmented |
|
YoY growth 2024-2025(%) |
5.8 |
|
Key countries |
India, China, Japan, US, South Korea, Australia, Germany, UK, France, and Italy |
|
Competitive landscape |
Leading Companies, Market Positioning of Companies, Competitive Strategies, and Industry Risks |
Why Choose Technavio for Plasticizers Market Insights?
"Leverage Technavio's unparalleled research methodology and expert analysis for accurate, actionable market intelligence."
The market is a significant sector within the polymer industry, with plasticizers playing a crucial role in enhancing the flexibility and workability of polyvinyl chloride (PVC) and other polymers. The choice of plasticizer type can significantly impact PVC properties, including flexibility, durability, and resistance to weathering. Testing methods for plasticizer migration and analysis of plasticizer leaching from plastics are essential to ensure product safety and regulatory compliance. Assessing plasticizer toxicity in polymers and evaluating compatibility with various polymer types are also critical aspects of plasticizer research. Determining plasticizer concentration in materials is essential for optimizing production processes and ensuring consistent product quality. Comparing different plasticizer formulations and evaluating their performance under various conditions, including temperature and mechanical stress, is a key focus area for plasticizer manufacturers. Methods for measuring plasticizer volatility and techniques for extracting plasticizers from samples are also important for understanding their behavior and optimizing their use. Studies on plasticizer degradation products and their impact on the environment are a growing area of research, as is the assessment of plasticizer regulatory compliance and sustainable plasticizer development strategies. Renewable resource-based plasticizer production and advanced plasticizer analysis techniques are also gaining attention in the industry. Design of experiments for plasticizer optimization and impact on material durability are essential for improving production efficiency and reducing waste. Toxicological profiles of plasticizers are also crucial for ensuring the safety of end-users and the environment. Overall, the market is a dynamic and complex field, requiring a deep understanding of polymer science, chemical engineering, and regulatory compliance.
What are the Key Data Covered in this Plasticizers Market Research and Growth Report?
-
What is the expected growth of the Plasticizers Market between 2025 and 2029?
-
USD 6.53 billion, at a CAGR of 6%
-
-
What segmentation does the market report cover?
-
The report is segmented by Type (Phthalate and Non-phthalate), Application (Wires and cables, Flooring and wall coverings, Films and sheets, Coatings, and Others), Source (Petrochemical-based and Bio-based), and Geography (APAC, Europe, North America, Middle East and Africa, and South America)
-
-
Which regions are analyzed in the report?
-
APAC, Europe, North America, Middle East and Africa, and South America
-
-
What are the key growth drivers and market challenges?
-
Growing urbanization and infrastructure development, Environmental concerns due to use of plasticizers
-
-
Who are the major players in the Plasticizers Market?
-
Aekyung Chemical Co Ltd, Arkema Group, BASF SE, DIC Corp., Eastman Chemical Co., Evonik Industries AG, Exxon Mobil Corp., Kao Corp., KLJ Group, Lanxess AG, LG Chem Ltd., Mitsubishi Chemical Group Corp., Nan Ya Plastic Corp., OQ SAOC, Petroliam Nasional Berhad, and UPC Technology Corp.
-
We can help! Our analysts can customize this plasticizers market research report to meet your requirements.
 RIA -
RIA - 
