
Plywood Market Size 2025-2029
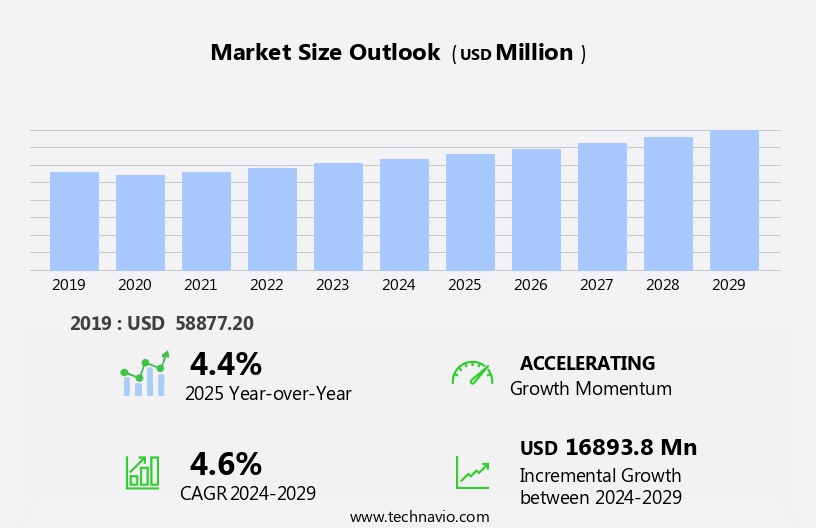
The plywood market size is forecast to increase by USD 16.89 billion at a CAGR of 4.6% between 2024 and 2029.
- The market is experiencing growth, driven primarily by the wave of residential and commercial construction activities in various regions. This trend is underpinned by an uptick in infrastructure development and urbanization, particularly in emerging economies. However, this growth is not without challenges. One significant issue is the rising wages in key manufacturing hubs, which is increasing production costs for plywood manufacturers. Another challenge is the persistent concerns over moisture and humidity, which can negatively impact the quality and durability of plywood products.
- To capitalize on the market opportunities and navigate these challenges effectively, companies must focus on implementing cost-effective manufacturing strategies and investing in research and development to address moisture and humidity concerns, particularly in the production of wooden furniture. Moisture control is critical to maintaining product quality, durability, and customer satisfaction in wooden furniture manufacturing. By staying abreast of these market dynamics and adapting to the evolving landscape, including changing consumer preferences, environmental factors, and material innovations, businesses can position themselves for long-term success in the market.
What will be the Size of the Plywood Market during the forecast period?
- The market in the United States continues to experience strong growth, driven by increasing demand for efficient manufacturing processes, fire-rated plywood, and engineered wood solutions such as cross-laminated timber (CLT). Customer preferences for high-quality plywood varieties, including birch, pine, cedar, maple, oak, and bamboo, fuel expansion in the market. LEED certification and green building initiatives further boost demand for moisture-resistant, high-performance plywood and composite panels. Product development in the sector focuses on meeting safety standards and building codes, resulting in innovations like glulam beams and advanced quality control measures.
- Wholesale distribution and online sales channels have expanded, catering to a diverse target audience in the construction industry. MDF and composite panels also contribute to the market's sizeable revenue, with retail sales remaining a significant segment. Overall, the market is poised for continued growth, driven by design innovation, supply chain optimization, and the increasing popularity of modular construction.
How is this Plywood Industry segmented?
The plywood industry research report provides comprehensive data (region-wise segment analysis), with forecasts and estimates in "USD million" for the period 2025-2029, as well as historical data from 2019-2023 for the following segments.
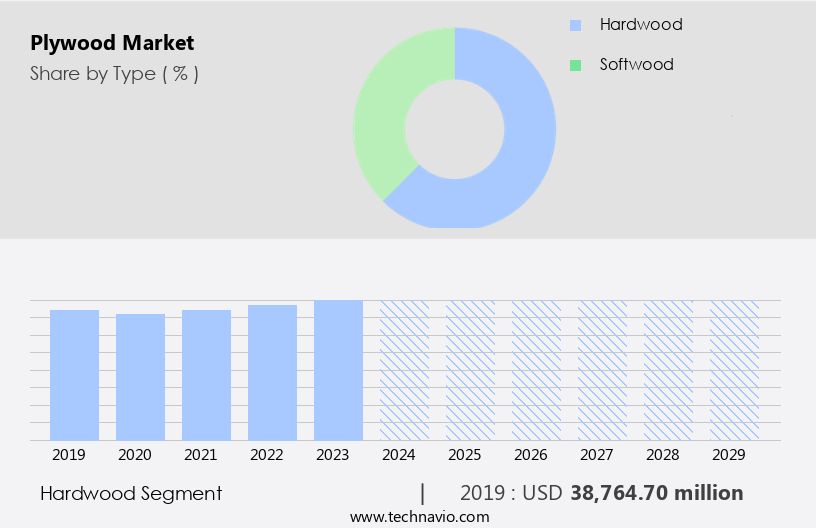
- Type
- Hardwood
- Softwood
- Sector
- New construction
- Replacement
- End-user
- Residential
- Commercial
- Geography
- APAC
- Australia
- China
- India
- Japan
- South Korea
- North America
- US
- Canada
- Europe
- France
- Germany
- UK
- Middle East and Africa
- South America
- APAC
By Type Insights
The hardwood segment is estimated to witness significant growth during the forecast period. Plywood, a versatile wood product, is essential in various industries, including commercial construction and furniture manufacturing. In plywood manufacturing, a Plywood Mill produces sheets through a process of gluing veneers of different wood types, resulting in high-strength and stability. The plywood supply chain ensures the availability of various types, such as underlayment, structural, exterior, and sanded plywood, catering to diverse applications. Plywood thickness, pricing, and certifications, like fire retardant and moisture resistance, significantly impact the market. Architects and interior designers utilize plywood for wall cladding, furniture, and interior design due to its adaptability in CNC machining, laser cutting, and plywood fabrication.
Industrial construction relies on plywood panels for sheathing and insulation. Sustainability is a growing trend, with a focus on sustainable forestry, recycling, and reducing carbon footprint. Formaldehyde emissions and levels are crucial considerations for plywood production and finishing. Plywood repair and installation are essential aspects of the market, ensuring durability and longevity. Plywood is used extensively in residential and industrial construction, with applications ranging from sheathing and wall cladding to marine and furniture manufacturing. The market's demand is influenced by factors like plywood's moisture resistance, fire resistance, and formality levels. Plywood trends include water-resistant, fire retardant, and formaldehyde-free options.
Plywood is a vital component in various industries, offering strength, versatility, and sustainability. Its production, distribution, and application continue to evolve, driven by market dynamics, environmental concerns, and technological advancements.
Get a glance at the market report of share of various segments Request Free Sample
The Hardwood segment was valued at USD 38.76 billion in 2019 and showed a gradual increase during the forecast period.
Regional Analysis
APAC is estimated to contribute 64% to the growth of the global market during the forecast period.Technavio's analysts have elaborately explained the regional trends and drivers that shape the market during the forecast period.

For more insights on the market size of various regions, Request Free Sample
The market in Asia Pacific is projected to expand due to urbanization and rising disposable incomes in emerging economies. Notable initiatives like the Smart Cities Mission, Swachh Bharat Mission, Sardar Patel National Urban Housing Mission, Atal Mission for Rejuvenation and Urban Transformation, and Heritage City Development and Augmentation Yojana in India are driving demand. China, a significant producer and exporter of wood products, prioritizes export-driven industrial production and high foreign investments. Plywood manufacturing caters to various industries, including commercial construction, industrial construction, furniture manufacturing, and residential construction. Plywood comes in various thicknesses, pricing structures, and certifications, such as underlayment plywood, sanded plywood, sheathing plywood, structural plywood, exterior plywood, and fire retardant plywood.
Plywood is used for wall cladding, architectural design, interior design, and plywood finishing. Plywood panels undergo laser cutting, CNC machining, and plywood cutting for customization. Moisture resistance and water-resistant plywood are essential for marine applications. Plywood recycling and sustainability are essential considerations, with a focus on sustainable forestry and forest management. Plywood production involves glued veneer, formaldehyde emissions, and fire resistance. Formaldehyde levels are regulated to ensure health and safety. Plywood repair and maintenance are crucial for longevity. Plywood's environmental impact and carbon footprint are essential concerns for the industry. In summary, the market in Asia Pacific is poised for growth due to urbanization, rising disposable incomes, and government initiatives.
Plywood caters to various industries and applications, with a focus on sustainability, health and safety, and customization.
Market Dynamics
Our researchers analyzed the data with 2024 as the base year, along with the key drivers, trends, and challenges. A holistic analysis of drivers will help companies refine their marketing strategies to gain a competitive advantage.
What are the key market drivers leading to the rise in the adoption of Plywood Industry?
- Increasing residential and commercial construction activities is the key driver of the market. In developed economies, including the US, substantial investments in infrastructural development are underway. Meanwhile, in emerging economies like India, the potential for 100% foreign direct investment (FDI) in townships and settlement projects is projected to boost plywood demand. Government initiatives such as the Smart Cities Mission, Pradhan Mantri Awas Yojana (PMAY), and the Sardar Patel National Urban Housing Mission are estimated to increase urban population growth, driving market expansion.
- The emphasis on infrastructure and real estate development, along with the construction of new residences and offices, is anticipated to increase sales of new plywood products and furnishings. Overall, these factors are expected to significantly contribute to the growth of the market during the forecast period.
What are the market trends shaping the Plywood Industry?
- Rising wages in manufacturing hubs is the upcoming market trend. The market is experiencing a significant shift due to rising wages in manufacturing hubs worldwide, particularly in China and India. This trend is weakening the labor cost advantage in these regions, posing a challenge for global companies with production facilities there.
- The primary drivers of these rising wages are the rapid urbanization and industrialization in emerging economies, notably China, India, the Philippines, Vietnam, and Indonesia. The expanding economies of these countries, as indicated by their increasing GDP, fuel wage growth.
What challenges does the Plywood Industry face during its growth?
- Moisture and humidity concerns of plywood is a key challenge affecting the industry growth. Plywood is a popular choice for flooring applications due to its durability and affordability. However, proper installation and maintenance are crucial to ensure the longevity of the product. Manufacturers provide guidelines for installing plywood flooring based on ambient relative humidity levels, typically ranging from 35%-55%. These guidelines can vary among manufacturers, with some suggesting 40%-60% and others 30%-50%. Failure to adhere to these ranges can result in damage to the plywood.
- For instance, installing engineered wooden flooring with a relative humidity of 40% in an environment with an average relative humidity of 30% may cause damage unless the user is able to control the relative humidity. Relative humidity can also vary from one room to another, making consistent monitoring essential. As a skilled assistant, I stress the importance of following these guidelines to preserve the integrity of your plywood flooring investment.
Exclusive Customer Landscape
The plywood market forecasting report includes the adoption lifecycle of the market, covering from the innovator's stage to the laggard's stage. It focuses on adoption rates in different regions based on penetration. Furthermore, the plywood market report also includes key purchase criteria and drivers of price sensitivity to help companies evaluate and develop their market growth analysis strategies.
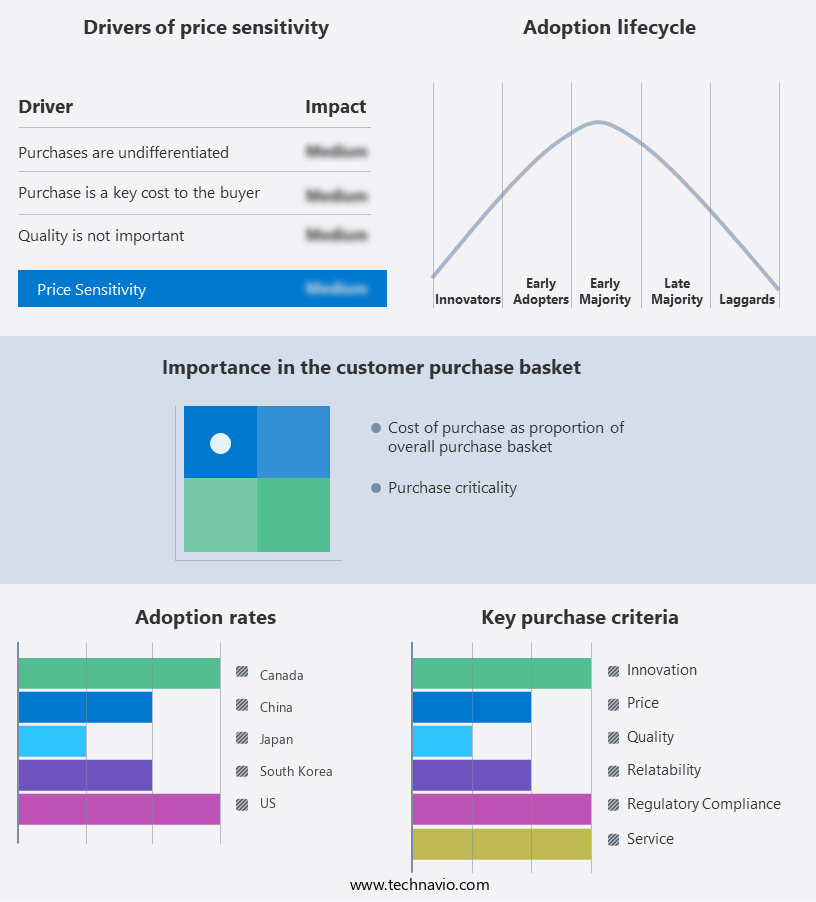
Customer Landscape
Key Companies & Market Insights
Companies are implementing various strategies, such as strategic alliances, plywood market forecast, partnerships, mergers and acquisitions, geographical expansion, and product/service launches, to enhance their presence in the industry.
Boise Cascade Co - The company offers plywood such as Boise Cascade plywood which are designed specifically for residential and other light frame applications.
The industry research and growth report includes detailed analyses of the competitive landscape of the market and information about key companies, including:
- Boise Cascade Co
- Century Plyboards India Ltd.
- Columbia Forest Products Inc.
- Duroply Industries Ltd.
- Evergreen Plywood Industries Pvt Ltd
- Ganahl Lumber Co.
- Greenply Industries Ltd.
- Kitply Industries Ltd
- Koch Industries Inc.
- Kronospan
- METSA GROUP
- MJB Wood Group LLC
- PotlatchDeltic Corp.
- Roseburg Forest Products Co.
- Subur Tiasa Holdings Berhad
- SVEZA
- Swanson Group
- Tolko Industries Ltd.
- UPM Kymmene Corp.
- Weyerhaeuser Co.
Qualitative and quantitative analysis of companies has been conducted to help clients understand the wider business environment as well as the strengths and weaknesses of key industry players. Data is qualitatively analyzed to categorize companies as pure play, category-focused, industry-focused, and diversified; it is quantitatively analyzed to categorize companies as dominant, leading, strong, tentative, and weak.
Research Analyst Overview
Plywood is a versatile and widely used building material, known for its strength, durability, and affordability. The market is a significant contributor to the construction industry, with applications ranging from commercial and industrial projects to residential homes and furniture manufacturing. Plywood manufacturing involves the production of sheets of wood veneer glued together with their grain directions alternating at right angles. This process results in a strong and stable material, making it an ideal choice for various applications. The plywood supply chain encompasses raw material sourcing, manufacturing, finishing, distribution, and installation. Plywood thickness and pricing are essential factors in the market.
Thinner plywood sheets are commonly used for underlayment and wall cladding, while thicker sheets are used for structural applications such as flooring and roofing. Pricing is influenced by various factors, including production costs, demand, and competition. Plywood certifications play a crucial role in ensuring product quality and sustainability. These certifications verify that the plywood meets specific standards for environmental impact, formaldehyde emissions, and other regulations. Exterior plywood, for instance, may require certifications for moisture resistance and fire resistance. Plywood trends include the use of advanced manufacturing technologies such as laser cutting and CNC machining for increased precision and efficiency. Sustainability is also a growing concern, with a focus on sustainable forestry, formaldehyde emissions, and carbon footprint reduction.
The demand for plywood is driven by the construction industry's continuous growth, where it plays a vital role among core construction materials. Commercial and industrial projects require large quantities of structural plywood for flooring, wall cladding, roofing, and even for fabricating windows and doors due to its strength and adaptability. Residential construction also contributes significantly to the market, with plywood used for sheathing, flooring, and furniture manufacturing. Plywood recycling is an essential aspect of the industry's sustainability efforts, involving the reuse of waste materials from plywood production and the repurposing of old plywood for new applications. Its versatility extends across industries, including architectural design, where sanded plywood is favored for its smooth finish, and sheathing plywood is valued for its structural integrity.
The market's future looks promising, driven by ongoing research and development in glued veneer, water-resistant plywood, and fire-retardant plywood. These innovations aim to enhance product performance, reduce environmental impact, and meet evolving industry demands. As a dynamic and evolving industry, plywood continues to be a preferred, affordable, and sustainable solution for a wide range of construction and design applications, including the production of high-quality windows and doors. The industry's focus on sustainability, innovation, and efficiency will remain central to its future growth.
|
Market Scope |
|
|
Report Coverage |
Details |
|
Page number |
209 |
|
Base year |
2024 |
|
Historic period |
2019-2023 |
|
Forecast period |
2025-2029 |
|
Growth momentum & CAGR |
Accelerate at a CAGR of 4.6% |
|
Market growth 2025-2029 |
USD 16.89 Billion |
|
Market structure |
Fragmented |
|
YoY growth 2024-2025(%) |
4.4 |
|
Key countries |
China, US, India, Japan, South Korea, Germany, Australia, Canada, UK, and France |
|
Competitive landscape |
Leading Companies, Market Positioning of Companies, Competitive Strategies, and Industry Risks |
What are the Key Data Covered in this Plywood Market Research and Growth Report?
- CAGR of the Plywood industry during the forecast period
- Detailed information on factors that will drive the growth and forecasting between 2025 and 2029
- Precise estimation of the size of the market and its contribution of the industry in focus to the parent market
- Accurate predictions about upcoming growth and trends and changes in consumer behaviour
- Growth of the market across APAC, North America, Europe, Middle East and Africa, and South America
- Thorough analysis of the market's competitive landscape and detailed information about companies
- Comprehensive analysis of factors that will challenge the plywood market growth and forecasting
We can help! Our analysts can customize this plywood market research report to meet your requirements.
 RIA -
RIA - 
