Polyacrylamide Market Size 2025-2029
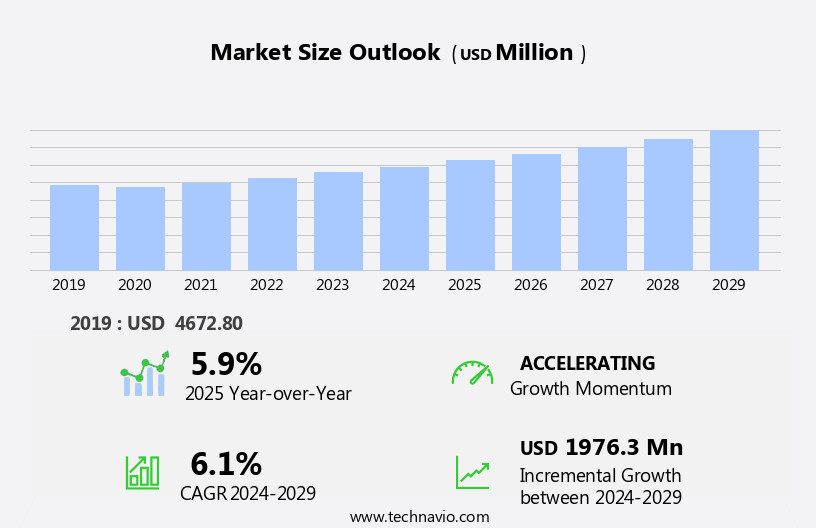
The polyacrylamide market size is forecast to increase by USD 1.98 billion at a CAGR of 6.1% between 2024 and 2029.
- The market is experiencing significant growth, driven primarily by the increasing demand for water treatment applications. This trend is being fueled by stringent regulations aimed at improving water quality and ensuring public health and safety. Another key trend shaping the market is the shift toward bio-based and eco-friendly polyacrylamide, as there is growing awareness and concern for the environment. However, market growth is not without challenges. Fluctuating raw material prices pose a significant threat to market stability and profitability. Producers must navigate these price fluctuations to maintain competitiveness and ensure long-term sustainability.
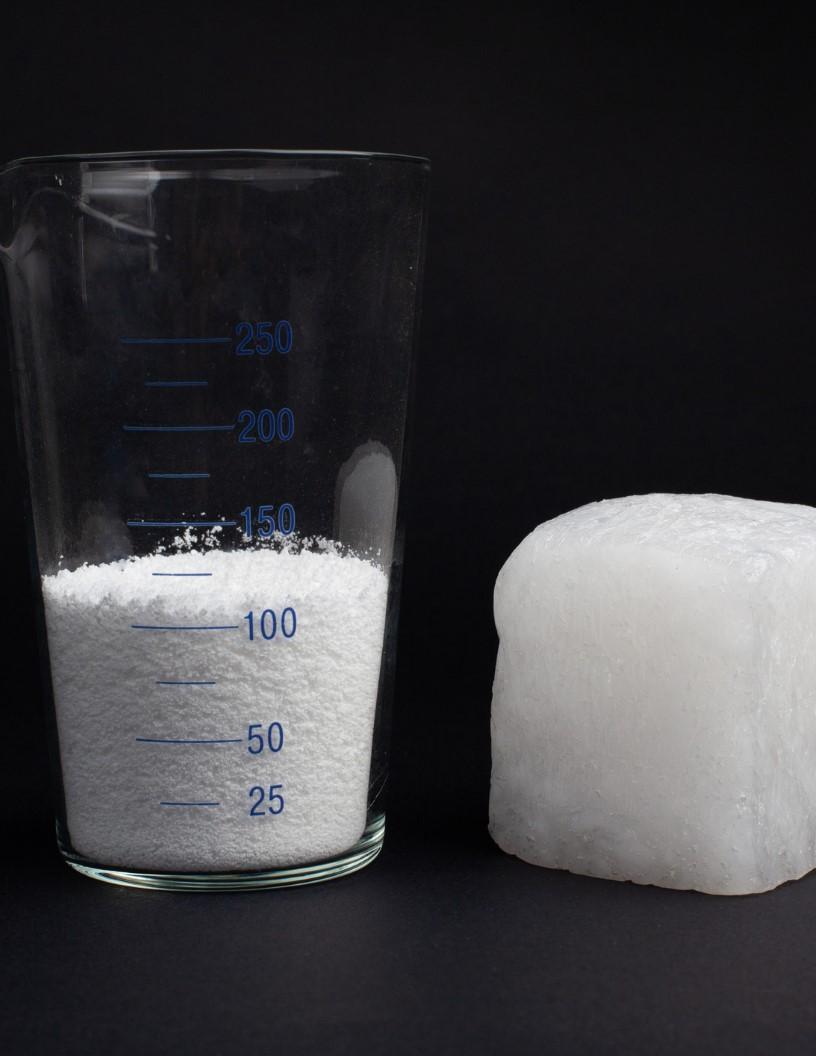
- Superabsorbent polymers, derived from PAM, are used in various industries, including agriculture, construction, and Personal Care, for their water-absorbing properties. Companies seeking to capitalize on market opportunities and navigate challenges effectively should focus on innovation, cost management, and strategic partnerships. By staying abreast of market trends and adapting to changing market conditions, they can position themselves for long-term success in the dynamic market.
What will be the Size of the Polyacrylamide Market during the forecast period?
- The market encompasses a wide range of applications, including sedimentation rate control, mineral recovery, and water quality improvement, all of which are increasingly reliant on advanced polymer technologies. Polyacrylamide membranes play a critical role in industries such as paper mill effluent treatment and drilling mud applications, offering efficient separation and purification capabilities. In the energy sector, polyacrylamide is widely used for well stimulation and hydraulic fracturing processes, while polyacrylamide adhesives support sludge reduction initiatives. Effective handling and recycling methods ensure the sustainable use of these materials, reducing environmental impact.
- In agriculture, polyacrylamide derivatives are valued for erosion control and drought tolerance, contributing to soil health and water conservation. Additionally, polyacrylamide coatings and their biocompatibility properties find diverse applications across multiple industries, enhancing durability and safety. The integration of polymer blends and nanomaterials continues to expand the potential of polyacrylamide in areas such as soil amendment, storage, and wastewater reuse. Essential properties like water retention and clarification contribute to filtration efficiency and crop yield enhancement, making polyacrylamide indispensable in modern polymer chemistry.
- Emerging market trends include innovations in polymer synthesis methods and the expanding use of polyacrylamide across sectors such as water treatment, agriculture, energy, and coatings. The incorporation of coatings raw materials and methyl methacrylate adhesives further broadens the application spectrum, offering improved performance in demanding industrial environments. The evolving market dynamics underscore the importance of polyacrylamide's multifaceted properties and applications to fully leverage the opportunities it presents.
How is this Polyacrylamide Industry segmented?
The polyacrylamide industry research report provides comprehensive data (region-wise segment analysis), with forecasts and estimates in "USD million" for the period 2025-2029, as well as historical data from 2019-2023 for the following segments.
- Product Type
- Anionic
- Cationic
- Non-ionic
- Application
- Water treatment
- Petroleum industry
- Papermaking
- Others
- Geography
- North America
- US
- Canada
- Europe
- France
- Germany
- Russia
- UK
- Middle East and Africa
- APAC
- China
- India
- Japan
- South Korea
- South America
- Rest of World (ROW)
- North America
By Product Type Insights
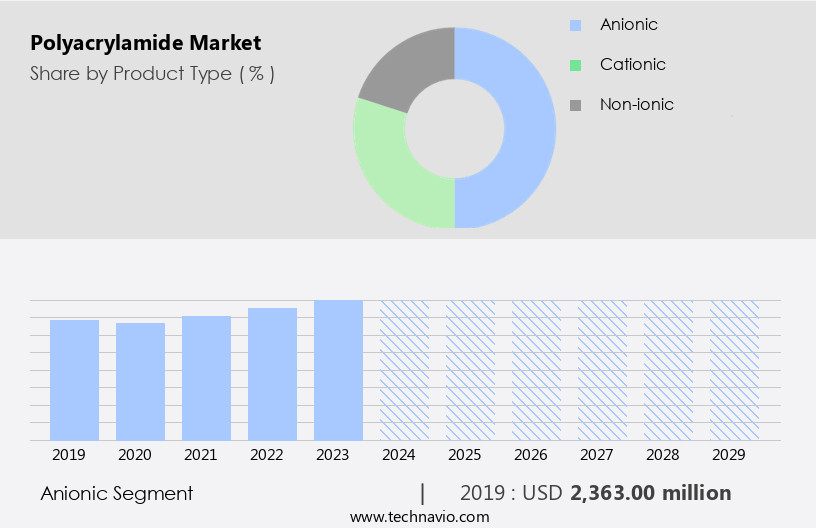
The anionic segment is estimated to witness significant growth during the forecast period. Anionic polyacrylamide (APAM), a negatively charged polymer, plays a crucial role in various industries due to its ability to bind with positively charged particles. In the chemical sector, APAM is particularly valuable in wastewater treatment, where it coagulates and flocculates contaminants, making it an indispensable component in the purification processes of municipal sewage treatment facilities. APAM's applications extend beyond wastewater treatment, reaching industries such as coal washing, mineral processing, metallurgy, and iron and steel, where it ensures efficient wastewater management. APAM's molecular weight and solids content can be tailored to meet specific industrial requirements. For instance, in mineral processing, high molecular weight APAM is used to enhance the separation process of minerals from waste materials.
In contrast, low molecular weight APAM is employed in water treatment to improve the solids suspension and enhance the performance of coagulants and flocculants. Moreover, APAM is available in various forms, including non-ionic, amphoteric, cationic, and biodegradable, catering to diverse industrial needs. For instance, non-ionic polyacrylamide is used in oil recovery, while cationic polyacrylamide is employed in the paper and textile industries. Biodegradable polyacrylamide is gaining popularity due to its eco-friendly nature, making it a sustainable choice for industries striving for greener practices. APAM's versatility and effectiveness have positioned it as a valuable performance enhancer in various polymer solutions.
Its applications range from soil stabilization to sludge dewatering, making it an essential ingredient in numerous industrial processes. The ongoing research and development in the polyacrylamide industry continue to unveil new applications and improvements, further cementing APAM's role as a vital industrial component.
Get a glance at the market report of share of various segments Request Free Sample
The Anionic segment was valued at USD 2.36 billion in 2019 and showed a gradual increase during the forecast period.
Regional Analysis
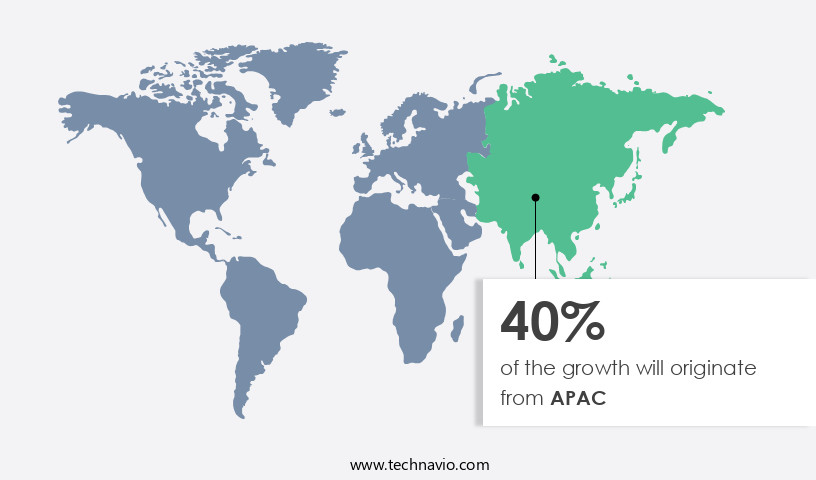
APAC is estimated to contribute 40% to the growth of the global market during the forecast period. Technavio's analysts have elaborately explained the regional trends and drivers that shape the market during the forecast period.
For more insights on the market size of various regions, Request Free Sample
The Asia-Pacific region plays a pivotal role in the market, with substantial investments and diverse applications driving its growth. Notably, the water treatment industry is a significant contributor, particularly in China, where the government plans to invest USD 50 billion in wastewater treatment for industries such as textiles, printing, steel production, oil and gas extraction, Coal Mining, and pharmaceuticals. Polyacrylamide, a flocculant and coagulant, is widely used in wastewater treatment processes due to its ability to effectively remove contaminants. This demand is driven by stringent environmental regulations set by the Chinese government. Additionally, applications in the papermaking, agriculture, and mining sectors further expand the market's reach.
Within the polyacrylamide industry, various forms such as non-ionic, amphoteric, anionic, cationic, and biodegradable are utilized based on specific application requirements. Polymer solutions, performance enhancers, and crosslinked polyacrylamide are other essential components of the market. The market's evolution reflects the increasing importance of sustainable practices, with a focus on eco-friendly and biodegradable polyacrylamide solutions.
Market Dynamics
Our researchers analyzed the data with 2024 as the base year, along with the key drivers, trends, and challenges. A holistic analysis of drivers will help companies refine their marketing strategies to gain a competitive advantage.
What are the key market drivers leading to the rise in the adoption of the Polyacrylamide Industry?
- Rising demand for water treatment is the key driver of the market. The market is driven by the increasing demand for effective water treatment solutions due to the growing pressure on existing water resources. According to the United Nations, over 2 billion people live in countries experiencing high water stress, and approximately 80% of wastewater globally is discharged untreated, leading to significant water pollution. Industrial discharges, agricultural runoff, and municipal waste are major contributors to deteriorating water quality worldwide. The World Health Organization (WHO) projects that by 2025, half of the global population will be living in water-stressed areas.
- With population growth and urbanization, the need for advanced water treatment technologies is becoming increasingly crucial to address these challenges. Polyacrylamide, a high-performance water treatment chemical, plays a vital role in enhancing the efficiency of water treatment processes by improving coagulation and flocculation, thereby reducing water pollution and ensuring water sustainability.
What are the market trends shaping the Polyacrylamide Industry?
- Shift toward bio-based and eco-friendly polyacrylamide is the upcoming market trend. The market is witnessing a significant trend towards the adoption of eco-friendly alternatives. Historically, this polymer has been produced using fossil-derived acrylamide monomers, leading to environmental and health concerns due to potential residual monomer presence. In response to increasing regulatory pressure and consumer demand for sustainable products, manufacturers are actively exploring bio-based alternatives. Bio-based polyacrylamide, derived from renewable feedstocks, is gaining popularity as it offers reduced environmental impact while maintaining high-performance standards.
- A notable development in this area occurred on February 3, 2022, when Kemira Oyj, a leading chemical solutions provider, announced the first full-scale production of bio-based polyacrylamide globally. This shift towards sustainable alternatives is expected to continue shaping the market dynamics.
What challenges does the Polyacrylamide Industry face during its growth?
- Fluctuating raw material prices is a key challenge affecting the industry growth. The market faces challenges due to the volatility in raw material prices, particularly acrylamide and Crude Oil derivatives. These materials significantly impact production costs and profitability for manufacturers. Geopolitical tensions, shifts in global demand, and fluctuations in production levels among major oil-producing nations are primary causes of this instability. In early 2024, Brent crude oil prices saw a substantial increase, reaching a high of USD 91.17 per barrel on April 5, due to Middle Eastern geopolitical tensions.
- However, this price wave was short-lived, and by September 10, prices had dropped to USD68. This volatility in raw material prices poses a significant challenge for the polyacrylamide industry, necessitating close monitoring and adaptability from market participants.
Exclusive Customer Landscape
The polyacrylamide market forecasting report includes the adoption lifecycle of the market, covering from the innovator's stage to the laggard's stage. It focuses on adoption rates in different regions based on penetration. Furthermore, the polyacrylamide market report also includes key purchase criteria and drivers of price sensitivity to help companies evaluate and develop their market growth analysis strategies.

Customer Landscape
Key Companies & Market Insights
Companies are implementing various strategies, such as strategic alliances, polyacrylamide market forecast, partnerships, mergers and acquisitions, geographical expansion, and product/service launches, to enhance their presence in the industry.
Anhui Jucheng Fine Chemical Co. Ltd - The company offers polyacrylamide, such as anionic, cationic, and nonionic polyacrylamide.
The industry research and growth report includes detailed analyses of the competitive landscape of the market and information about key companies, including:
- Anhui Jucheng Fine Chemical Co. Ltd
- Ashland Inc.
- Asiafloc
- BASF SE
- Black Rose Industries Ltd.
- BY ZL GROUP
- China National Petroleum Corp.
- Dongying Kechuang Biochemical Co. Ltd
- Kemira Oyj
- NNA Polymers Inc
- Shandong bomo Biochemical Co. Ltd.
- SNF Group
- Solenis
- The Dow Chemical Co.
- XITAO POLYMER CO. LTD
Qualitative and quantitative analysis of companies has been conducted to help clients understand the wider business environment as well as the strengths and weaknesses of key industry players. Data is qualitatively analyzed to categorize companies as pure play, category-focused, industry-focused, and diversified; it is quantitatively analyzed to categorize companies as dominant, leading, strong, tentative, and weak.
Research Analyst Overview
Polyacrylamide (PAM), a versatile and high-performing polymer, plays a significant role in various industries due to its unique properties and adaptability. Derived from acrylamide monomers, PAM is extensively used in the production of drilling fluids and polymer solutions for crude oil and natural gas exploration. The market spans numerous applications, including mineral processing, water treatment, soil stabilization, and the use of performance enhancers across key sectors. The molecular weight of PAM heavily influences its application; for example, high molecular weight PAM is ideal for suspending solids in drilling operations, while low molecular weight PAM is preferred for coagulation and flocculation in water treatment.
The production of PAM involves controlled polymerization of acrylamide, resulting in various forms such as non-ionic, amphoteric, anionic, cationic, and increasingly, biodegradable PAM. Each form offers specific advantagesâanionic PAM is effective in water treatment, cationic PAM aids in sludge dewatering, and amphoteric PAM finds use in complex processes like enhanced oil recovery and soil stabilization. The rising demand for crosslinked PAM stems from its superior performance and stability, especially in harsh operational environments like mining and energy extraction. As industries increasingly focus on sustainable and eco-friendly practices, the development of biodegradable PAM is gaining momentum, providing a less harmful alternative to traditional formulations. The solids content and dosage rate of PAM are critical factors that directly impact both performance efficiency and cost-effectiveness.
Interestingly, the scope of materials and chemicals intersecting with the PAM market is expanding. Inputs like acrylonitrile serve as essential raw materials in PAM production, while the broader chemical industry, including niche sectors such as coatings raw materials and methyl methacrylate adhesives, also influences market dynamics. Although unrelated directly, quirky consumer trends in unrelated markets, from rum and gin preferences to innovations in bra textiles, reflect the increasingly cross-disciplinary innovation landscape, where polymer science can intersect with apparel, beverage packaging, and beyond. Overall, the PAM market is dynamic and rapidly evolving, driven by diverse applications in oil & gas, water management, agriculture, and beyond. Continued investment in R&D, particularly in biodegradable and high-performance PAM variants, will be crucial in addressing emerging industrial challenges and environmental regulations.
|
Market Scope |
|
|
Report Coverage |
Details |
|
Page number |
211 |
|
Base year |
2024 |
|
Historic period |
2019-2023 |
|
Forecast period |
2025-2029 |
|
Growth momentum & CAGR |
Accelerate at a CAGR of 6.1% |
|
Market growth 2025-2029 |
USD 1.97 Billion |
|
Market structure |
Fragmented |
|
YoY growth 2024-2025(%) |
5.9 |
|
Key countries |
US, China, India, Germany, UK, Japan, France, South Korea, Canada, and Russia |
|
Competitive landscape |
Leading Companies, Market Positioning of Companies, Competitive Strategies, and Industry Risks |
What are the Key Data Covered in this Polyacrylamide Market Research and Growth Report?
- CAGR of the Polyacrylamide industry during the forecast period
- Detailed information on factors that will drive the growth and forecasting between 2025 and 2029
- Precise estimation of the size of the market and its contribution of the industry in focus to the parent market
- Accurate predictions about upcoming growth and trends and changes in consumer behaviour
- Growth of the market across APAC, Europe, North America, Middle East and Africa, and South America
- Thorough analysis of the market's competitive landscape and detailed information about companies
- Comprehensive analysis of factors that will challenge the polyacrylamide market growth and forecasting
We can help! Our analysts can customize this polyacrylamide market research report to meet your requirements.