Post Production Market Analysis, Size, and Forecast 2026-2030: North America (US, Canada, and Mexico), APAC (China, India, and Japan), Europe (UK, Germany, and France), Middle East and Africa (UAE, South Africa, and Saudi Arabia), South America (Brazil and Argentina), and Rest of World (ROW)

Post Production Market Analysis, Size, and Forecast 2026-2030:
North America (US, Canada, and Mexico), APAC (China, India, and Japan), Europe (UK, Germany, and France), Middle East and Africa (UAE, South Africa, and Saudi Arabia), South America (Brazil and Argentina), and Rest of World (ROW)

Published: Mar 2026 306 Pages SKU: IRTNTR41184

Market Overview at a Glance

$18.20 B
Market Opportunity
12.9%
CAGR 2025 - 2030
38.6%
North America Growth
$8.16 B
VFX segment 2024

Post Production Market Size 2026-2030

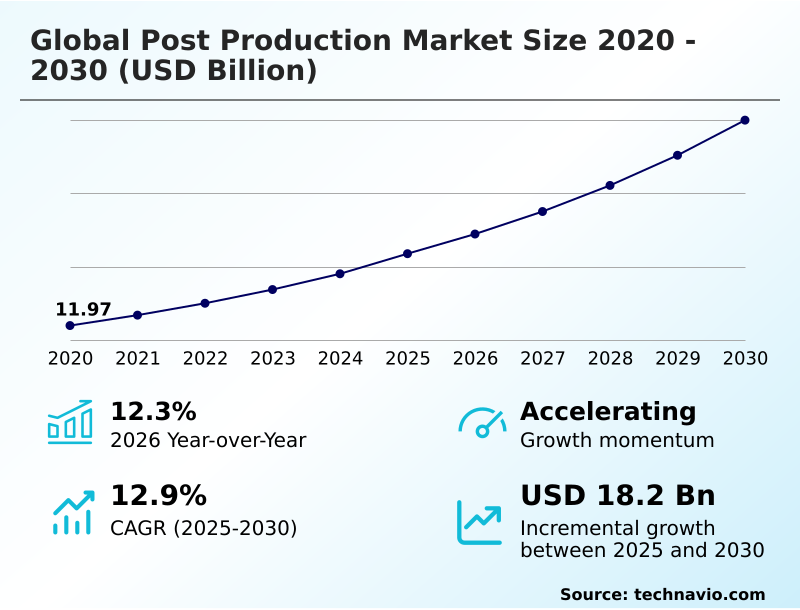
The post production market size is valued to increase by USD 18.20 billion, at a CAGR of 12.9% from 2025 to 2030. Rising consumer expectations for immersive and high-resolution media content will drive the post production market.

Major Market Trends & Insights

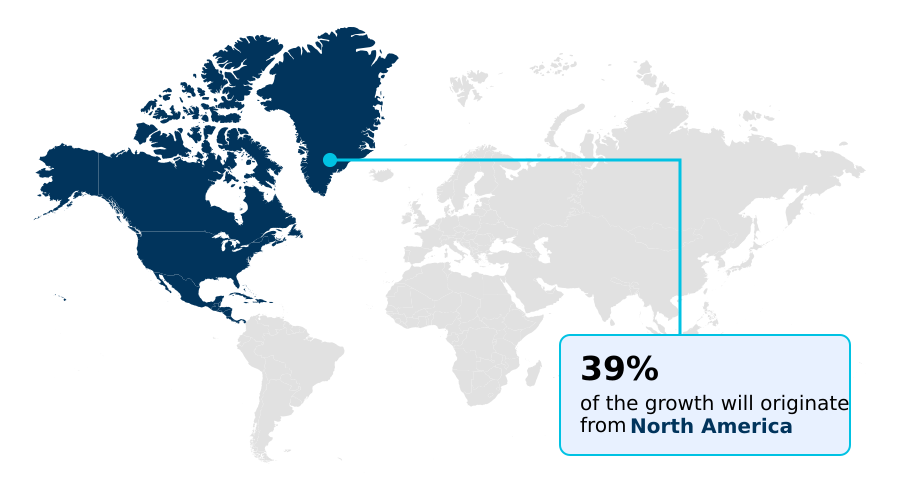
  • North America dominated the market and accounted for a 38.6% growth during the forecast period.
  • By Technique - VFX segment was valued at USD 8.16 billion in 2024
  • By Application - Movies segment accounted for the largest market revenue share in 2024

Market Size & Forecast

  • Market Opportunities: USD 28.01 billion
  • Market Future Opportunities: USD 18.20 billion
  • CAGR from 2025 to 2030 : 12.9%

Market Summary

  • The post production market is undergoing a significant transformation, driven by the convergence of technological innovation and evolving content consumption habits. Key industry shifts include the widespread adoption of cloud-native workflows, which dismantle geographical barriers and enable global collaboration among creative professionals.
  • This decentralized model is critical for managing the massive data loads associated with high dynamic range (HDR) and 8K video formats. Concurrently, the integration of artificial intelligence and machine learning is redefining efficiency.
  • For instance, in a typical visual effects pipeline, AI-powered tools for tasks like rotoscoping and object removal can automate thousands of manual hours, allowing artists to focus on more complex creative challenges. This automation not only accelerates project timelines to meet the demands of streaming platforms but also enhances the final quality.
  • However, this progress introduces challenges related to data security in distributed environments and the substantial capital investment required for high-performance computing infrastructure. The market continues to balance the pursuit of technological advancement with the need for robust, scalable, and secure operational frameworks to support the next generation of media creation.

What will be the Size of the Post Production Market during the forecast period?

Get Key Insights on Market Forecast (PDF) Request Free Sample

How is the Post Production Market Segmented?

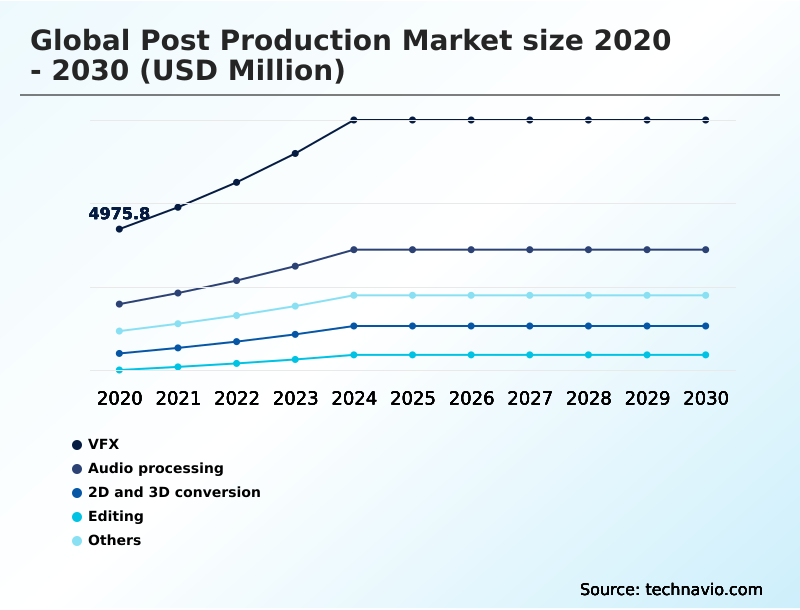
The post production industry research report provides comprehensive data (region-wise segment analysis), with forecasts and estimates in "USD million" for the period 2026-2030, as well as historical data from 2020-2024 for the following segments.

  • Technique
    • VFX
    • Audio processing
    • 2D and 3D conversion
    • Editing
    • Others
  • Application
    • Movies
    • Television
    • Commercials
    • Online videos
  • End-user
    • Production houses
    • Independent filmmakers
    • Television studios
  • Geography
    • North America
      • US
      • Canada
      • Mexico
    • APAC
      • China
      • India
      • Japan
    • Europe
      • UK
      • Germany
      • France
    • Middle East and Africa
      • UAE
      • South Africa
      • Saudi Arabia
    • South America
      • Brazil
      • Argentina
    • Rest of World (ROW)

By Technique Insights

The vfx segment is estimated to witness significant growth during the forecast period.

The global post production market is segmented by technique, application, and geography, with the visual effects (VFX) segment being the most technologically intensive. This area involves integrating computer-generated imagery with live-action footage, a standard for cinematic and streaming content.

The evolution toward virtual production and the use of real-time rendering engines allows directors to visualize digital environments during filming. This shift demands higher technical proficiency from artists using sophisticated software for complex simulations like fluid dynamics and particle systems.

The adoption of machine learning algorithms for tasks such as rotoscoping and match-moving automates labor-intensive processes.

For instance, recent software updates incorporating neural engines have reduced manual frame manipulation tasks by up to 30%, allowing for greater focus on creative aspects like digital character design.

Request Free Sample

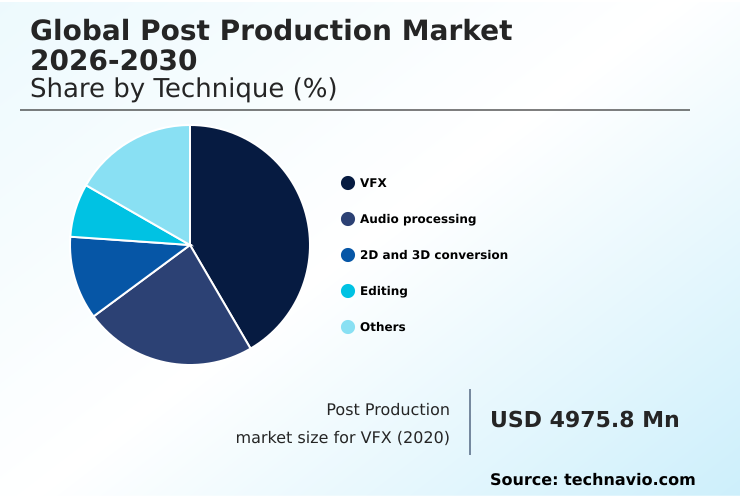
The VFX segment was valued at USD 8.16 billion in 2024 and showed a gradual increase during the forecast period.

Request Free Sample

Regional Analysis

North America is estimated to contribute 38.6% to the growth of the global market during the forecast period.Technavio’s analysts have elaborately explained the regional trends and drivers that shape the market during the forecast period.

See How Post Production Market Demand is Rising in North America Request Free Sample

The geographic landscape of the global post production market is characterized by distinct regional strengths and growth trajectories.

North America remains the dominant region, contributing approximately 39% of the market's incremental growth, driven by its high concentration of major studios and technology developers in the United States and Canada.

This region leads in adopting advanced technologies like in-camera visual effects and neural engines.

Meanwhile, APAC is the fastest-growing region, accounting for nearly 27% of new growth, with countries like India and China emerging as global hubs for VFX outsourcing and large-scale domestic productions.

Europe holds its position with specialized centers in the UK, France, and Germany, excelling in high-end visual effects, animation, and sophisticated localization services.

The adoption of object-based sound design and high-frame-rate video standards is prominent across these developed markets, reinforcing their critical role in the industry.

Market Dynamics

Our researchers analyzed the data with 2025 as the base year, along with the key drivers, trends, and challenges. A holistic analysis of drivers will help companies refine their marketing strategies to gain a competitive advantage.

  • The strategic direction of the global post production market is increasingly shaped by the sophisticated interplay of advanced technologies designed to meet escalating consumer expectations for quality and immersion. The implementation of AI in post production workflow automation is central to this shift, enabling studios to manage complex projects with greater efficiency.
  • For instance, firms leveraging cloud collaboration for remote video editing report project turnaround times that are up to 30% faster than those relying on traditional, localized infrastructure. This efficiency is critical as the industry standardizes around HDR color grading for streaming content and prepares for the broader adoption of post production for 8K video content.
  • The creative possibilities are expanding with the use of generative AI for VFX and scene extension, which allows for visual adjustments without costly reshoots. Simultaneously, the adoption of Dolby Atmos mixing for immersive audio is becoming a key differentiator for premium content.
  • The move toward real-time rendering for virtual production is blurring the lines between principal photography and post production, streamlining the entire content creation cycle. As these trends converge, data security in decentralized post production emerges as a paramount concern, requiring robust protocols to protect intellectual property.
  • Furthermore, VFX pipeline optimization for feature films and the push to automate localization with AI tools are becoming essential for maintaining competitiveness in a globalized media environment. These interconnected developments define the modern post production landscape, demanding continuous investment in technology and talent.

What are the key market drivers leading to the rise in the adoption of Post Production Industry?

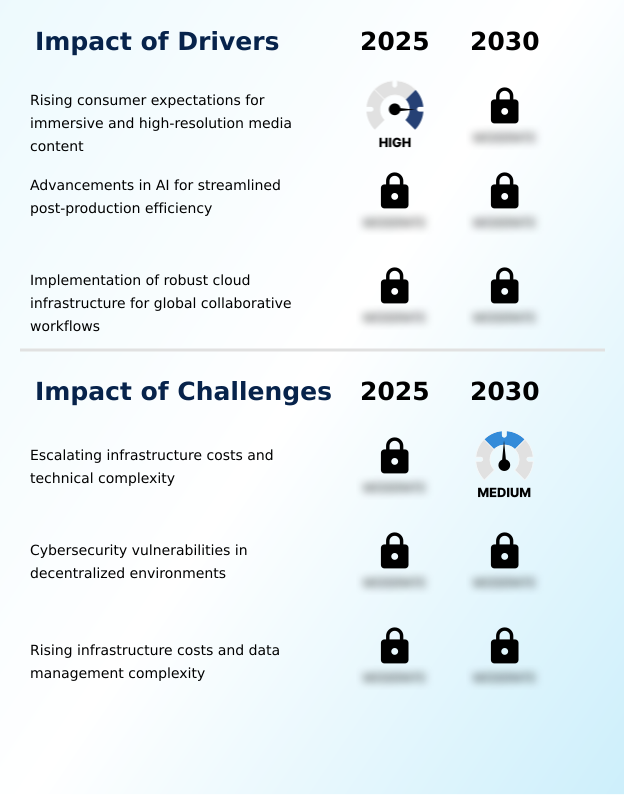
  • A key market driver is the rising consumer expectation for immersive and high-resolution media content, which necessitates advanced post production capabilities to deliver premium viewing experiences.

  • Rising consumer expectations for immersive, high-resolution media are a primary driver for the global post production market. The demand for 4K, 8K, and high-dynamic-range content necessitates continuous investment in advanced technology and infrastructure.
  • Managing these high-resolution files increases data throughput requirements by up to 400% when moving from 4K to 8K, driving demand for specialized storage and computational solutions. Another key driver is the integration of AI and machine learning to streamline efficiency.
  • AI-driven automation of tasks like rotoscoping and color matching can reduce post production cycles by up to 30%.
  • Furthermore, the shift to cloud-native workflows and remote collaboration is reshaping the industry's structure, allowing studios to access global talent and scale computational resources on demand, thereby improving operational flexibility and reducing dependency on localized hardware.

What are the market trends shaping the Post Production Industry?

  • The integration of generative AI within creative pipelines is emerging as a transformative market trend. This technology is becoming a core component of the content creation process, automating complex tasks and enhancing visual innovation.

  • The global post production market is being transformed by the integration of generative AI within creative pipelines and the proliferation of cloud-native architectures. These trends facilitate a hybrid model where AI handles labor-intensive tasks, such as background expansion and object replacement, allowing editors to focus on narrative direction.
  • The adoption of generative video tools has been shown to reduce manual frame manipulation time by over 40%, significantly accelerating project timelines. Concurrently, the migration to cloud-native platforms supports a decentralized workforce, with some studios reporting a 25% increase in talent pool access.
  • This shift also democratizes access to high-performance virtual workstations and scalable rendering, enabling smaller firms to compete with major studios. The convergence of gaming engine technology with cinematic post production is also creating new paradigms in virtual production and real-time rendering.

What challenges does the Post Production Industry face during its growth?

  • Escalating infrastructure costs and associated technical complexity represent a key challenge impacting the industry's growth trajectory, particularly with the shift to high-resolution content formats.

  • The global post production market faces significant challenges from escalating infrastructure costs and growing data management complexity. The transition to 4K and 8K resolutions exponentially increases data volumes, requiring substantial investments in high-speed network storage and powerful server architectures, which can increase capital expenditures by over 60% for facilities.
  • The operational costs for cooling and high-bandwidth connectivity for cloud-based collaboration add further financial pressure. A second major challenge is the rise of cybersecurity vulnerabilities in decentralized workflows. Securing intellectual property across remote networks introduces complexities, with the attack surface for cybercriminals expanding significantly.
  • Implementing multi-factor authentication and advanced threat detection systems is critical but adds layers of technical difficulty and cost, forcing a difficult balance between seamless collaboration and absolute data security.

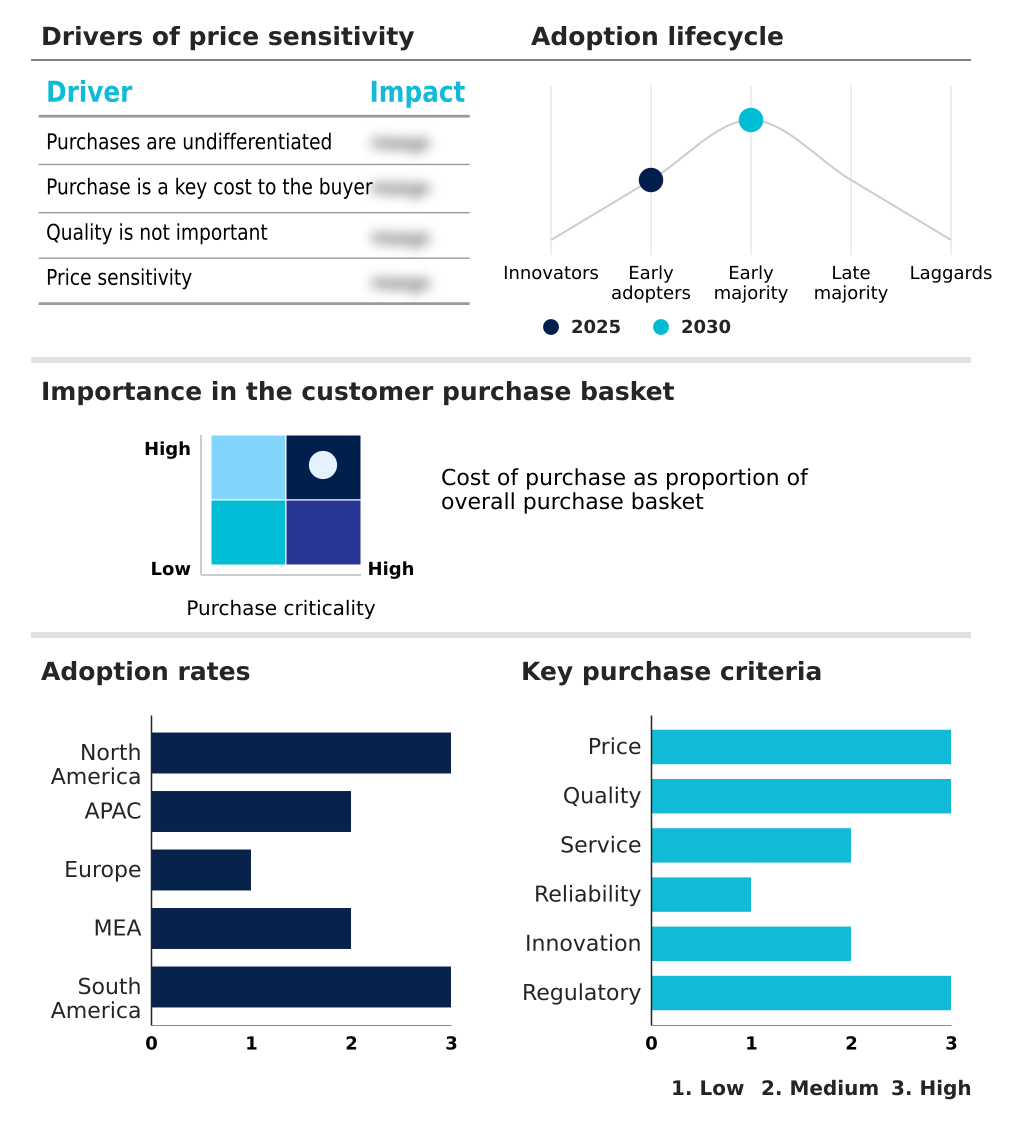
Exclusive Technavio Analysis on Customer Landscape

The post production market forecasting report includes the adoption lifecycle of the market, covering from the innovator’s stage to the laggard’s stage. It focuses on adoption rates in different regions based on penetration. Furthermore, the post production market report also includes key purchase criteria and drivers of price sensitivity to help companies evaluate and develop their market growth analysis strategies.

Customer Landscape of Post Production Industry

Competitive Landscape

Companies are implementing various strategies, such as strategic alliances, post production market forecast, partnerships, mergers and acquisitions, geographical expansion, and product/service launches, to enhance their presence in the industry.

Amazon.com Inc. - Analysis shows a focus on delivering end-to-end, cloud-based workflows featuring scalable rendering, remote editorial workstations, and automated media ingest to improve post production efficiency.

The industry research and growth report includes detailed analyses of the competitive landscape of the market and information about key companies, including:

  • Amazon.com Inc.
  • AT and T Inc.
  • Comcast Corp.
  • Deluxe Media Inc.
  • Eros International Media Ltd.
  • Framestore Ltd.
  • Lantern Entertainment
  • Lions Gate Entertainment Corp.
  • Netflix Inc.
  • Paramount Global
  • Pixel Digital Studios
  • Prime Focus Ltd.
  • Red Chillies Entertainments
  • Sony Group Corp.
  • Storyteller Distribution Co. LLC
  • Streamland Media Inc.
  • STUDIO GHIBLI Inc.
  • The Walt Disney Co.
  • Weta Digital Ltd.

Qualitative and quantitative analysis of companies has been conducted to help clients understand the wider business environment as well as the strengths and weaknesses of key industry players. Data is qualitatively analyzed to categorize companies as pure play, category-focused, industry-focused, and diversified; it is quantitatively analyzed to categorize companies as dominant, leading, strong, tentative, and weak.

Recent Development and News in Post production market

  • In September, 2024, Lionsgate Entertainment Corporation established a strategic partnership to implement a customized generative artificial intelligence suite to assist in the final mastering and color grading of large-scale cinematic projects.
  • In October, 2024, Adobe Systems Incorporated integrated generative AI features directly into its Premiere Pro application, enabling editors to use text-based editing and generative extension capabilities.
  • In April, 2025, Netflix Incorporated implemented a new global framework for its production partners, which mandates the use of specific cloud-integrated security protocols for all high-definition content processing.
  • In May, 2025, Sony Corporation introduced an enhanced version of its Ci Media Cloud platform, which includes real-time synchronization features for multi-user editing and frame-accurate review tools for uncompressed 8K video streams.

Dive into Technavio’s robust research methodology, blending expert interviews, extensive data synthesis, and validated models for unparalleled Post Production Market insights. See full methodology.

Market Scope
Page number 306
Base year 2025
Historic period 2020-2024
Forecast period 2026-2030
Growth momentum & CAGR Accelerate at a CAGR of 12.9%
Market growth 2026-2030 USD 18203.5 million
Market structure Fragmented
YoY growth 2025-2026(%) 12.3%
Key countries US, Canada, Mexico, China, India, Japan, South Korea, Australia, Singapore, UK, Germany, France, Italy, Spain, The Netherlands, UAE, South Africa, Saudi Arabia, Egypt, Israel, Brazil, Argentina and Chile
Competitive landscape Leading Companies, Market Positioning of Companies, Competitive Strategies, and Industry Risks

Request Free Sample

Research Analyst Overview

  • The global post production market is advancing through the deep integration of sophisticated technologies that are reshaping creative and operational workflows. Innovations such as cloud-native workflows and real-time rendering are now foundational, allowing for decentralized global collaboration and more efficient production cycles.
  • The adoption of generative AI has moved beyond automation to become a pivotal creative tool for tasks like digital compositing and motion graphics. Boardroom decisions are increasingly influenced by the need to invest in infrastructure capable of handling high dynamic range (HDR) content and immersive audio formats, impacting capital expenditure on specialized color grading and sound design suites.
  • Visual effects pipelines now heavily rely on neural engines for complex processes like rotoscoping and multi-source editing. This technological push, which has led to processing time reductions of up to 30% in certain tasks, is essential for managing the demands of stereoscopic 3D conversion, automated dialogue replacement (ADR), and high-frame-rate video.
  • Consequently, digital asset management and metadata management systems have become critical for maintaining quality and security across the entire post production process, including the creation of the final digital cinema package (DCP) and the implementation of in-camera visual effects and object-based sound design.

What are the Key Data Covered in this Post Production Market Research and Growth Report?

  • What is the expected growth of the Post Production Market between 2026 and 2030?

    • USD 18.20 billion, at a CAGR of 12.9%

  • What segmentation does the market report cover?

    • The report is segmented by Technique (VFX, Audio processing, 2D and 3D conversion, Editing, and Others), Application (Movies, Television, Commercials, and Online videos), End-user (Production houses, Independent filmmakers, and Television studios) and Geography (North America, APAC, Europe, Middle East and Africa, South America)

  • Which regions are analyzed in the report?

    • North America, APAC, Europe, Middle East and Africa and South America

  • What are the key growth drivers and market challenges?

    • Rising consumer expectations for immersive and high-resolution media content, Escalating infrastructure costs and technical complexity

  • Who are the major players in the Post Production Market?

    • Amazon.com Inc., AT and T Inc., Comcast Corp., Deluxe Media Inc., Eros International Media Ltd., Framestore Ltd., Lantern Entertainment, Lions Gate Entertainment Corp., Netflix Inc., Paramount Global, Pixel Digital Studios, Prime Focus Ltd., Red Chillies Entertainments, Sony Group Corp., Storyteller Distribution Co. LLC, Streamland Media Inc., STUDIO GHIBLI Inc., The Walt Disney Co. and Weta Digital Ltd.

Market Research Insights

  • The post production market is defined by a dynamic interplay of technological advancements and shifting workflow paradigms. The proliferation of remote collaboration tools has become central, with adoption rates increasing by over 40% as studios embrace decentralized talent pools. This is supported by the development of virtual workstations and robust edge server networks, which reduce latency in global production pipelines.
  • Concurrently, the efficiency of the media supply chain is being optimized through AI-driven archival footage restoration and advanced localization services, which have been shown to accelerate content delivery to international markets by up to 25%. However, rising data management complexity remains a significant hurdle.
  • The need for sophisticated cybersecurity in media is paramount, as distributed workflows expand the potential for intellectual property breaches, demanding a strategic balance between accessibility and security.

We can help! Our analysts can customize this post production market research report to meet your requirements.

Get in touch

1. Executive Summary

1.1 Market overview

Executive Summary - Chart on Market Overview
Executive Summary - Data Table on Market Overview
Executive Summary - Chart on Global Market Characteristics
Executive Summary - Chart on Market by Geography
Executive Summary - Chart on Market Segmentation by Technique
Executive Summary - Chart on Market Segmentation by Application
Executive Summary - Chart on Market Segmentation by End-user
Executive Summary - Chart on Incremental Growth
Executive Summary - Data Table on Incremental Growth
Executive Summary - Chart on Company Market Positioning

2. Technavio Analysis

2.1 Analysis of price sensitivity, lifecycle, customer purchase basket, adoption rates, and purchase criteria

2.2 Criticality of inputs and Factors of differentiation

Chart on Overview on criticality of inputs and factors of differentiation

2.3 Factors of disruption

Chart on Overview on factors of disruption

2.4 Impact of drivers and challenges

Chart on Impact of drivers and challenges in 2025 and 2030

3. Market Landscape

3.1 Market ecosystem

Chart on Parent Market
Data Table on - Parent Market

3.2 Market characteristics

Chart on Market characteristics analysis

3.3 Value chain analysis

Chart on Value chain analysis

4. Market Sizing

4.1 Market definition

Data Table on Offerings of companies included in the market definition

4.2 Market segment analysis

Market segments

4.3 Market size 2025

4.4 Market outlook: Forecast for 2025-2030

Chart on Global - Market size and forecast 2025-2030 ($ million)
Data Table on Global - Market size and forecast 2025-2030 ($ million)
Chart on Global Market: Year-over-year growth 2025-2030 (%)
Data Table on Global Market: Year-over-year growth 2025-2030 (%)

5. Historic Market Size

5.1 Global Post Production Market 2020 - 2024

Historic Market Size - Data Table on Global Post Production Market 2020 - 2024 ($ million)

5.2 Technique segment analysis 2020 - 2024

Historic Market Size - Technique Segment 2020 - 2024 ($ million)

5.3 Application segment analysis 2020 - 2024

Historic Market Size - Application Segment 2020 - 2024 ($ million)

5.4 End-user segment analysis 2020 - 2024

Historic Market Size - End-user Segment 2020 - 2024 ($ million)

5.5 Geography segment analysis 2020 - 2024

Historic Market Size - Geography Segment 2020 - 2024 ($ million)

5.6 Country segment analysis 2020 - 2024

Historic Market Size - Country Segment 2020 - 2024 ($ million)

6. Qualitative Analysis

6.1 Impact of AI on Global Post Production Market

7. Five Forces Analysis

7.1 Five forces summary

Five forces analysis - Comparison between 2025 and 2030

7.2 Bargaining power of buyers

Bargaining power of buyers - Impact of key factors 2025 and 2030

7.3 Bargaining power of suppliers

Bargaining power of suppliers - Impact of key factors in 2025 and 2030

7.4 Threat of new entrants

Threat of new entrants - Impact of key factors in 2025 and 2030

7.5 Threat of substitutes

Threat of substitutes - Impact of key factors in 2025 and 2030

7.6 Threat of rivalry

Threat of rivalry - Impact of key factors in 2025 and 2030

7.7 Market condition

Chart on Market condition - Five forces 2025 and 2030

8. Market Segmentation by Technique

8.1 Market segments

Chart on Technique - Market share 2025-2030 (%)
Data Table on Technique - Market share 2025-2030 (%)

8.2 Comparison by Technique

Chart on Comparison by Technique
Data Table on Comparison by Technique

8.3 VFX - Market size and forecast 2025-2030

Chart on VFX - Market size and forecast 2025-2030 ($ million)
Data Table on VFX - Market size and forecast 2025-2030 ($ million)
Chart on VFX - Year-over-year growth 2025-2030 (%)
Data Table on VFX - Year-over-year growth 2025-2030 (%)

8.4 Audio processing - Market size and forecast 2025-2030

Chart on Audio processing - Market size and forecast 2025-2030 ($ million)
Data Table on Audio processing - Market size and forecast 2025-2030 ($ million)
Chart on Audio processing - Year-over-year growth 2025-2030 (%)
Data Table on Audio processing - Year-over-year growth 2025-2030 (%)

8.5 2D and 3D conversion - Market size and forecast 2025-2030

Chart on 2D and 3D conversion - Market size and forecast 2025-2030 ($ million)
Data Table on 2D and 3D conversion - Market size and forecast 2025-2030 ($ million)
Chart on 2D and 3D conversion - Year-over-year growth 2025-2030 (%)
Data Table on 2D and 3D conversion - Year-over-year growth 2025-2030 (%)

8.6 Editing - Market size and forecast 2025-2030

Chart on Editing - Market size and forecast 2025-2030 ($ million)
Data Table on Editing - Market size and forecast 2025-2030 ($ million)
Chart on Editing - Year-over-year growth 2025-2030 (%)
Data Table on Editing - Year-over-year growth 2025-2030 (%)

8.7 Others - Market size and forecast 2025-2030

Chart on Others - Market size and forecast 2025-2030 ($ million)
Data Table on Others - Market size and forecast 2025-2030 ($ million)
Chart on Others - Year-over-year growth 2025-2030 (%)
Data Table on Others - Year-over-year growth 2025-2030 (%)

8.8 Market opportunity by Technique

Market opportunity by Technique ($ million)
Data Table on Market opportunity by Technique ($ million)

9. Market Segmentation by Application

9.1 Market segments

Chart on Application - Market share 2025-2030 (%)
Data Table on Application - Market share 2025-2030 (%)

9.2 Comparison by Application

Chart on Comparison by Application
Data Table on Comparison by Application

9.3 Movies - Market size and forecast 2025-2030

Chart on Movies - Market size and forecast 2025-2030 ($ million)
Data Table on Movies - Market size and forecast 2025-2030 ($ million)
Chart on Movies - Year-over-year growth 2025-2030 (%)
Data Table on Movies - Year-over-year growth 2025-2030 (%)

9.4 Television - Market size and forecast 2025-2030

Chart on Television - Market size and forecast 2025-2030 ($ million)
Data Table on Television - Market size and forecast 2025-2030 ($ million)
Chart on Television - Year-over-year growth 2025-2030 (%)
Data Table on Television - Year-over-year growth 2025-2030 (%)

9.5 Commercials - Market size and forecast 2025-2030

Chart on Commercials - Market size and forecast 2025-2030 ($ million)
Data Table on Commercials - Market size and forecast 2025-2030 ($ million)
Chart on Commercials - Year-over-year growth 2025-2030 (%)
Data Table on Commercials - Year-over-year growth 2025-2030 (%)

9.6 Online videos - Market size and forecast 2025-2030

Chart on Online videos - Market size and forecast 2025-2030 ($ million)
Data Table on Online videos - Market size and forecast 2025-2030 ($ million)
Chart on Online videos - Year-over-year growth 2025-2030 (%)
Data Table on Online videos - Year-over-year growth 2025-2030 (%)

9.7 Market opportunity by Application

Market opportunity by Application ($ million)
Data Table on Market opportunity by Application ($ million)

10. Market Segmentation by End-user

10.1 Market segments

Chart on End-user - Market share 2025-2030 (%)
Data Table on End-user - Market share 2025-2030 (%)

10.2 Comparison by End-user

Chart on Comparison by End-user
Data Table on Comparison by End-user

10.3 Production houses - Market size and forecast 2025-2030

Chart on Production houses - Market size and forecast 2025-2030 ($ million)
Data Table on Production houses - Market size and forecast 2025-2030 ($ million)
Chart on Production houses - Year-over-year growth 2025-2030 (%)
Data Table on Production houses - Year-over-year growth 2025-2030 (%)

10.4 Independent filmmakers - Market size and forecast 2025-2030

Chart on Independent filmmakers - Market size and forecast 2025-2030 ($ million)
Data Table on Independent filmmakers - Market size and forecast 2025-2030 ($ million)
Chart on Independent filmmakers - Year-over-year growth 2025-2030 (%)
Data Table on Independent filmmakers - Year-over-year growth 2025-2030 (%)

10.5 Television studios - Market size and forecast 2025-2030

Chart on Television studios - Market size and forecast 2025-2030 ($ million)
Data Table on Television studios - Market size and forecast 2025-2030 ($ million)
Chart on Television studios - Year-over-year growth 2025-2030 (%)
Data Table on Television studios - Year-over-year growth 2025-2030 (%)

10.6 Market opportunity by End-user

Market opportunity by End-user ($ million)
Data Table on Market opportunity by End-user ($ million)

11. Customer Landscape

11.1 Customer landscape overview

Analysis of price sensitivity, lifecycle, customer purchase basket, adoption rates, and purchase criteria

12. Geographic Landscape

12.1 Geographic segmentation

Chart on Market share by geography 2025-2030 (%)
Data Table on Market share by geography 2025-2030 (%)

12.2 Geographic comparison

Chart on Geographic comparison
Data Table on Geographic comparison

12.3 North America - Market size and forecast 2025-2030

Chart on North America - Market size and forecast 2025-2030 ($ million)
Data Table on North America - Market size and forecast 2025-2030 ($ million)
Chart on North America - Year-over-year growth 2025-2030 (%)
Data Table on North America - Year-over-year growth 2025-2030 (%)
Chart on Regional Comparison - North America
Data Table on Regional Comparison - North America

12.3.1 US - Market size and forecast 2025-2030

Chart on US - Market size and forecast 2025-2030 ($ million)
Data Table on US - Market size and forecast 2025-2030 ($ million)
Chart on US - Year-over-year growth 2025-2030 (%)
Data Table on US - Year-over-year growth 2025-2030 (%)

12.3.2 Canada - Market size and forecast 2025-2030

Chart on Canada - Market size and forecast 2025-2030 ($ million)
Data Table on Canada - Market size and forecast 2025-2030 ($ million)
Chart on Canada - Year-over-year growth 2025-2030 (%)
Data Table on Canada - Year-over-year growth 2025-2030 (%)

12.3.3 Mexico - Market size and forecast 2025-2030

Chart on Mexico - Market size and forecast 2025-2030 ($ million)
Data Table on Mexico - Market size and forecast 2025-2030 ($ million)
Chart on Mexico - Year-over-year growth 2025-2030 (%)
Data Table on Mexico - Year-over-year growth 2025-2030 (%)

12.4 APAC - Market size and forecast 2025-2030

Chart on APAC - Market size and forecast 2025-2030 ($ million)
Data Table on APAC - Market size and forecast 2025-2030 ($ million)
Chart on APAC - Year-over-year growth 2025-2030 (%)
Data Table on APAC - Year-over-year growth 2025-2030 (%)
Chart on Regional Comparison - APAC
Data Table on Regional Comparison - APAC

12.4.1 China - Market size and forecast 2025-2030

Chart on China - Market size and forecast 2025-2030 ($ million)
Data Table on China - Market size and forecast 2025-2030 ($ million)
Chart on China - Year-over-year growth 2025-2030 (%)
Data Table on China - Year-over-year growth 2025-2030 (%)

12.4.2 India - Market size and forecast 2025-2030

Chart on India - Market size and forecast 2025-2030 ($ million)
Data Table on India - Market size and forecast 2025-2030 ($ million)
Chart on India - Year-over-year growth 2025-2030 (%)
Data Table on India - Year-over-year growth 2025-2030 (%)

12.4.3 Japan - Market size and forecast 2025-2030

Chart on Japan - Market size and forecast 2025-2030 ($ million)
Data Table on Japan - Market size and forecast 2025-2030 ($ million)
Chart on Japan - Year-over-year growth 2025-2030 (%)
Data Table on Japan - Year-over-year growth 2025-2030 (%)

12.4.4 South Korea - Market size and forecast 2025-2030

Chart on South Korea - Market size and forecast 2025-2030 ($ million)
Data Table on South Korea - Market size and forecast 2025-2030 ($ million)
Chart on South Korea - Year-over-year growth 2025-2030 (%)
Data Table on South Korea - Year-over-year growth 2025-2030 (%)

12.4.5 Australia - Market size and forecast 2025-2030

Chart on Australia - Market size and forecast 2025-2030 ($ million)
Data Table on Australia - Market size and forecast 2025-2030 ($ million)
Chart on Australia - Year-over-year growth 2025-2030 (%)
Data Table on Australia - Year-over-year growth 2025-2030 (%)

12.4.6 Singapore - Market size and forecast 2025-2030

Chart on Singapore - Market size and forecast 2025-2030 ($ million)
Data Table on Singapore - Market size and forecast 2025-2030 ($ million)
Chart on Singapore - Year-over-year growth 2025-2030 (%)
Data Table on Singapore - Year-over-year growth 2025-2030 (%)

12.5 Europe - Market size and forecast 2025-2030

Chart on Europe - Market size and forecast 2025-2030 ($ million)
Data Table on Europe - Market size and forecast 2025-2030 ($ million)
Chart on Europe - Year-over-year growth 2025-2030 (%)
Data Table on Europe - Year-over-year growth 2025-2030 (%)
Chart on Regional Comparison - Europe
Data Table on Regional Comparison - Europe

12.5.1 UK - Market size and forecast 2025-2030

Chart on UK - Market size and forecast 2025-2030 ($ million)
Data Table on UK - Market size and forecast 2025-2030 ($ million)
Chart on UK - Year-over-year growth 2025-2030 (%)
Data Table on UK - Year-over-year growth 2025-2030 (%)

12.5.2 Germany - Market size and forecast 2025-2030

Chart on Germany - Market size and forecast 2025-2030 ($ million)
Data Table on Germany - Market size and forecast 2025-2030 ($ million)
Chart on Germany - Year-over-year growth 2025-2030 (%)
Data Table on Germany - Year-over-year growth 2025-2030 (%)

12.5.3 France - Market size and forecast 2025-2030

Chart on France - Market size and forecast 2025-2030 ($ million)
Data Table on France - Market size and forecast 2025-2030 ($ million)
Chart on France - Year-over-year growth 2025-2030 (%)
Data Table on France - Year-over-year growth 2025-2030 (%)

12.5.4 Italy - Market size and forecast 2025-2030

Chart on Italy - Market size and forecast 2025-2030 ($ million)
Data Table on Italy - Market size and forecast 2025-2030 ($ million)
Chart on Italy - Year-over-year growth 2025-2030 (%)
Data Table on Italy - Year-over-year growth 2025-2030 (%)

12.5.5 Spain - Market size and forecast 2025-2030

Chart on Spain - Market size and forecast 2025-2030 ($ million)
Data Table on Spain - Market size and forecast 2025-2030 ($ million)
Chart on Spain - Year-over-year growth 2025-2030 (%)
Data Table on Spain - Year-over-year growth 2025-2030 (%)

12.5.6 The Netherlands - Market size and forecast 2025-2030

Chart on The Netherlands - Market size and forecast 2025-2030 ($ million)
Data Table on The Netherlands - Market size and forecast 2025-2030 ($ million)
Chart on The Netherlands - Year-over-year growth 2025-2030 (%)
Data Table on The Netherlands - Year-over-year growth 2025-2030 (%)

12.6 Middle East and Africa - Market size and forecast 2025-2030

Chart on Middle East and Africa - Market size and forecast 2025-2030 ($ million)
Data Table on Middle East and Africa - Market size and forecast 2025-2030 ($ million)
Chart on Middle East and Africa - Year-over-year growth 2025-2030 (%)
Data Table on Middle East and Africa - Year-over-year growth 2025-2030 (%)
Chart on Regional Comparison - Middle East and Africa
Data Table on Regional Comparison - Middle East and Africa

12.6.1 UAE - Market size and forecast 2025-2030

Chart on UAE - Market size and forecast 2025-2030 ($ million)
Data Table on UAE - Market size and forecast 2025-2030 ($ million)
Chart on UAE - Year-over-year growth 2025-2030 (%)
Data Table on UAE - Year-over-year growth 2025-2030 (%)

12.6.2 South Africa - Market size and forecast 2025-2030

Chart on South Africa - Market size and forecast 2025-2030 ($ million)
Data Table on South Africa - Market size and forecast 2025-2030 ($ million)
Chart on South Africa - Year-over-year growth 2025-2030 (%)
Data Table on South Africa - Year-over-year growth 2025-2030 (%)

12.6.3 Saudi Arabia - Market size and forecast 2025-2030

Chart on Saudi Arabia - Market size and forecast 2025-2030 ($ million)
Data Table on Saudi Arabia - Market size and forecast 2025-2030 ($ million)
Chart on Saudi Arabia - Year-over-year growth 2025-2030 (%)
Data Table on Saudi Arabia - Year-over-year growth 2025-2030 (%)

12.6.4 Egypt - Market size and forecast 2025-2030

Chart on Egypt - Market size and forecast 2025-2030 ($ million)
Data Table on Egypt - Market size and forecast 2025-2030 ($ million)
Chart on Egypt - Year-over-year growth 2025-2030 (%)
Data Table on Egypt - Year-over-year growth 2025-2030 (%)

12.6.5 Israel - Market size and forecast 2025-2030

Chart on Israel - Market size and forecast 2025-2030 ($ million)
Data Table on Israel - Market size and forecast 2025-2030 ($ million)
Chart on Israel - Year-over-year growth 2025-2030 (%)
Data Table on Israel - Year-over-year growth 2025-2030 (%)

12.7 South America - Market size and forecast 2025-2030

Chart on South America - Market size and forecast 2025-2030 ($ million)
Data Table on South America - Market size and forecast 2025-2030 ($ million)
Chart on South America - Year-over-year growth 2025-2030 (%)
Data Table on South America - Year-over-year growth 2025-2030 (%)
Chart on Regional Comparison - South America
Data Table on Regional Comparison - South America

12.7.1 Brazil - Market size and forecast 2025-2030

Chart on Brazil - Market size and forecast 2025-2030 ($ million)
Data Table on Brazil - Market size and forecast 2025-2030 ($ million)
Chart on Brazil - Year-over-year growth 2025-2030 (%)
Data Table on Brazil - Year-over-year growth 2025-2030 (%)

12.7.2 Argentina - Market size and forecast 2025-2030

Chart on Argentina - Market size and forecast 2025-2030 ($ million)
Data Table on Argentina - Market size and forecast 2025-2030 ($ million)
Chart on Argentina - Year-over-year growth 2025-2030 (%)
Data Table on Argentina - Year-over-year growth 2025-2030 (%)

12.7.3 Chile - Market size and forecast 2025-2030

Chart on Chile - Market size and forecast 2025-2030 ($ million)
Data Table on Chile - Market size and forecast 2025-2030 ($ million)
Chart on Chile - Year-over-year growth 2025-2030 (%)
Data Table on Chile - Year-over-year growth 2025-2030 (%)

12.8 Market opportunity by geography

Market opportunity by geography ($ million)
Data Tables on Market opportunity by geography ($ million)

13. Drivers, Challenges, and Opportunity

13.1 Market drivers

Rising consumer expectations for immersive and high-resolution media content
Advancements in AI for streamlined post-production efficiency
Implementation of robust cloud infrastructure for global collaborative workflows

13.2 Market challenges

Escalating infrastructure costs and technical complexity
Cybersecurity vulnerabilities in decentralized environments
Rising infrastructure costs and data management complexity

13.3 Impact of drivers and challenges

Impact of drivers and challenges in 2025 and 2030

13.4 Market opportunities

Integration of generative AI within creative pipelines
Proliferation of cloud-native collaboration platforms
Intersection of gaming engine technology and cinematic post production

14. Competitive Landscape

14.1 Overview

14.2

Overview on criticality of inputs and factors of differentiation

14.3 Landscape disruption

Overview on factors of disruption

14.4 Industry risks

Impact of key risks on business

15. Competitive Analysis

15.1 Companies profiled

Companies covered

15.2 Company ranking index

15.3 Market positioning of companies

Matrix on companies position and classification

15.4 Amazon.com Inc.

Amazon.com Inc. - Overview
Amazon.com Inc. - Business segments
Amazon.com Inc. - Key news
Amazon.com Inc. - Key offerings
Amazon.com Inc. - Segment focus
SWOT

15.5 AT and T Inc.

AT and T Inc. - Overview
AT and T Inc. - Business segments
AT and T Inc. - Key news
AT and T Inc. - Key offerings
AT and T Inc. - Segment focus
SWOT

15.6 Comcast Corp.

Comcast Corp. - Overview
Comcast Corp. - Business segments
Comcast Corp. - Key news
Comcast Corp. - Key offerings
Comcast Corp. - Segment focus
SWOT

15.7 Deluxe Media Inc.

Deluxe Media Inc. - Overview
Deluxe Media Inc. - Product / Service
Deluxe Media Inc. - Key offerings
SWOT

15.8 Framestore Ltd.

Framestore Ltd. - Overview
Framestore Ltd. - Product / Service
Framestore Ltd. - Key offerings
SWOT

15.9 Lantern Entertainment

Lantern Entertainment - Overview
Lantern Entertainment - Product / Service
Lantern Entertainment - Key offerings
SWOT

15.10 Lions Gate Entertainment Corp.

Lions Gate Entertainment Corp. - Overview
Lions Gate Entertainment Corp. - Product / Service
Lions Gate Entertainment Corp. - Key offerings
SWOT

15.11 Netflix Inc.

Netflix Inc. - Overview
Netflix Inc. - Product / Service
Netflix Inc. - Key offerings
SWOT

15.12 Paramount Global

Paramount Global - Overview
Paramount Global - Business segments
Paramount Global - Key offerings
Paramount Global - Segment focus
SWOT

15.13 Prime Focus Ltd.

Prime Focus Ltd. - Overview
Prime Focus Ltd. - Business segments
Prime Focus Ltd. - Key offerings
Prime Focus Ltd. - Segment focus
SWOT

15.14 Red Chillies Entertainments

Red Chillies Entertainments - Overview
Red Chillies Entertainments - Product / Service
Red Chillies Entertainments - Key offerings
SWOT

15.15 Sony Group Corp.

Sony Group Corp. - Overview
Sony Group Corp. - Business segments
Sony Group Corp. - Key offerings
Sony Group Corp. - Segment focus
SWOT

15.16 Streamland Media Inc.

Streamland Media Inc. - Overview
Streamland Media Inc. - Product / Service
Streamland Media Inc. - Key offerings
SWOT

15.17 STUDIO GHIBLI Inc.

STUDIO GHIBLI Inc. - Overview
STUDIO GHIBLI Inc. - Product / Service
STUDIO GHIBLI Inc. - Key offerings
SWOT

15.18 The Walt Disney Co.

The Walt Disney Co. - Overview
The Walt Disney Co. - Business segments
The Walt Disney Co. - Key offerings
The Walt Disney Co. - Segment focus
SWOT

16. Appendix

16.1 Scope of the report

Market definition
Objectives
Notes and caveats

16.2 Inclusions and exclusions checklist

Inclusions checklist
Exclusions checklist

16.3 Currency conversion rates for US$

16.4 Research methodology

16.5 Data procurement

Information sources

16.6 Data validation

16.7 Validation techniques employed for market sizing

16.8 Data synthesis

16.9 360 degree market analysis

16.10 List of abbreviations

Research Methodology

Technavio presents a detailed picture of the market by way of study, synthesis, and summation of data from multiple sources. The analysts have presented the various facets of the market with a particular focus on identifying the key industry influencers. The data thus presented is comprehensive, reliable, and the result of extensive research, both primary and secondary.

INFORMATION SOURCES

Primary sources

  • Manufacturers and suppliers
  • Channel partners
  • Industry experts
  • Strategic decision makers

Secondary sources

  • Industry journals and periodicals
  • Government data
  • Financial reports of key industry players
  • Historical data
  • Press releases

DATA ANALYSIS

Data Synthesis

  • Collation of data
  • Estimation of key figures
  • Analysis of derived insights

Data Validation

  • Triangulation with data models
  • Reference against proprietary databases
  • Corroboration with industry experts

REPORT WRITING

Qualitative

  • Market drivers
  • Market challenges
  • Market trends
  • Five forces analysis

Quantitative

  • Market size and forecast
  • Market segmentation
  • Geographical insights
  • Competitive landscape

Interested in this report?

Get your sample now to see our research methodology and insights!

Download Now

Frequently Asked Questions

Post Production market growth will increase by USD 18203.5 million during 2026-2030.

The Post Production market is expected to grow at a CAGR of 12.9% during 2026-2030.

Post Production market is segmented by Technique (VFX, Audio processing, 2D and 3D conversion, Editing, Others) Application (Movies, Television, Commercials, Online videos) End-user (Production houses, Independent filmmakers, Television studios)

Amazon.com Inc., AT and T Inc., Comcast Corp., Deluxe Media Inc., Eros International Media Ltd., Framestore Ltd., Lantern Entertainment, Lions Gate Entertainment Corp., Netflix Inc., Paramount Global, Pixel Digital Studios, Prime Focus Ltd., Red Chillies Entertainments, Sony Group Corp., Storyteller Distribution Co. LLC, Streamland Media Inc., STUDIO GHIBLI Inc., The Walt Disney Co., Weta Digital Ltd. are a few of the key vendors in the Post Production market.

North America will register the highest growth rate of 38.6% among the other regions. Therefore, the Post Production market in North America is expected to garner significant business opportunities for the vendors during the forecast period.

US, Canada, Mexico, China, India, Japan, South Korea, Australia, Singapore, UK, Germany, France, Italy, Spain, The Netherlands, UAE, South Africa, Saudi Arabia, Egypt, Israel, Brazil, Argentina, Chile

  • Rising consumer expectations for immersive and high-resolution media content is the driving factor this market.

The Post Production market vendors should focus on grabbing business opportunities from the Technique segment as it accounted for the largest market share in the base year.