Potassium Hydroxide Market Size 2025-2029
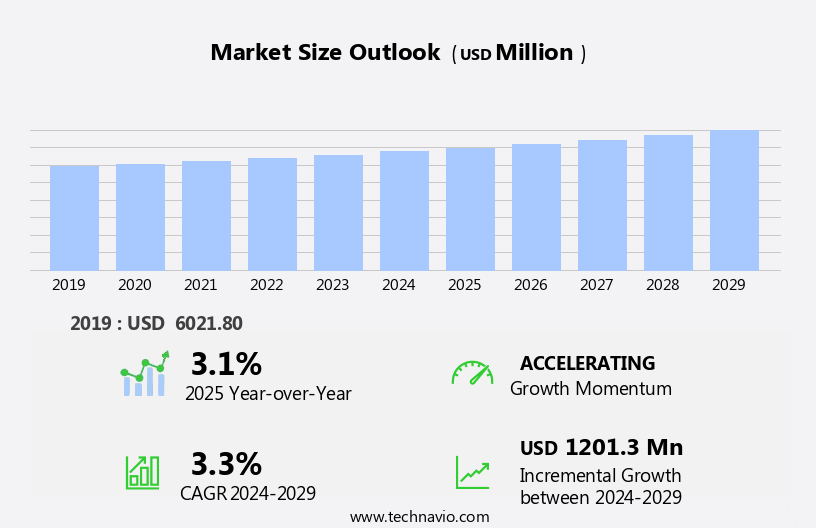
The potassium hydroxide market size is forecast to increase by USD 1.2 billion at a CAGR of 3.3% between 2024 and 2029.
- The market exhibits growth, driven by the expanding demand for potassium carbonate in various industries, including glass, soap and detergent, and chemical manufacturing. Key market participants are responding to this trend by expanding production capacities and constructing new plants. However, the market faces challenges from less expensive substitutes, such as sodium hydroxide and ammonia, which may limit the growth potential in certain applications. Companies seeking to capitalize on market opportunities must focus on innovation and cost competitiveness to differentiate themselves.
- Strategic partnerships and collaborations can also help market players navigate the competitive landscape and stay ahead of emerging trends. Overall, the market presents significant growth prospects for investors and businesses in the chemical industry, with opportunities in emerging economies and niche applications.
What will be the Size of the Potassium Hydroxide Market during the forecast period?
- The market encompasses the production, sale, and application of caustic potash solutions, potassium hydroxide pellets, and KOH flakes. This market exhibits growth, driven by expanding electrochemical applications, particularly in battery electrolytes for renewable energy storage. The demand for potassium hydroxide is further fueled by the increasing adoption of bio-based chemicals, circular economy principles, and sustainable manufacturing processes. Moreover, the automotive production sector is witnessing a rise in demand for electrochromic materials for energy-efficient solutions. Process safety, quality control, and regulatory compliance are critical considerations in the market, with stringent product specifications and environmental impact assessments shaping industry standards.
- The market is characterized by a focus on resource efficiency, waste minimization, and process automation, as well as data analytics and supply chain optimization to enhance product life cycle management and end-of-life management strategies. The market is further expanding into consumer electronics, such as smartphones and electronic displays, offering functional improvements and sleek designs. Competitive intelligence, strategic partnerships, investment opportunities, and technological innovation are essential elements driving market growth, as companies differentiate their value propositions through brand building, customer segmentation, sales channels, and exceptional customer service.
How is this Potassium Hydroxide Industry segmented?
The potassium hydroxide industry research report provides comprehensive data (region-wise segment analysis), with forecasts and estimates in "USD million" for the period 2025-2029, as well as historical data from 2019-2023 for the following segments.
- Type
- Solid potassium hydroxide
- Liquid potassium hydroxide
- Application
- Potassium carbonate
- Chemical intermediates
- Potassium salts
- Pharma and household
- Others
- Variant
- 90-95 percentage purity
- 85-90 percentage purity
- 80-85 percentage purity
- 75-80 percentage purity
- Grade Type
- Technical grade
- Food grade
- Pharmaceutical grade
- Geography
- APAC
- Australia
- China
- India
- Japan
- South Korea
- North America
- US
- Canada
- Europe
- France
- Germany
- UK
- South America
- Middle East and Africa
- APAC
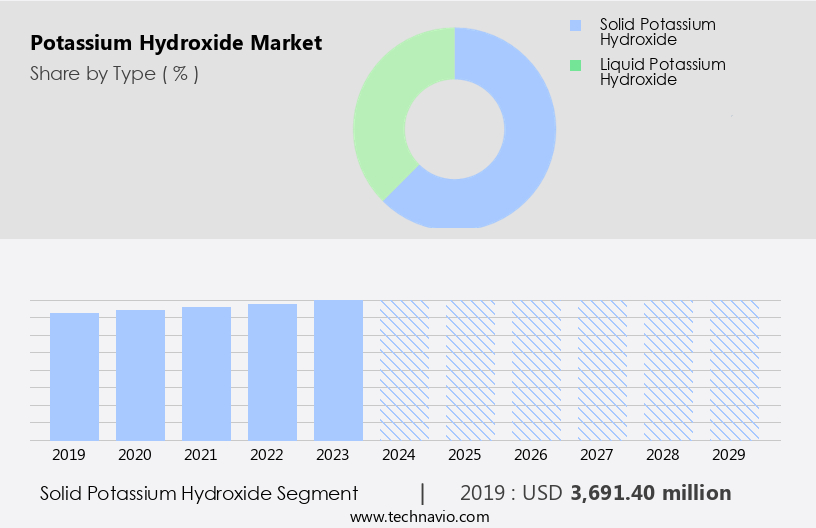
By Type Insights
The solid potassium hydroxide segment is estimated to witness significant growth during the forecast period. Potassium hydroxide, also known as Caustic Potash, is a crucial inorganic compound in the industrial and specialty chemicals sectors. This versatile chemical is widely used as a strong base and alkaline reagent in various applications. In the chemical production industry, it is employed in the synthesis of various chemicals, including potassium salts, detergents, fertilizers, and pharmaceuticals. The expanding chemical industry, driven by innovation and process optimization, fuels the demand for potassium hydroxide. In the realm of cleaning agents, potassium hydroxide plays a pivotal role. It is a key ingredient in the production of liquid soaps, detergents, and other cleaning products.
Safety regulations and environmental compliance are also crucial considerations in its production and usage. The adoption of green chemistry principles is a growing trend in the industry, which may impact the demand for potassium hydroxide. In the realm of sales and marketing, customer relationships and brand reputation are essential. Distributors and suppliers play a vital role in ensuring the availability and accessibility of potassium hydroxide to various industries. Effective communication, collaboration, and innovation are key to maintaining strong customer relationships and building a reputable brand in this competitive market.
Get a glance at the market report of share of various segments Request Free Sample
The Solid potassium hydroxide segment was valued at USD 3.69 billion in 2019 and showed a gradual increase during the forecast period.
Regional Analysis
APAC is estimated to contribute 59% to the growth of the global market during the forecast period.Technavio's analysts have elaborately explained the regional trends and drivers that shape the market during the forecast period.

For more insights on the market size of various regions, Request Free Sample
The market holds significant importance in the industrial and specialty chemicals sectors, with applications spanning various industries such as chemical production, water treatment, wastewater treatment, soap production, detergent manufacturing, biodiesel production, fertilizer manufacturing, food processing, battery manufacturing, mineral processing, metal processing, paper manufacturing, and petroleum refining. Inorganic and organic chemistry, process optimization, safety regulations, environmental compliance, and green chemistry are integral to its production and utilization. The Asia Pacific region led the market in 2024, accounting for the largest market share, driven by the increasing use of potassium hydroxide in applications like industrial cleaning, personal care, cosmetics, pharmaceuticals, chemical intermediates, agrochemicals, dyes, inks, and pigments.
The region's rapidly expanding petrochemical industry, particularly in countries like China, India, and Japan, is attracting new manufacturers to set up or expand their manufacturing facilities, making it a preferred destination for foreign investors. Market dynamics include price fluctuations due to raw material costs, energy costs, and labor costs, as well as distribution channels, sales and marketing, customer relationships, brand reputation, pH control, and corrosion inhibitor applications. Chemical Engineering plays a crucial role in optimizing production capacity and ensuring safety regulations and environmental compliance. Green chemistry is a growing trend in the industry, focusing on reducing waste and improving efficiency.
Market Dynamics
Our researchers analyzed the data with 2024 as the base year, along with the key drivers, trends, and challenges. A holistic analysis of drivers will help companies refine their marketing strategies to gain a competitive advantage.
What are the key market drivers leading to the rise in the adoption of Potassium Hydroxide Industry?
- Growing demand for potassium carbonate is the key driver of the market. Potassium hydroxide serves as a crucial input in the production of potassium carbonate, which is extensively utilized as a raw material or chemical intermediate in various industries, including detergents, glass, cosmetics, food, pharmaceuticals, and agriculture. The global potassium carbonate market is primarily driven by the glass industry due to the extensive use of potassium carbonate in the manufacturing of optical and specialty glass for cathode ray tubes (CRTs) in electronics. In the automotive sector, smart glass integrates with IoT technology, advanced safety features, and connected vehicles, enabling automatic tinting, heads-up displays (HUD), and electrochromic technology in connected and autonomous vehicles. The solar industry also benefits from smart glass applications in solar power generation and production of flat glass for solar panels.
- Additionally, the adoption of cost-effective manufacturing techniques for liquid laundry detergents using potassium carbonate presents significant revenue growth opportunities for major detergent manufacturers worldwide. This trend underscores the importance of potassium hydroxide in the global market.
What are the market trends shaping the Potassium Hydroxide Industry?
- Capacity expansions and new plants is the upcoming market trend. The market has experienced growth due to the increasing demand for potassium hydroxide-based products in various industries. Consumer goods, pharmaceuticals, and household cleaning sectors have been key contributors to this expansion. In North America, Asia Pacific, and Europe, the market has witnessed significant development, with production capacities continuously increasing. Notably, Akzo Nobel and Evonik Industries recently established a joint venture (JV) in Ibbenburen, Germany, which has a production capacity of 120 thousand metric tons. This JV, using membrane electrolysis technology, is expected to strengthen the market positions of both companies. Evonik Industries utilizes potassium hydroxide to manufacture other potassium derivatives, such as potassium carbonate, potassium bicarbonate, and potassium formate.
- Its strong alkaline nature enables it to effectively break down oils and fats, making it an essential component in the formulation of cleaning solutions. Beyond cleaning agents, potassium hydroxide finds extensive applications in water treatment and wastewater treatment processes. It is used as a pH control agent and corrosion inhibitor in these applications. In addition, it is employed in the production of biodiesel, batteries, fertilizers, food processing, mineral processing, metal processing, paper manufacturing, petroleum refining, and various other industries. The production capacity, supply chain, price fluctuations, raw material costs, energy costs, and labor costs are significant factors influencing the market dynamics of potassium hydroxide.
What challenges does the Potassium Hydroxide Industry face during its growth?
- Presence of less expensive substitutes is a key challenge affecting the industry growth. The market encounters competition from economical alternatives, such as sodium hydroxide and calcium hydroxide. Despite potassium hydroxide's high-purity level of 85%, it contains approximately 14-15% water, which cannot be eliminated. The presence of water and carbonate in potassium hydroxide, which is not an efficient catalyst and may cause cloudiness in the final ester, makes sodium hydroxide pellets a popular substitute. Although sodium hydroxide is an effective catalyst, it is more expensive than potassium hydroxide, which is nearly three times costlier. This price difference poses a significant challenge to the market's growth. Sodium hydroxide pellets provide satisfactory results with a smaller amount of catalyst, making them a cost-effective alternative for many applications.
- Energy costs, particularly for the production of liquid potassium hydroxide, can also significantly influence market conditions. Safety regulations and environmental compliance are crucial considerations in the market. The production and handling of this chemical require stringent safety measures due to its caustic nature. Additionally, environmental concerns have led to the adoption of green chemistry practices in the industry, which aim to minimize the environmental impact of chemical production. The market is characterized by a complex supply chain, with various players involved in the production, distribution, and sales of the chemical. Sales and marketing efforts are essential for companies to build and maintain strong customer relationships, as brand reputation plays a significant role in the market.
Exclusive Customer Landscape
The potassium hydroxide market forecasting report includes the adoption lifecycle of the market, covering from the innovator's stage to the laggard's stage. It focuses on adoption rates in different regions based on penetration. Furthermore, the potassium hydroxide market report also includes key purchase criteria and drivers of price sensitivity to help companies evaluate and develop their market growth analysis strategies.

Customer Landscape
Key Companies & Market Insights
Companies are implementing various strategies, such as strategic alliances, potassium hydroxide market forecast, partnerships, mergers and acquisitions, geographical expansion, and product/service launches, to enhance their presence in the industry.
AGC Inc. - The company provides fluorinated ion exchange membranes, including Flemion (potassium hydroxide), for the efficient production of caustic soda and caustic potash.
The industry research and growth report includes detailed analyses of the competitive landscape of the market and information about key companies, including:
- AGC Inc.
- Airedale Chemical Co. Ltd.
- Albemarle Corp.
- Altair Chimica S.p.A.
- American Elements
- Ercros SA
- Gujarat Alkalies and Chemicals Ltd.
- Haifa Negev technologies Ltd.
- HAINAN HUARONG CHEMICAL CO. LTD.
- Industrial Chemicals Ltd.
- INEOS Group Holdings S.A.
- Merck KGaA
- Nike Chemical India.
- Occidental Petroleum Corp.
- Olin Corp.
- RAG Stiftung
- Superior Plus Corp.
- Tessenderlo Group NV
- UNID Co. Ltd.
- Vynova Beek BV
Qualitative and quantitative analysis of companies has been conducted to help clients understand the wider business environment as well as the strengths and weaknesses of key industry players. Data is qualitatively analyzed to categorize companies as pure play, category-focused, industry-focused, and diversified; it is quantitatively analyzed to categorize companies as dominant, leading, strong, tentative, and weak.
Research Analyst Overview
The market encompasses the production and trade of caustic potash, both in its liquid and solid forms. This market plays a significant role in the realm of industrial and specialty chemicals, serving various industries such as water treatment, wastewater treatment, soap production, detergent manufacturing, biodiesel production, fertilizer manufacturing, food processing, battery manufacturing, mineral processing, metal processing, paper manufacturing, petroleum refining, and more. Chemical production is the backbone of the market. The process begins with the raw materials, which undergo a series of chemical reactions to produce the desired product. Organic and inorganic chemistry principles are employed in the production of potassium hydroxide, with chemical engineering techniques utilized for process optimization.
The applications of potassium hydroxide are diverse, with its primary uses found in industries that require pH control, corrosion inhibition, or the production of other chemicals. In water treatment and wastewater treatment, potassium hydroxide serves as an essential alkalizing agent. In soap and detergent manufacturing, it acts as a building block in the creation of these consumer products. In biodiesel production, it is used as a catalyst. The market is subject to several market dynamics. Price fluctuations can occur due to various factors, including raw material costs, energy costs, and labor costs. Raw materials, such as potassium chloride, are crucial to the production of potassium hydroxide, and their price volatility can impact the overall market.
The market is a dynamic and intricate sector that serves numerous industries. Its production involves the application of organic and inorganic chemistry principles and process optimization techniques. Market conditions are influenced by factors such as raw material costs, energy costs, and safety regulations, among others. The market's complexity necessitates a well-oiled supply chain and effective sales and marketing efforts to maintain a strong presence.
|
Market Scope |
|
|
Report Coverage |
Details |
|
Page number |
249 |
|
Base year |
2024 |
|
Historic period |
2019-2023 |
|
Forecast period |
2025-2029 |
|
Growth momentum & CAGR |
Accelerate at a CAGR of 3.3% |
|
Market growth 2025-2029 |
USD 1201.3 million |
|
Market structure |
Fragmented |
|
YoY growth 2024-2025(%) |
3.1 |
|
Key countries |
UK, China, Japan, India, France, South Korea, Canada, US, Australia, and Germany |
|
Competitive landscape |
Leading Companies, Market Positioning of Companies, Competitive Strategies, and Industry Risks |
What are the Key Data Covered in this Potassium Hydroxide Market Research and Growth Report?
- CAGR of the Potassium Hydroxide industry during the forecast period
- Detailed information on factors that will drive the growth and forecasting between 2025 and 2029
- Precise estimation of the size of the market and its contribution of the industry in focus to the parent market
- Accurate predictions about upcoming growth and trends and changes in consumer behaviour
- Growth of the market across APAC, North America, Europe, South America, and Middle East and Africa
- Thorough analysis of the market's competitive landscape and detailed information about companies
- Comprehensive analysis of factors that will challenge the potassium hydroxide market growth of industry companies
We can help! Our analysts can customize this potassium hydroxide market research report to meet your requirements.
 RIA -
RIA - 
