
Predictive Maintenance (pdm) Market Analysis, Size, and Forecast 2026-2030: North America (US, Canada, and Mexico), Europe (Germany, UK, and France), APAC (China, Japan, and India), South America (Brazil, Argentina, and Chile), Middle East and Africa (Saudi Arabia, UAE, and South Africa), and Rest of World (ROW)

Predictive Maintenance (pdm) Market Analysis, Size, and Forecast 2026-2030:
North America (US, Canada, and Mexico), Europe (Germany, UK, and France), APAC (China, Japan, and India), South America (Brazil, Argentina, and Chile), Middle East and Africa (Saudi Arabia, UAE, and South Africa), and Rest of World (ROW)

Published: Oct 2026 312 Pages SKU: IRTNTR75271

Market Overview at a Glance

$43.44 B
Market Opportunity
33.2%
CAGR 2025 - 2030
37.6%
North America Growth
$7.92 B
Solutions segment 2024

Predictive Maintenance (Pdm) Market Size 2026-2030

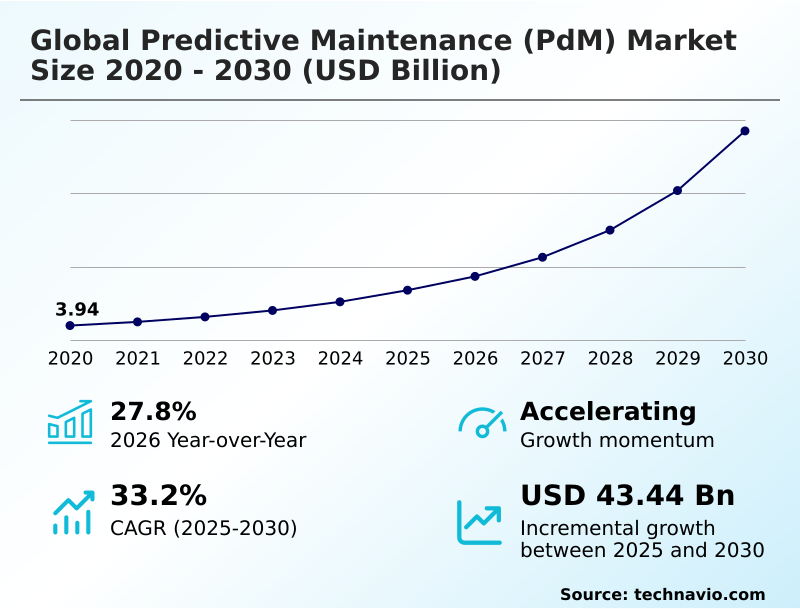
The predictive maintenance (pdm) market size is valued to increase by USD 43.44 billion, at a CAGR of 33.2% from 2025 to 2030. Rapid industrial adoption of IoTs and advanced sensor technologies will drive the predictive maintenance (pdm) market.

Major Market Trends & Insights

  • North America dominated the market and accounted for a 37.6% growth during the forecast period.
  • By Component - Solutions segment was valued at USD 7.92 billion in 2024
  • By Deployment - On-premises segment accounted for the largest market revenue share in 2024

Market Size & Forecast

  • Market Opportunities: USD 53.08 billion
  • Market Future Opportunities: USD 43.44 billion
  • CAGR from 2025 to 2030 : 33.2%

Market Summary

  • The Predictive Maintenance (pdm) is experiencing significant transformation, driven by the rapid evolution of industrial operations and the widespread adoption of digital technologies. Historically, facilities relied upon reactive strategies, resulting in unexpected breakdowns or unnecessary servicing. Today, the integration of advanced sensors and machine learning algorithms acts as a primary catalyst for expansion, enabling continuous equipment health monitoring.
  • For example, in supply chain operations, proactive monitoring of logistics fleet engines and warehouse conveyor systems allows organizations to schedule repairs during off-peak hours, optimizing resource allocation. Consequently, companies implementing these proactive frameworks have achieved a 30% reduction in unscheduled downtime compared to traditional reactive approaches.
  • However, the persistent challenge of data silos and legacy infrastructure compatibility continues to impede seamless integration. Many brownfield assets lack native digital communication interfaces, requiring complex and costly hardware retrofitting. Despite these structural hurdles, the transition toward condition-based interventions provides unprecedented operational visibility, allowing capital-intensive industries to maximize asset reliability and maintain continuous production cycles.

What will be the Size of the Predictive Maintenance (Pdm) Market during the forecast period?
Get Key Insights on Market Forecast (PDF) Get Free Sample

How is the Predictive Maintenance (Pdm) Market Segmented?

The predictive maintenance (pdm) industry research report provides comprehensive data (region-wise segment analysis), with forecasts and estimates in "USD million" for the period 2026-2030, as well as historical data from 2020-2024 for the following segments.

  • Component
    • Solutions
    • Service
  • Deployment
    • On-premises
    • Cloud
  • Technology
    • IoT
    • AI and machine learning
    • Others
  • Application
    • Condition monitoring
    • Predictive analytics
    • Remote monitoring
    • Others
  • Geography
    • North America
      • US
      • Canada
      • Mexico
    • Europe
      • Germany
      • UK
      • France
      • Italy
      • Spain
      • The Netherlands
    • APAC
      • China
      • Japan
      • India
      • South Korea
      • Australia
      • Indonesia
    • South America
      • Brazil
      • Argentina
      • Chile
    • Middle East and Africa
      • Saudi Arabia
      • UAE
      • South Africa
      • Egypt
      • Nigeria

By Component Insights

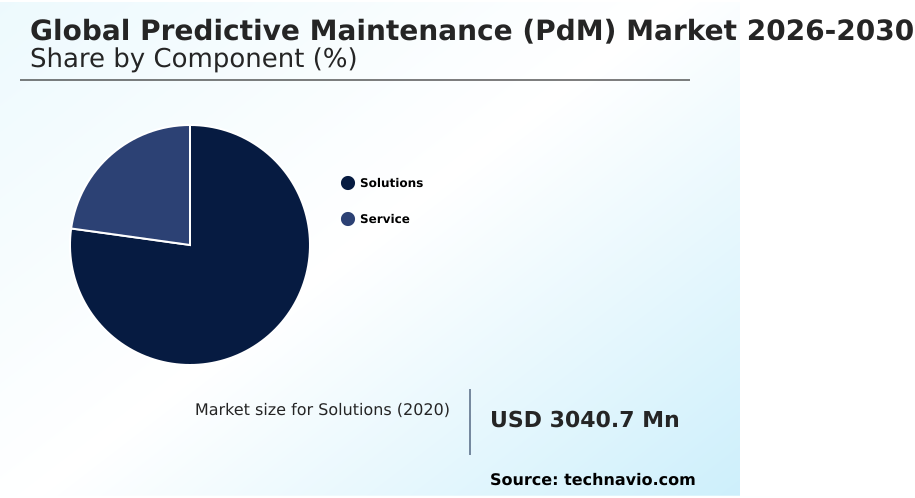
The solutions segment is estimated to witness significant growth during the forecast period.

The solutions component represents the core technological foundation of the Predictive Maintenance (pdm), encompassing integrated software packages and dedicated hardware components. This segment enables the collection, transmission, and interpretation of critical asset telemetry through sophisticated remote monitoring systems.

Modern platforms eliminate the need for complex custom integration by offering native interoperability between IoT sensors and centralized enterprise asset management architectures.

By incorporating advanced fault detection diagnostics, these systems provide contextualized reports detailing specific corrective actions rather than vague alerts. The implementation of natural language interfaces further democratizes technical insights, allowing shop-floor technicians to query equipment health directly.

Consequently, organizations utilizing these integrated packages have improved error detection by 15%, significantly enhancing spare parts optimization. This tangible return on investment solidifies the role of comprehensive software solutions in driving broader industrial digital transformation.
Get Free Sample

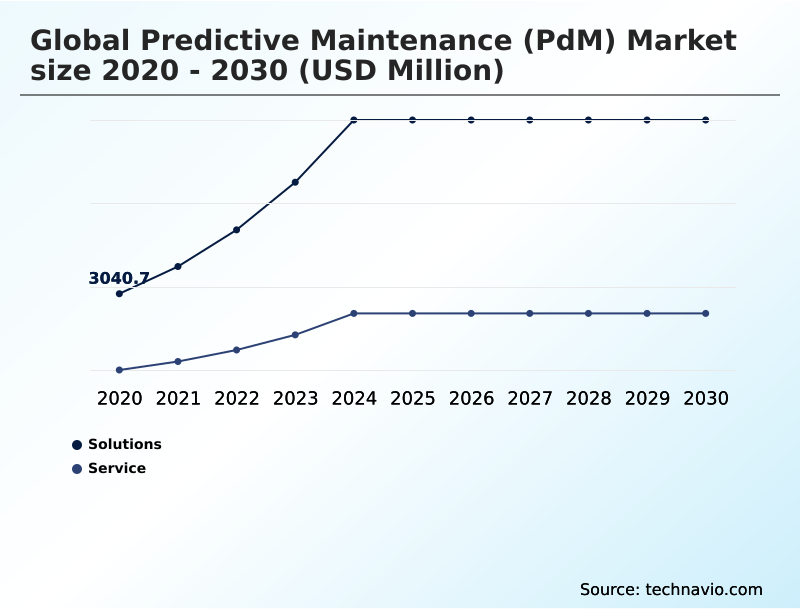
The Solutions segment was valued at USD 7.92 billion in 2024 and showed a gradual increase during the forecast period.
Get Free Sample

Regional Analysis

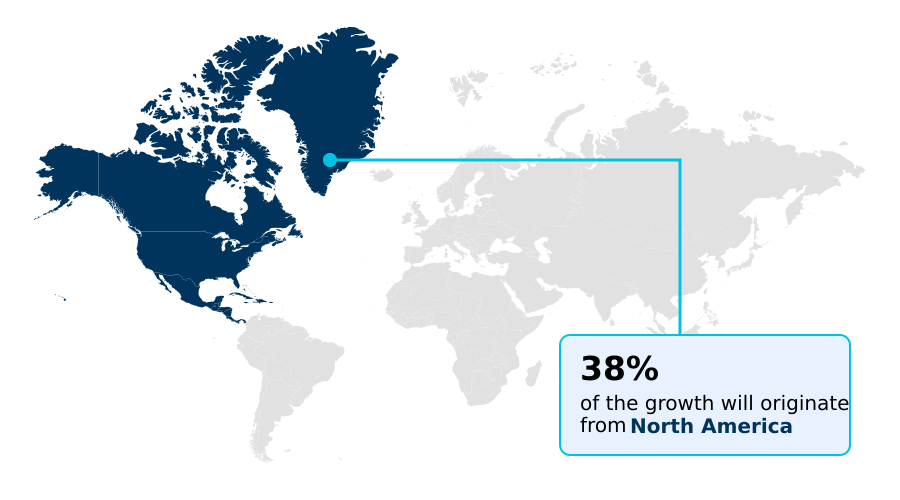
North America is estimated to contribute 37.6% to the growth of the global market during the forecast period.Technavio’s analysts have elaborately explained the regional trends and drivers that shape the market during the forecast period.
See How Predictive Maintenance (Pdm) Market Demand is Rising in North America Get Free Sample

North America represents a highly mature regional landscape for the Predictive Maintenance (pdm), characterized by the rapid adoption of Industry 4.0 principles and extensive industrial digitalization.

This region outpaces Europe in the deployment of advanced predictive analytics, driven by a massive concentration of aerospace and defense enterprises demanding high machinery reliability.

The widespread availability of high-speed telecommunications infrastructure supports the large-scale industrial gateways deployment necessary for capturing continuous telemetry data streams. By leveraging explainable artificial intelligence, North American manufacturers have improved error detection by 15% compared to their APAC counterparts.

This capability enables precise root cause analysis and facilitates real time data processing across hybrid networks. Consequently, regional enterprises successfully optimize spare parts supply chains and extend the active working life of critical infrastructure assets while maintaining strict regulatory compliance.

Market Dynamics

Our researchers analyzed the data with 2025 as the base year, along with the key drivers, trends, and challenges. A holistic analysis of drivers will help companies refine their marketing strategies to gain a competitive advantage.

  • The landscape of industrial operations is undergoing a profound shift, driven by the need to maximize asset reliability and minimize unscheduled process interruptions. At the core of this evolution is the deployment of real time equipment health monitoring, which allows plant operators to continuously observe the operational status of critical machinery.
  • By transitioning away from subjective manual inspections, organizations can establish a standardized digital foundation for their mechanical fleets. This transition is heavily supported by seamless iot sensor data analytics integration, ensuring that high-frequency physical metrics are instantly transmitted to centralized enterprise networks.
  • Within these networks, sophisticated ai driven predictive maintenance algorithms process massive datasets to identify microscopic surface wear and thermal imbalances long before physical symptoms manifest. Consequently, supply chain and operational planning teams have observed a 25% improvement in maintenance scheduling efficiency compared to traditional calendar-based servicing.
  • This enhanced visibility is further augmented by comprehensive industrial asset performance management software, which contextualizes diagnostic reports and provides prescriptive repair instructions directly to shop-floor technicians. The utilization of machine learning based anomaly detection eliminates the reliance on a small pool of specialized reliability engineers, democratizing technical insights across the organization.
  • Ultimately, these advanced frameworks empower capital-intensive industries to optimize their spare parts inventory, ensure strict regulatory compliance, and extend the active working life of heavy machinery.
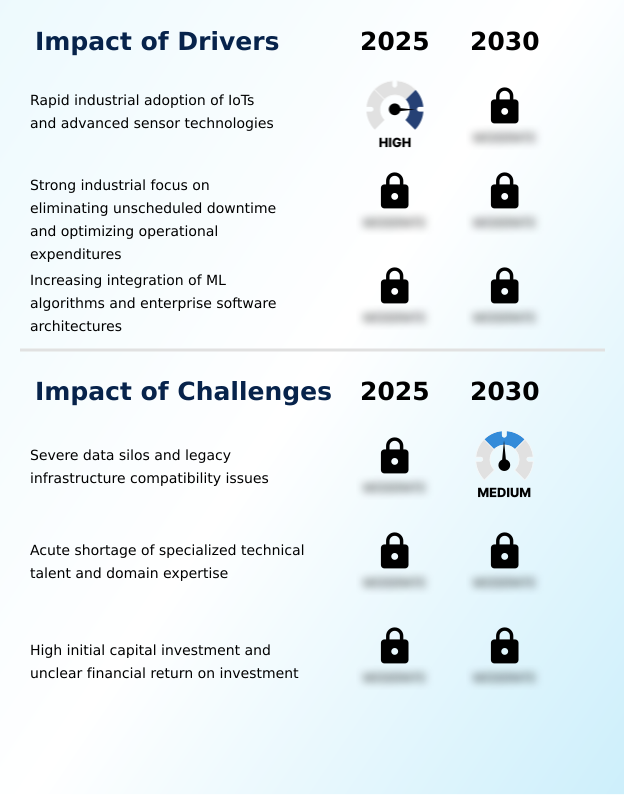
What are the key market drivers leading to the rise in the adoption of Predictive Maintenance (Pdm) Industry?

  • The rapid industrial adoption of the Internet of Things and advanced sensor technologies acts as a primary catalyst accelerating market expansion.

  • The rapid deployment of advanced sensor hardware serves as a primary catalyst for the expansion of the Predictive Maintenance (pdm) ecosystem.
  • Historically, physical asset oversight was constrained by the high cost of dedicated instrumentation, but modern facilities now seamlessly integrate acoustic transmitters and thermal cameras to capture high-fidelity operational metrics.
  • This continuous machine monitoring enables precise anomaly detection long before mechanical failures occur. By replacing subjective manual inspections with objective telemetry, plant operators can establish a standardized digital foundation for their mechanical fleets.
  • This transition directly facilitates early equipment degradation detection, allowing organizations to lower energy use by 12% and extend machinery lifespans.
  • Consequently, the widespread adoption of predictive asset management frameworks ensures that capital-intensive industries maximize operational visibility and eliminate costly process interruptions.

What are the market trends shaping the Predictive Maintenance (Pdm) Industry?

  • Massive integration of generative artificial intelligence and natural language interfaces represents a prominent trend reshaping the market landscape.

  • The integration of generative artificial intelligence is fundamentally reshaping the Predictive Maintenance (pdm) landscape across multiple sectors. By leveraging advanced machine learning algorithms and the industrial internet of things, organizations are transitioning from reactive to proactive operational strategies. Modern industrial automation systems now utilize conversational interfaces to interpret complex telemetry from vibration sensors, allowing technicians to query equipment health instantly.
  • This shift is supported by robust cloud computing infrastructure, which processes massive datasets to deliver prescriptive repair instructions. Consequently, facilities have achieved a 30% unscheduled downtime reduction, significantly enhancing overall productivity. This democratization of specialized technical data minimizes diagnostic timelines and improves first-time fix rates.
  • Ultimately, these intelligent frameworks empower enterprises to optimize resource allocation and maintain continuous production cycles efficiently.

What challenges does the Predictive Maintenance (Pdm) Industry face during its growth?

  • Severe data silos and legacy infrastructure compatibility issues remain a critical structural challenge impeding widespread market adoption.

  • A major structural hurdle impeding the Predictive Maintenance (pdm) sector is the persistent challenge of data silos and legacy infrastructure compatibility. Across major manufacturing hubs, a significant portion of operational machinery consists of brownfield assets lacking native digital communication interfaces. Extracting high-fidelity parameters for accurate condition monitoring demands substantial hardware retrofitting, which introduces considerable technical complexity.
  • Furthermore, the digital divide between shop-floor operational technology and corporate IT networks severely restricts seamless sensor data ingestion. Without unified access to historical logs and real-time metrics, tools for asset performance management struggle to establish accurate baselines, leading to elevated rates of false alarms.
  • Addressing these interoperability issues requires expensive middleware and hybrid edge cloud architectures to process complex vibration spectra analysis locally. Overcoming these integration barriers is essential, as unified systems have been shown to improve diagnostic accuracy by 18%.

Exclusive Technavio Analysis on Customer Landscape

The predictive maintenance (pdm) market forecasting report includes the adoption lifecycle of the market, covering from the innovator’s stage to the laggard’s stage. It focuses on adoption rates in different regions based on penetration. Furthermore, the predictive maintenance (pdm) market report also includes key purchase criteria and drivers of price sensitivity to help companies evaluate and develop their market growth analysis strategies.
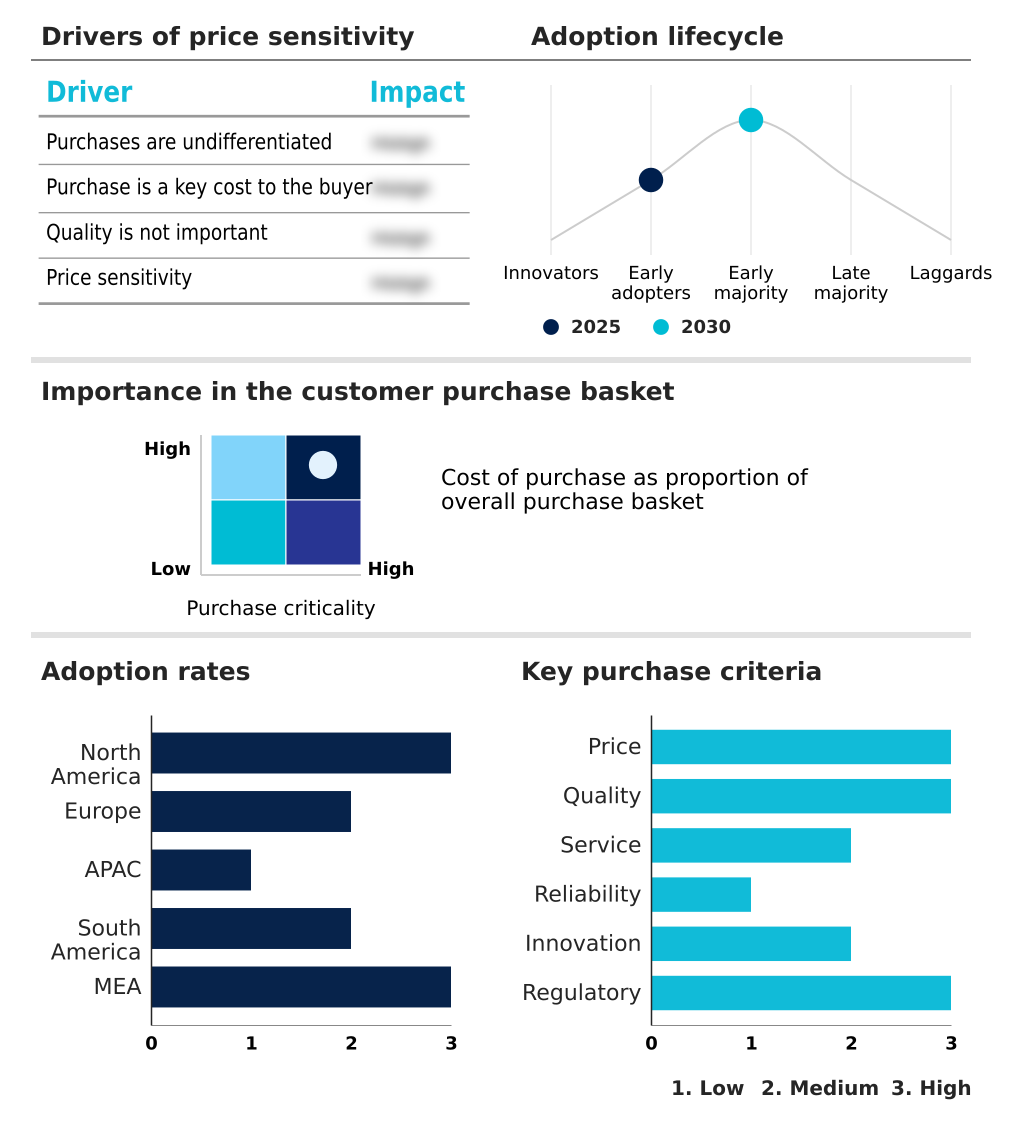
Customer Landscape of Predictive Maintenance (Pdm) Industry

Competitive Landscape

Companies are implementing various strategies, such as strategic alliances, predictive maintenance (pdm) market forecast, partnerships, mergers and acquisitions, geographical expansion, and product/service launches, to enhance their presence in the industry.

ABB Ltd. - Provides advanced asset health center and condition monitoring software to optimize machinery performance and minimize unplanned downtime across industrial operations.

The industry research and growth report includes detailed analyses of the competitive landscape of the market and information about key companies, including:

  • ABB Ltd.
  • Aspen Technology Inc.
  • Augury Inc.
  • C3.ai Inc.
  • Emerson Electric Co.
  • Fluke Corp.
  • General Electric Co.
  • Hitachi Ltd.
  • Honeywell International Inc.
  • IBM Corp.
  • PTC Inc.
  • Robert Bosch GmbH
  • Rockwell Automation Inc.
  • SAP SE
  • SAS Institute Inc.
  • Schneider Electric SE
  • Siemens AG
  • SKF AB
  • SparkCognition Inc.
  • Uptake Technologies Inc.

Qualitative and quantitative analysis of companies has been conducted to help clients understand the wider business environment as well as the strengths and weaknesses of key industry players. Data is qualitatively analyzed to categorize companies as pure play, category-focused, industry-focused, and diversified; it is quantitatively analyzed to categorize companies as dominant, leading, strong, tentative, and weak.

Recent Development and News in Predictive maintenance (pdm) market

  • In the Application Software industry, the transition toward composable enterprise architectures has accelerated the integration of modular microservices, directly impacting Predictive Maintenance (pdm) demand by enabling seamless interoperability between legacy manufacturing execution systems and modern cloud-based analytics engines.
  • The implementation of strict data privacy regulations has forced industrial organizations to adopt localized edge computing frameworks, directly increasing the requirement for secure, on-premises diagnostic solutions within the Predictive Maintenance (pdm) ecosystem.
  • The widespread shift toward subscription-based software-as-a-service delivery models has lowered initial capital expenditure barriers for small and medium enterprises, expanding the total addressable market for Predictive Maintenance (pdm) platforms across emerging industrial sectors.
  • The integration of advanced large language models into enterprise workflow automation tools has streamlined complex diagnostic queries, significantly boosting the adoption rate of natural language interfaces within Predictive Maintenance (pdm) applications.

Dive into Technavio’s robust research methodology, blending expert interviews, extensive data synthesis, and validated models for unparalleled Predictive Maintenance (Pdm) Market insights. See full methodology.

Market Scope
Page number 312
Base year 2025
Historic period 2020-2024
Forecast period 2026-2030
Growth momentum & CAGR Accelerate at a CAGR of 33.2%
Market growth 2026-2030 USD 43441.6 million
Market structure Fragmented
YoY growth 2025-2026(%) 27.8%
Key countries US, Canada, Mexico, Germany, UK, France, Italy, Spain, The Netherlands, China, Japan, India, South Korea, Australia, Indonesia, Brazil, Argentina, Chile, Saudi Arabia, UAE, South Africa, Egypt and Nigeria
Competitive landscape Leading Companies, Market Positioning of Companies, Competitive Strategies, and Industry Risks

Request Free Sample

Research Analyst Overview

  • The Predictive Maintenance (pdm) is fundamentally altering how asset-heavy enterprises approach operational resilience and infrastructure management. Organizations are increasingly abandoning traditional run-to-failure methodologies in favor of proactive, condition-based strategies fueled by the industrial internet of things. By deploying a comprehensive network of vibration sensors, acoustic transmitters, and thermal cameras, facilities capture high-fidelity telemetry directly from critical machinery.
  • This continuous stream of physical data empowers sophisticated machine learning algorithms to perform precise anomaly detection, identifying subtle mechanical deviations months before catastrophic failures occur. At the boardroom level, this transition is profoundly impacting corporate budgeting and risk management strategies.
  • Executives leveraging these automated diagnostic frameworks have successfully achieved a 30% reduction in unexpected process interruptions, significantly lowering annual operational expenditures. Furthermore, the integration of real-time monitoring ensures strict adherence to stringent occupational safety and environmental regulations.
  • As the industrial sector continues to navigate complex digital transformations, the reliance on objective, sensor-driven oversight remains an indispensable requirement for maintaining competitive advantage and maximizing overall asset reliability.

What are the Key Data Covered in this Predictive Maintenance (Pdm) Market Research and Growth Report?

  • What is the expected growth of the Predictive Maintenance (Pdm) Market between 2026 and 2030?

    • USD 43.44 billion, at a CAGR of 33.2%

  • What segmentation does the market report cover?

    • The report is segmented by Component (Solutions, and Service), Deployment (On-premises, and Cloud), Technology (IoT, AI and machine learning, and Others), Application (Condition monitoring, Predictive analytics, Remote monitoring, and Others) and Geography (North America, Europe, APAC, South America, Middle East and Africa)

  • Which regions are analyzed in the report?

    • North America, Europe, APAC, South America and Middle East and Africa

  • What are the key growth drivers and market challenges?

    • Rapid industrial adoption of IoTs and advanced sensor technologies, Severe data silos and legacy infrastructure compatibility issues

  • Who are the major players in the Predictive Maintenance (Pdm) Market?

    • ABB Ltd., Aspen Technology Inc., Augury Inc., C3.ai Inc., Emerson Electric Co., Fluke Corp., General Electric Co., Hitachi Ltd., Honeywell International Inc., IBM Corp., PTC Inc., Robert Bosch GmbH, Rockwell Automation Inc., SAP SE, SAS Institute Inc., Schneider Electric SE, Siemens AG, SKF AB, SparkCognition Inc. and Uptake Technologies Inc.

Market Research Insights

  • The Predictive Maintenance (pdm) is fundamentally reshaping how capital-intensive industries manage their critical infrastructure. By transitioning from reactive schedules to proactive strategies, organizations leverage real time data processing to capture high-fidelity operational metrics. This integration establishes a robust foundation for enterprise asset management, enabling precise anomaly detection before catastrophic failures occur.
  • Consequently, facilities utilizing these advanced frameworks have reduced operational expenditures by 12% and improved overall productivity. This continuous operational visibility facilitates enhanced spare parts optimization and minimizes costly process interruptions. Ultimately, the deployment of intelligent monitoring systems remains an indispensable component of broader industrial digital transformation, empowering enterprises to maximize asset reliability and extend machinery lifespans efficiently.

We can help! Our analysts can customize this predictive maintenance (pdm) market research report to meet your requirements.

Get in touch

1. Executive Summary

1.1 Market overview

Executive Summary - Chart on Market Overview
Executive Summary - Data Table on Market Overview
Executive Summary - Chart on Global Market Characteristics
Executive Summary - Chart on Market by Geography
Executive Summary - Chart on Market Segmentation by Component
Executive Summary - Chart on Market Segmentation by Deployment
Executive Summary - Chart on Market Segmentation by Technology
Executive Summary - Chart on Market Segmentation by Application
Executive Summary - Chart on Incremental Growth
Executive Summary - Data Table on Incremental Growth
Executive Summary - Chart on Company Market Positioning

2. Technavio Analysis

2.1 Analysis of price sensitivity, lifecycle, customer purchase basket, adoption rates, and purchase criteria

2.2 Criticality of inputs and Factors of differentiation

Chart on Overview on criticality of inputs and factors of differentiation

2.3 Factors of disruption

Chart on Overview on factors of disruption

2.4 Impact of drivers and challenges

Chart on Impact of drivers and challenges in 2025 and 2030

3. Market Landscape

3.1 Market ecosystem

Chart on Parent Market
Data Table on - Parent Market

3.2 Market characteristics

Chart on Market characteristics analysis

3.3 Value chain analysis

Chart on Value chain analysis

4. Market Sizing

4.1 Market definition

Data Table on Offerings of companies included in the market definition

4.2 Market segment analysis

Market segments

4.3 Market size 2025

4.4 Market outlook: Forecast for 2025-2030

Chart on Global - Market size and forecast 2025-2030 ($ million)
Data Table on Global - Market size and forecast 2025-2030 ($ million)
Chart on Global Market: Year-over-year growth 2025-2030 (%)
Data Table on Global Market: Year-over-year growth 2025-2030 (%)

5. Historic Market Size

5.1 Global Predictive Maintenance (PdM) Market 2020 - 2024

Historic Market Size - Data Table on Global Predictive Maintenance (PdM) Market 2020 - 2024 ($ million)

5.2 Component segment analysis 2020 - 2024

Historic Market Size - Component Segment 2020 - 2024 ($ million)

5.3 Deployment segment analysis 2020 - 2024

Historic Market Size - Deployment Segment 2020 - 2024 ($ million)

5.4 Technology segment analysis 2020 - 2024

Historic Market Size - Technology Segment 2020 - 2024 ($ million)

5.5 Application segment analysis 2020 - 2024

Historic Market Size - Application Segment 2020 - 2024 ($ million)

5.6 Geography segment analysis 2020 - 2024

Historic Market Size - Geography Segment 2020 - 2024 ($ million)

5.7 Country segment analysis 2020 - 2024

Historic Market Size - Country Segment 2020 - 2024 ($ million)

6. Qualitative Analysis

6.1 Impact of AI on global predictive maintenance (PdM) market

6.2 Impact of geopolitical conflicts on global predictive maintenance (PdM) market

7. Five Forces Analysis

7.1 Five forces summary

Five forces analysis - Comparison between 2025 and 2030

7.2 Bargaining power of buyers

Bargaining power of buyers - Impact of key factors 2025 and 2030

7.3 Bargaining power of suppliers

Bargaining power of suppliers - Impact of key factors in 2025 and 2030

7.4 Threat of new entrants

Threat of new entrants - Impact of key factors in 2025 and 2030

7.5 Threat of substitutes

Threat of substitutes - Impact of key factors in 2025 and 2030

7.6 Threat of rivalry

Threat of rivalry - Impact of key factors in 2025 and 2030

7.7 Market condition

Chart on Market condition - Five forces 2025 and 2030

8. Market Segmentation by Component

8.1 Market segments

Chart on Component - Market share 2025-2030 (%)
Data Table on Component - Market share 2025-2030 (%)

8.2 Comparison by Component

Chart on Comparison by Component
Data Table on Comparison by Component

8.3 Solutions - Market size and forecast 2025-2030

Chart on Solutions - Market size and forecast 2025-2030 ($ million)
Data Table on Solutions - Market size and forecast 2025-2030 ($ million)
Chart on Solutions - Year-over-year growth 2025-2030 (%)
Data Table on Solutions - Year-over-year growth 2025-2030 (%)

8.4 Service - Market size and forecast 2025-2030

Chart on Service - Market size and forecast 2025-2030 ($ million)
Data Table on Service - Market size and forecast 2025-2030 ($ million)
Chart on Service - Year-over-year growth 2025-2030 (%)
Data Table on Service - Year-over-year growth 2025-2030 (%)

8.5 Market opportunity by Component

Market opportunity by Component ($ million)
Data Table on Market opportunity by Component ($ million)

9. Market Segmentation by Deployment

9.1 Market segments

Chart on Deployment - Market share 2025-2030 (%)
Data Table on Deployment - Market share 2025-2030 (%)

9.2 Comparison by Deployment

Chart on Comparison by Deployment
Data Table on Comparison by Deployment

9.3 On-premises - Market size and forecast 2025-2030

Chart on On-premises - Market size and forecast 2025-2030 ($ million)
Data Table on On-premises - Market size and forecast 2025-2030 ($ million)
Chart on On-premises - Year-over-year growth 2025-2030 (%)
Data Table on On-premises - Year-over-year growth 2025-2030 (%)

9.4 Cloud - Market size and forecast 2025-2030

Chart on Cloud - Market size and forecast 2025-2030 ($ million)
Data Table on Cloud - Market size and forecast 2025-2030 ($ million)
Chart on Cloud - Year-over-year growth 2025-2030 (%)
Data Table on Cloud - Year-over-year growth 2025-2030 (%)

9.5 Market opportunity by Deployment

Market opportunity by Deployment ($ million)
Data Table on Market opportunity by Deployment ($ million)

10. Market Segmentation by Technology

10.1 Market segments

Chart on Technology - Market share 2025-2030 (%)
Data Table on Technology - Market share 2025-2030 (%)

10.2 Comparison by Technology

Chart on Comparison by Technology
Data Table on Comparison by Technology

10.3 IoT - Market size and forecast 2025-2030

Chart on IoT - Market size and forecast 2025-2030 ($ million)
Data Table on IoT - Market size and forecast 2025-2030 ($ million)
Chart on IoT - Year-over-year growth 2025-2030 (%)
Data Table on IoT - Year-over-year growth 2025-2030 (%)

10.4 AI and machine learning - Market size and forecast 2025-2030

Chart on AI and machine learning - Market size and forecast 2025-2030 ($ million)
Data Table on AI and machine learning - Market size and forecast 2025-2030 ($ million)
Chart on AI and machine learning - Year-over-year growth 2025-2030 (%)
Data Table on AI and machine learning - Year-over-year growth 2025-2030 (%)

10.5 Others - Market size and forecast 2025-2030

Chart on Others - Market size and forecast 2025-2030 ($ million)
Data Table on Others - Market size and forecast 2025-2030 ($ million)
Chart on Others - Year-over-year growth 2025-2030 (%)
Data Table on Others - Year-over-year growth 2025-2030 (%)

10.6 Market opportunity by Technology

Market opportunity by Technology ($ million)
Data Table on Market opportunity by Technology ($ million)

11. Market Segmentation by Application

11.1 Market segments

Chart on Application - Market share 2025-2030 (%)
Data Table on Application - Market share 2025-2030 (%)

11.2 Comparison by Application

Chart on Comparison by Application
Data Table on Comparison by Application

11.3 Condition monitoring - Market size and forecast 2025-2030

Chart on Condition monitoring - Market size and forecast 2025-2030 ($ million)
Data Table on Condition monitoring - Market size and forecast 2025-2030 ($ million)
Chart on Condition monitoring - Year-over-year growth 2025-2030 (%)
Data Table on Condition monitoring - Year-over-year growth 2025-2030 (%)

11.4 Predictive analytics - Market size and forecast 2025-2030

Chart on Predictive analytics - Market size and forecast 2025-2030 ($ million)
Data Table on Predictive analytics - Market size and forecast 2025-2030 ($ million)
Chart on Predictive analytics - Year-over-year growth 2025-2030 (%)
Data Table on Predictive analytics - Year-over-year growth 2025-2030 (%)

11.5 Remote monitoring - Market size and forecast 2025-2030

Chart on Remote monitoring - Market size and forecast 2025-2030 ($ million)
Data Table on Remote monitoring - Market size and forecast 2025-2030 ($ million)
Chart on Remote monitoring - Year-over-year growth 2025-2030 (%)
Data Table on Remote monitoring - Year-over-year growth 2025-2030 (%)

11.6 Others - Market size and forecast 2025-2030

Chart on Others - Market size and forecast 2025-2030 ($ million)
Data Table on Others - Market size and forecast 2025-2030 ($ million)
Chart on Others - Year-over-year growth 2025-2030 (%)
Data Table on Others - Year-over-year growth 2025-2030 (%)

11.7 Market opportunity by Application

Market opportunity by Application ($ million)
Data Table on Market opportunity by Application ($ million)

12. Customer Landscape

12.1 Customer landscape overview

Analysis of price sensitivity, lifecycle, customer purchase basket, adoption rates, and purchase criteria

13. Geographic Landscape

13.1 Geographic segmentation

Chart on Market share by geography 2025-2030 (%)
Data Table on Market share by geography 2025-2030 (%)

13.2 Geographic comparison

Chart on Geographic comparison
Data Table on Geographic comparison

13.3 North America - Market size and forecast 2025-2030

Chart on North America - Market size and forecast 2025-2030 ($ million)
Data Table on North America - Market size and forecast 2025-2030 ($ million)
Chart on North America - Year-over-year growth 2025-2030 (%)
Data Table on North America - Year-over-year growth 2025-2030 (%)
Chart on Regional Comparison - North America
Data Table on Regional Comparison - North America

13.3.1 US - Market size and forecast 2025-2030

Chart on US - Market size and forecast 2025-2030 ($ million)
Data Table on US - Market size and forecast 2025-2030 ($ million)
Chart on US - Year-over-year growth 2025-2030 (%)
Data Table on US - Year-over-year growth 2025-2030 (%)

13.3.2 Canada - Market size and forecast 2025-2030

Chart on Canada - Market size and forecast 2025-2030 ($ million)
Data Table on Canada - Market size and forecast 2025-2030 ($ million)
Chart on Canada - Year-over-year growth 2025-2030 (%)
Data Table on Canada - Year-over-year growth 2025-2030 (%)

13.3.3 Mexico - Market size and forecast 2025-2030

Chart on Mexico - Market size and forecast 2025-2030 ($ million)
Data Table on Mexico - Market size and forecast 2025-2030 ($ million)
Chart on Mexico - Year-over-year growth 2025-2030 (%)
Data Table on Mexico - Year-over-year growth 2025-2030 (%)

13.4 Europe - Market size and forecast 2025-2030

Chart on Europe - Market size and forecast 2025-2030 ($ million)
Data Table on Europe - Market size and forecast 2025-2030 ($ million)
Chart on Europe - Year-over-year growth 2025-2030 (%)
Data Table on Europe - Year-over-year growth 2025-2030 (%)
Chart on Regional Comparison - Europe
Data Table on Regional Comparison - Europe

13.4.1 Germany - Market size and forecast 2025-2030

Chart on Germany - Market size and forecast 2025-2030 ($ million)
Data Table on Germany - Market size and forecast 2025-2030 ($ million)
Chart on Germany - Year-over-year growth 2025-2030 (%)
Data Table on Germany - Year-over-year growth 2025-2030 (%)

13.4.2 UK - Market size and forecast 2025-2030

Chart on UK - Market size and forecast 2025-2030 ($ million)
Data Table on UK - Market size and forecast 2025-2030 ($ million)
Chart on UK - Year-over-year growth 2025-2030 (%)
Data Table on UK - Year-over-year growth 2025-2030 (%)

13.4.3 France - Market size and forecast 2025-2030

Chart on France - Market size and forecast 2025-2030 ($ million)
Data Table on France - Market size and forecast 2025-2030 ($ million)
Chart on France - Year-over-year growth 2025-2030 (%)
Data Table on France - Year-over-year growth 2025-2030 (%)

13.4.4 Italy - Market size and forecast 2025-2030

Chart on Italy - Market size and forecast 2025-2030 ($ million)
Data Table on Italy - Market size and forecast 2025-2030 ($ million)
Chart on Italy - Year-over-year growth 2025-2030 (%)
Data Table on Italy - Year-over-year growth 2025-2030 (%)

13.4.5 Spain - Market size and forecast 2025-2030

Chart on Spain - Market size and forecast 2025-2030 ($ million)
Data Table on Spain - Market size and forecast 2025-2030 ($ million)
Chart on Spain - Year-over-year growth 2025-2030 (%)
Data Table on Spain - Year-over-year growth 2025-2030 (%)

13.4.6 The Netherlands - Market size and forecast 2025-2030

Chart on The Netherlands - Market size and forecast 2025-2030 ($ million)
Data Table on The Netherlands - Market size and forecast 2025-2030 ($ million)
Chart on The Netherlands - Year-over-year growth 2025-2030 (%)
Data Table on The Netherlands - Year-over-year growth 2025-2030 (%)

13.5 APAC - Market size and forecast 2025-2030

Chart on APAC - Market size and forecast 2025-2030 ($ million)
Data Table on APAC - Market size and forecast 2025-2030 ($ million)
Chart on APAC - Year-over-year growth 2025-2030 (%)
Data Table on APAC - Year-over-year growth 2025-2030 (%)
Chart on Regional Comparison - APAC
Data Table on Regional Comparison - APAC

13.5.1 China - Market size and forecast 2025-2030

Chart on China - Market size and forecast 2025-2030 ($ million)
Data Table on China - Market size and forecast 2025-2030 ($ million)
Chart on China - Year-over-year growth 2025-2030 (%)
Data Table on China - Year-over-year growth 2025-2030 (%)

13.5.2 Japan - Market size and forecast 2025-2030

Chart on Japan - Market size and forecast 2025-2030 ($ million)
Data Table on Japan - Market size and forecast 2025-2030 ($ million)
Chart on Japan - Year-over-year growth 2025-2030 (%)
Data Table on Japan - Year-over-year growth 2025-2030 (%)

13.5.3 India - Market size and forecast 2025-2030

Chart on India - Market size and forecast 2025-2030 ($ million)
Data Table on India - Market size and forecast 2025-2030 ($ million)
Chart on India - Year-over-year growth 2025-2030 (%)
Data Table on India - Year-over-year growth 2025-2030 (%)

13.5.4 South Korea - Market size and forecast 2025-2030

Chart on South Korea - Market size and forecast 2025-2030 ($ million)
Data Table on South Korea - Market size and forecast 2025-2030 ($ million)
Chart on South Korea - Year-over-year growth 2025-2030 (%)
Data Table on South Korea - Year-over-year growth 2025-2030 (%)

13.5.5 Australia - Market size and forecast 2025-2030

Chart on Australia - Market size and forecast 2025-2030 ($ million)
Data Table on Australia - Market size and forecast 2025-2030 ($ million)
Chart on Australia - Year-over-year growth 2025-2030 (%)
Data Table on Australia - Year-over-year growth 2025-2030 (%)

13.5.6 Indonesia - Market size and forecast 2025-2030

Chart on Indonesia - Market size and forecast 2025-2030 ($ million)
Data Table on Indonesia - Market size and forecast 2025-2030 ($ million)
Chart on Indonesia - Year-over-year growth 2025-2030 (%)
Data Table on Indonesia - Year-over-year growth 2025-2030 (%)

13.6 South America - Market size and forecast 2025-2030

Chart on South America - Market size and forecast 2025-2030 ($ million)
Data Table on South America - Market size and forecast 2025-2030 ($ million)
Chart on South America - Year-over-year growth 2025-2030 (%)
Data Table on South America - Year-over-year growth 2025-2030 (%)
Chart on Regional Comparison - South America
Data Table on Regional Comparison - South America

13.6.1 Brazil - Market size and forecast 2025-2030

Chart on Brazil - Market size and forecast 2025-2030 ($ million)
Data Table on Brazil - Market size and forecast 2025-2030 ($ million)
Chart on Brazil - Year-over-year growth 2025-2030 (%)
Data Table on Brazil - Year-over-year growth 2025-2030 (%)

13.6.2 Argentina - Market size and forecast 2025-2030

Chart on Argentina - Market size and forecast 2025-2030 ($ million)
Data Table on Argentina - Market size and forecast 2025-2030 ($ million)
Chart on Argentina - Year-over-year growth 2025-2030 (%)
Data Table on Argentina - Year-over-year growth 2025-2030 (%)

13.6.3 Chile - Market size and forecast 2025-2030

Chart on Chile - Market size and forecast 2025-2030 ($ million)
Data Table on Chile - Market size and forecast 2025-2030 ($ million)
Chart on Chile - Year-over-year growth 2025-2030 (%)
Data Table on Chile - Year-over-year growth 2025-2030 (%)

13.7 Middle East and Africa - Market size and forecast 2025-2030

Chart on Middle East and Africa - Market size and forecast 2025-2030 ($ million)
Data Table on Middle East and Africa - Market size and forecast 2025-2030 ($ million)
Chart on Middle East and Africa - Year-over-year growth 2025-2030 (%)
Data Table on Middle East and Africa - Year-over-year growth 2025-2030 (%)
Chart on Regional Comparison - Middle East and Africa
Data Table on Regional Comparison - Middle East and Africa

13.7.1 Saudi Arabia - Market size and forecast 2025-2030

Chart on Saudi Arabia - Market size and forecast 2025-2030 ($ million)
Data Table on Saudi Arabia - Market size and forecast 2025-2030 ($ million)
Chart on Saudi Arabia - Year-over-year growth 2025-2030 (%)
Data Table on Saudi Arabia - Year-over-year growth 2025-2030 (%)

13.7.2 UAE - Market size and forecast 2025-2030

Chart on UAE - Market size and forecast 2025-2030 ($ million)
Data Table on UAE - Market size and forecast 2025-2030 ($ million)
Chart on UAE - Year-over-year growth 2025-2030 (%)
Data Table on UAE - Year-over-year growth 2025-2030 (%)

13.7.3 South Africa - Market size and forecast 2025-2030

Chart on South Africa - Market size and forecast 2025-2030 ($ million)
Data Table on South Africa - Market size and forecast 2025-2030 ($ million)
Chart on South Africa - Year-over-year growth 2025-2030 (%)
Data Table on South Africa - Year-over-year growth 2025-2030 (%)

13.7.4 Egypt - Market size and forecast 2025-2030

Chart on Egypt - Market size and forecast 2025-2030 ($ million)
Data Table on Egypt - Market size and forecast 2025-2030 ($ million)
Chart on Egypt - Year-over-year growth 2025-2030 (%)
Data Table on Egypt - Year-over-year growth 2025-2030 (%)

13.7.5 Nigeria - Market size and forecast 2025-2030

Chart on Nigeria - Market size and forecast 2025-2030 ($ million)
Data Table on Nigeria - Market size and forecast 2025-2030 ($ million)
Chart on Nigeria - Year-over-year growth 2025-2030 (%)
Data Table on Nigeria - Year-over-year growth 2025-2030 (%)

13.8 Market opportunity by geography

Market opportunity by geography ($ million)
Data Tables on Market opportunity by geography ($ million)

14. Drivers, Challenges, and Opportunity

14.1 Market drivers

Rapid industrial adoption of IoTs and advanced sensor technologies
Strong industrial focus on eliminating unscheduled downtime and optimizing operational expenditures
Increasing integration of ML algorithms and enterprise software architectures

14.2 Market challenges

Severe data silos and legacy infrastructure compatibility issues
Acute shortage of specialized technical talent and domain expertise
High initial capital investment and unclear financial return on investment

14.3 Impact of drivers and challenges

Impact of drivers and challenges in 2025 and 2030

14.4 Market opportunities

Massive integration of Gen AI and natural language interfaces
Proliferation of virtual and soft sensor architectures
Rapid transition of national infrastructure operations toward predictive asset management frameworks

15. Competitive Landscape

15.1 Overview

15.2

Overview on criticality of inputs and factors of differentiation

15.3 Landscape disruption

Overview on factors of disruption

15.4 Industry risks

Impact of key risks on business

16. Competitive Analysis

16.1 Companies profiled

Companies covered

16.2 Company ranking index

16.3 Market positioning of companies

Matrix on companies position and classification

16.4 ABB Ltd.

ABB Ltd. - Overview
ABB Ltd. - Business segments
ABB Ltd. - Key news
ABB Ltd. - Key offerings
ABB Ltd. - Segment focus
SWOT

16.5 C3.ai Inc.

C3.ai Inc. - Overview
C3.ai Inc. - Product / Service
C3.ai Inc. - Key news
C3.ai Inc. - Key offerings
SWOT

16.6 Emerson Electric Co.

Emerson Electric Co. - Overview
Emerson Electric Co. - Business segments
Emerson Electric Co. - Key news
Emerson Electric Co. - Key offerings
Emerson Electric Co. - Segment focus
SWOT

16.7 General Electric Co.

General Electric Co. - Overview
General Electric Co. - Business segments
General Electric Co. - Key offerings
General Electric Co. - Segment focus
SWOT

16.8 Hitachi Ltd.

Hitachi Ltd. - Overview
Hitachi Ltd. - Business segments
Hitachi Ltd. - Key offerings
Hitachi Ltd. - Segment focus
SWOT

16.9 Honeywell International Inc.

Honeywell International Inc. - Overview
Honeywell International Inc. - Business segments
Honeywell International Inc. - Key news
Honeywell International Inc. - Key offerings
Honeywell International Inc. - Segment focus
SWOT

16.10 IBM Corp.

IBM Corp. - Overview
IBM Corp. - Business segments
IBM Corp. - Key news
IBM Corp. - Key offerings
IBM Corp. - Segment focus
SWOT

16.11 PTC Inc.

PTC Inc. - Overview
PTC Inc. - Business segments
PTC Inc. - Key news
PTC Inc. - Key offerings
PTC Inc. - Segment focus
SWOT

16.12 Robert Bosch GmbH

Robert Bosch GmbH - Overview
Robert Bosch GmbH - Product / Service
Robert Bosch GmbH - Key offerings
SWOT

16.13 Rockwell Automation Inc.

Rockwell Automation Inc. - Overview
Rockwell Automation Inc. - Business segments
Rockwell Automation Inc. - Key news
Rockwell Automation Inc. - Key offerings
Rockwell Automation Inc. - Segment focus
SWOT

16.14 SAP SE

SAP SE - Overview
SAP SE - Business segments
SAP SE - Key news
SAP SE - Key offerings
SAP SE - Segment focus
SWOT

16.15 SAS Institute Inc.

SAS Institute Inc. - Overview
SAS Institute Inc. - Product / Service
SAS Institute Inc. - Key offerings
SWOT

16.16 Schneider Electric SE

Schneider Electric SE - Overview
Schneider Electric SE - Business segments
Schneider Electric SE - Key news
Schneider Electric SE - Key offerings
Schneider Electric SE - Segment focus
SWOT

16.17 Siemens AG

Siemens AG - Overview
Siemens AG - Business segments
Siemens AG - Key news
Siemens AG - Key offerings
Siemens AG - Segment focus
SWOT

16.18 SKF AB

SKF AB - Overview
SKF AB - Business segments
SKF AB - Key offerings
SKF AB - Segment focus
SWOT

17. Appendix

17.1 Scope of the report

Market definition
Objectives
Notes and caveats

17.2 Inclusions and exclusions checklist

Inclusions checklist
Exclusions checklist

17.3 Currency conversion rates for US$

17.4 Research methodology

17.5 Data procurement

Information sources

17.6 Data validation

17.7 Validation techniques employed for market sizing

17.8 Data synthesis

17.9 360 degree market analysis

17.10 List of abbreviations

Research Methodology

Technavio presents a detailed picture of the market by way of study, synthesis, and summation of data from multiple sources. The analysts have presented the various facets of the market with a particular focus on identifying the key industry influencers. The data thus presented is comprehensive, reliable, and the result of extensive research, both primary and secondary.

INFORMATION SOURCES

Primary sources

  • Manufacturers and suppliers
  • Channel partners
  • Industry experts
  • Strategic decision makers

Secondary sources

  • Industry journals and periodicals
  • Government data
  • Financial reports of key industry players
  • Historical data
  • Press releases

DATA ANALYSIS

Data Synthesis

  • Collation of data
  • Estimation of key figures
  • Analysis of derived insights

Data Validation

  • Triangulation with data models
  • Reference against proprietary databases
  • Corroboration with industry experts

REPORT WRITING

Qualitative

  • Market drivers
  • Market challenges
  • Market trends
  • Five forces analysis

Quantitative

  • Market size and forecast
  • Market segmentation
  • Geographical insights
  • Competitive landscape

Interested in this report?

Get your sample now to see our research methodology and insights!

Download Now

Frequently Asked Questions

Predictive Maintenance (Pdm) market growth will increase by USD 43441.6 million during 2026-2030.

The Predictive Maintenance (Pdm) market is expected to grow at a CAGR of 33.2% during 2026-2030.

Predictive Maintenance (Pdm) market is segmented by Component (Solutions, Service) Deployment (On-premises, Cloud) Technology (IoT, AI and machine learning, Others) Application (Condition monitoring, Predictive analytics, Remote monitoring, Others)

ABB Ltd., Aspen Technology Inc., Augury Inc., C3.ai Inc., Emerson Electric Co., Fluke Corp., General Electric Co., Hitachi Ltd., Honeywell International Inc., IBM Corp., PTC Inc., Robert Bosch GmbH, Rockwell Automation Inc., SAP SE, SAS Institute Inc., Schneider Electric SE, Siemens AG, SKF AB, SparkCognition Inc., Uptake Technologies Inc. are a few of the key vendors in the Predictive Maintenance (Pdm) market.

North America will register the highest growth rate of 37.6% among the other regions. Therefore, the Predictive Maintenance (Pdm) market in North America is expected to garner significant business opportunities for the vendors during the forecast period.

US, Canada, Mexico, Germany, UK, France, Italy, Spain, The Netherlands, China, Japan, India, South Korea, Australia, Indonesia, Brazil, Argentina, Chile, Saudi Arabia, UAE, South Africa, Egypt, Nigeria

  • Rapid industrial adoption of IoTs and advanced sensor technologies is the driving factor this market.

The Predictive Maintenance (Pdm) market vendors should focus on grabbing business opportunities from the Component segment as it accounted for the largest market share in the base year.
RIA - Research AI Assistant
Ask RIA