
Print On Demand Market Size 2026-2030
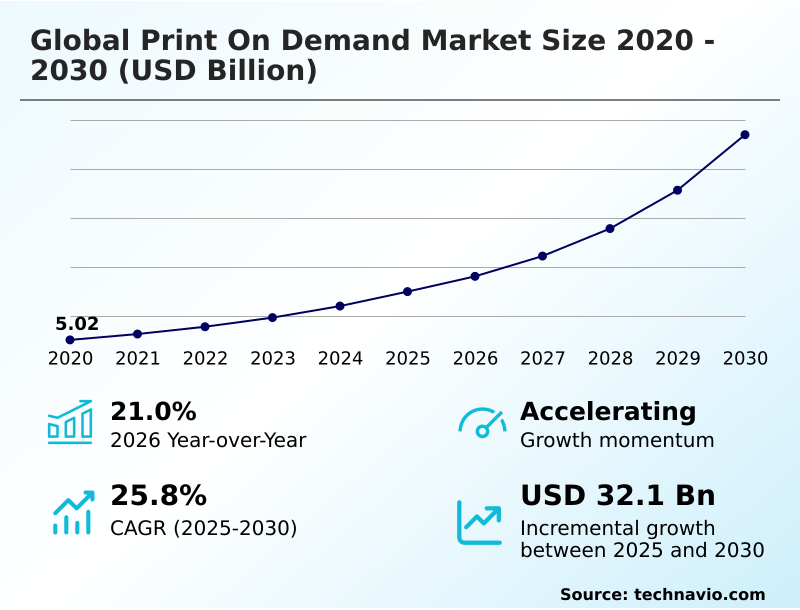
The print on demand market size is valued to increase by USD 32.10 billion, at a CAGR of 25.8% from 2025 to 2030. Symbiotic growth of ecommerce platforms and creator economy will drive the print on demand market.
Major Market Trends & Insights
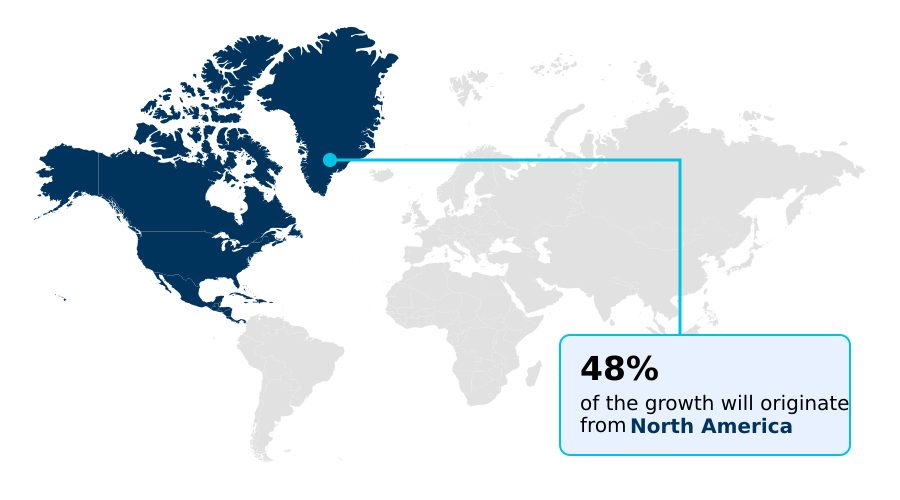
- North America dominated the market and accounted for a 48.2% growth during the forecast period.
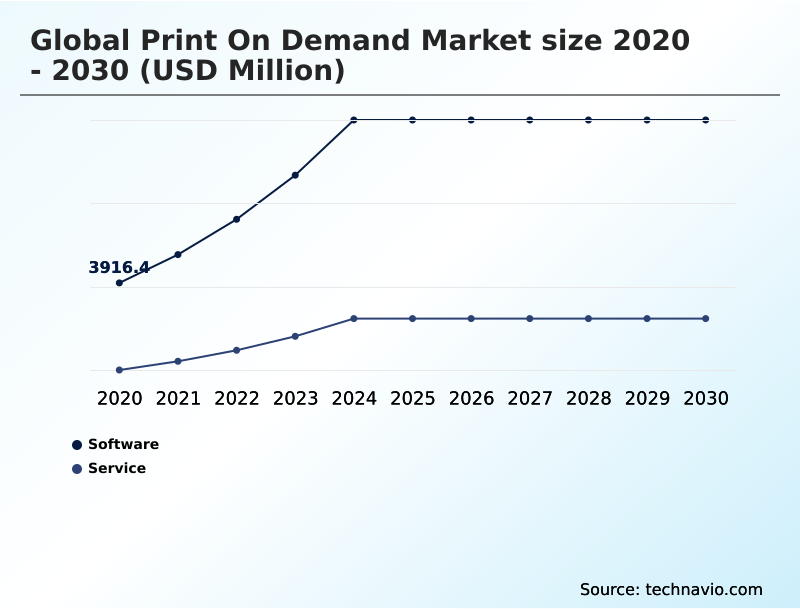
- By Platform - Software segment was valued at USD 9.17 billion in 2024
- By Product - Apparel segment accounted for the largest market revenue share in 2024
Market Size & Forecast
- Market Opportunities: USD 41.97 billion
- Market Future Opportunities: USD 32.10 billion
- CAGR from 2025 to 2030 : 25.8%
Market Summary
- The print on demand market operates on an inventory-free retail model where products are created only after a customer places an order. This structure fundamentally mitigates financial risk for entrepreneurs and creators, making it a cornerstone of the digital creator economy.
- Growth is propelled by advancements in digital printing technology and the seamless integration of fulfillment services with major e-commerce platforms. This allows a diverse range of participants, from individual artists to established brands, to offer customized goods without investment in stock. However, the industry faces persistent challenges in maintaining consistent quality and color fidelity across disparate global fulfillment centers.
- A business scenario illustrating this involves a creator launching a new apparel line; their brand reputation is entirely dependent on the third-party provider's ability to consistently execute high-quality printing and rapid delivery.
- As the market matures, the competitive edge is shifting towards platforms that can guarantee reliability, offer unique product catalogs, and align with growing consumer demand for sustainable and ethically produced goods, pushing operators to innovate beyond basic fulfillment.
What will be the Size of the Print On Demand Market during the forecast period?
Get Key Insights on Market Forecast (PDF) Get Free Sample
How is the Print On Demand Market Segmented?
The print on demand industry research report provides comprehensive data (region-wise segment analysis), with forecasts and estimates in "USD million" for the period 2026-2030, as well as historical data from 2020-2024 for the following segments.
- Platform
- Software
- Service
- Product
- Apparel
- Home decor
- Drinkware
- Others
- Channel
- D2C
- Marketplace
- Geography
- North America
- US
- Canada
- Mexico
- Europe
- UK
- Germany
- France
- APAC
- China
- India
- Japan
- South America
- Brazil
- Argentina
- Colombia
- Middle East and Africa
- UAE
- Saudi Arabia
- South Africa
- Rest of World (ROW)
- North America
By Platform Insights
The software segment is estimated to witness significant growth during the forecast period.
The software segment is the technological core of the print on demand market, comprising digital tools that facilitate the entire value chain.
A sophisticated api-driven workflow and robust e-commerce platform integration are critical, allowing for the automatic transfer of order data. This includes customer-facing design tools and advanced mockup generation software, empowering sellers to create and visualize products through a web-to-print storefront.
These systems are essential for a user-generated design platform, offering deep product personalization engine capabilities for customer-centric customization.
Behind the scenes, seamless supply chain integration with enterprise resource planning integration is vital for managing operations, enabling an 18% improvement in order processing accuracy for businesses leveraging this turnkey merchandise solution alongside other small business e-commerce tools.
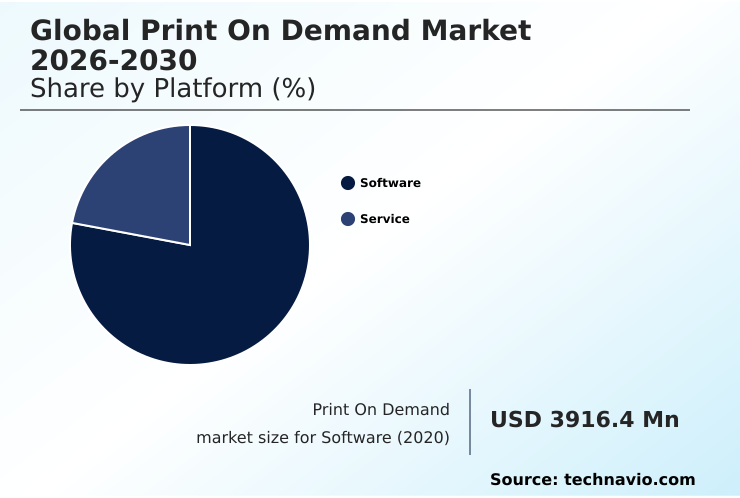
The Software segment was valued at USD 9.17 billion in 2024 and showed a gradual increase during the forecast period.
Regional Analysis
North America is estimated to contribute 48.2% to the growth of the global market during the forecast period.Technavio’s analysts have elaborately explained the regional trends and drivers that shape the market during the forecast period.
See How Print On Demand Market Demand is Rising in North America Get Free Sample
The geographic landscape of the print on demand market is led by North America, which drives nearly 48% of the industry's incremental growth, fueled by a mature e-commerce ecosystem and high consumer demand for personalized product fulfillment.
Europe follows, representing a significant 23% of the market opportunity, with strong adoption in countries like the UK and Germany. The APAC region is a rapidly emerging force, with digital printing technology adoption on the rise.
A key enabler across all regions is the development of a global fulfillment network that relies on sophisticated supply chain logistics and a distributed print provider network.
This infrastructure supports white-label dropshipping and allows an on-demand merchandise platform to offer custom product manufacturing with localized, efficient delivery, supporting the growth of the direct-to-consumer sales channel for digital artist merchandise.
Market Dynamics
Our researchers analyzed the data with 2025 as the base year, along with the key drivers, trends, and challenges. A holistic analysis of drivers will help companies refine their marketing strategies to gain a competitive advantage.
- Strategic success in the modern retail landscape increasingly involves leveraging specialized fulfillment models. For online sellers, understanding how to start print on demand for artists and designers is a critical first step. Many are integrating print on demand with shopify or using print on demand for etsy sellers to tap into existing marketplaces.
- As the market matures, a key differentiator is offering sustainable print on demand services and eco-friendly print on demand products. Operationally, this requires mastering automated apparel fulfillment solutions and sophisticated global print on demand logistics. Firms leveraging integrated logistics achieve fulfillment times that are twice as fast as those managing disparate systems.
- The quality of direct to garment printing quality and the efficiency of managing returns in print on demand are crucial for customer retention. Businesses are also exploring white label print on demand for brands and print on demand for corporate merchandise. For publishers, print on demand book publishing remains a vital segment.
- Entrepreneurs must navigate complexities such as print on demand tax and vat rules while finding a niche for print on demand. The choice between print on demand vs bulk ordering depends on capital and risk tolerance.
- Advanced sellers are now using AI for print on demand designs, creating custom packaging for print on demand, and partnering with high-quality print on demand companies to scale their print on demand business, particularly in categories like the best print on demand for home decor.
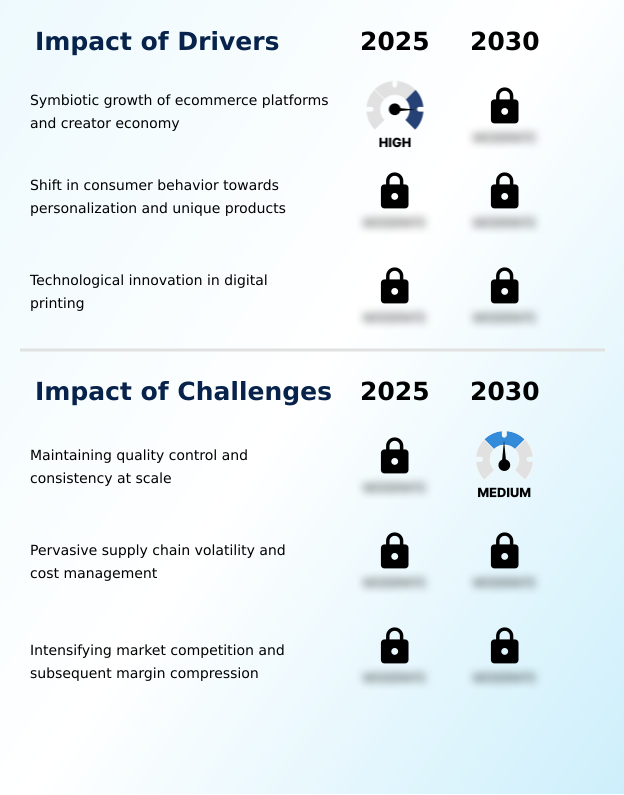
What are the key market drivers leading to the rise in the adoption of Print On Demand Industry?
- The symbiotic growth of e-commerce platforms and the creator economy serves as a primary driver, lowering entry barriers for entrepreneurs and fueling demand for custom merchandise.
- The market's expansion is fundamentally driven by the inventory-free retail model, which facilitates online retail entrepreneurship by removing significant upfront capital risk.
- This model is perfectly aligned with the growth of creator economy monetization, where merchandise sales now account for up to 30% of total revenue for top creators.
- Advanced dropship automation and social commerce integration enable content creator merchandise to be sold directly to fans. This symbiotic relationship has lowered the barrier to entry for over 2 million new digital creators.
- The ecosystem is supported by robust fulfillment network automation, which handles everything from direct-to-garment printing to merchandise fulfillment.
- The availability of a custom packaging solution further empowers a brand monetization platform, allowing creators to use social media creator tools to build and scale their businesses with minimal operational overhead and risk-free inventory management.
What are the market trends shaping the Print On Demand Industry?
- A defining trend is the ascendancy of sustainable and ethical production practices, which are becoming a core strategic imperative driven by consumer and regulatory demands.
- A dominant trend reshaping the market is the strategic shift toward ethical manufacturing and sustainable production practices, driven by heightened consumer awareness. Over 65% of consumers now indicate a preference for sustainably sourced goods, compelling providers to adapt their base product sourcing. This involves expanding catalogs to include eco-friendly product sourcing options and utilizing eco-friendly printing inks.
- Leading firms are investing in localized production hubs and distributed printing services to shorten supply chains; this strategy of localized routing reduces shipping distances by up to 40%. The adoption of technologies like direct-to-film printing and all-over-print sublimation on recycled materials further supports this trend.
- For b2b print on demand clients, a transparent and sustainable global logistics network managed by a third-party print provider is becoming a key vendor selection criterion.
What challenges does the Print On Demand Industry face during its growth?
- Maintaining stringent quality control and product consistency at scale across a distributed global production network remains a significant operational challenge for the industry.
- A primary challenge is ensuring quality and consistency across a distributed on-demand manufacturing network, where quality inconsistencies can lead to return rates exceeding 15% for complex products. Scaling operations without a robust production management platform can increase production error rates by 25%.
- Key operational hurdles include maintaining precise color fidelity calibration across different machines and executing a stringent quality control protocol. The effectiveness of the order routing algorithm is critical for balancing load and optimizing for cross-border e-commerce fulfillment.
- Managing the print queue management and batch processing system for scalable merchandise production without compromising on automated product creation quality is a constant struggle. For merchants, this lack of direct oversight means relying on the automated fulfillment service for everything, including private label shipping, which makes finding a reliable partner for niche market product creation paramount.
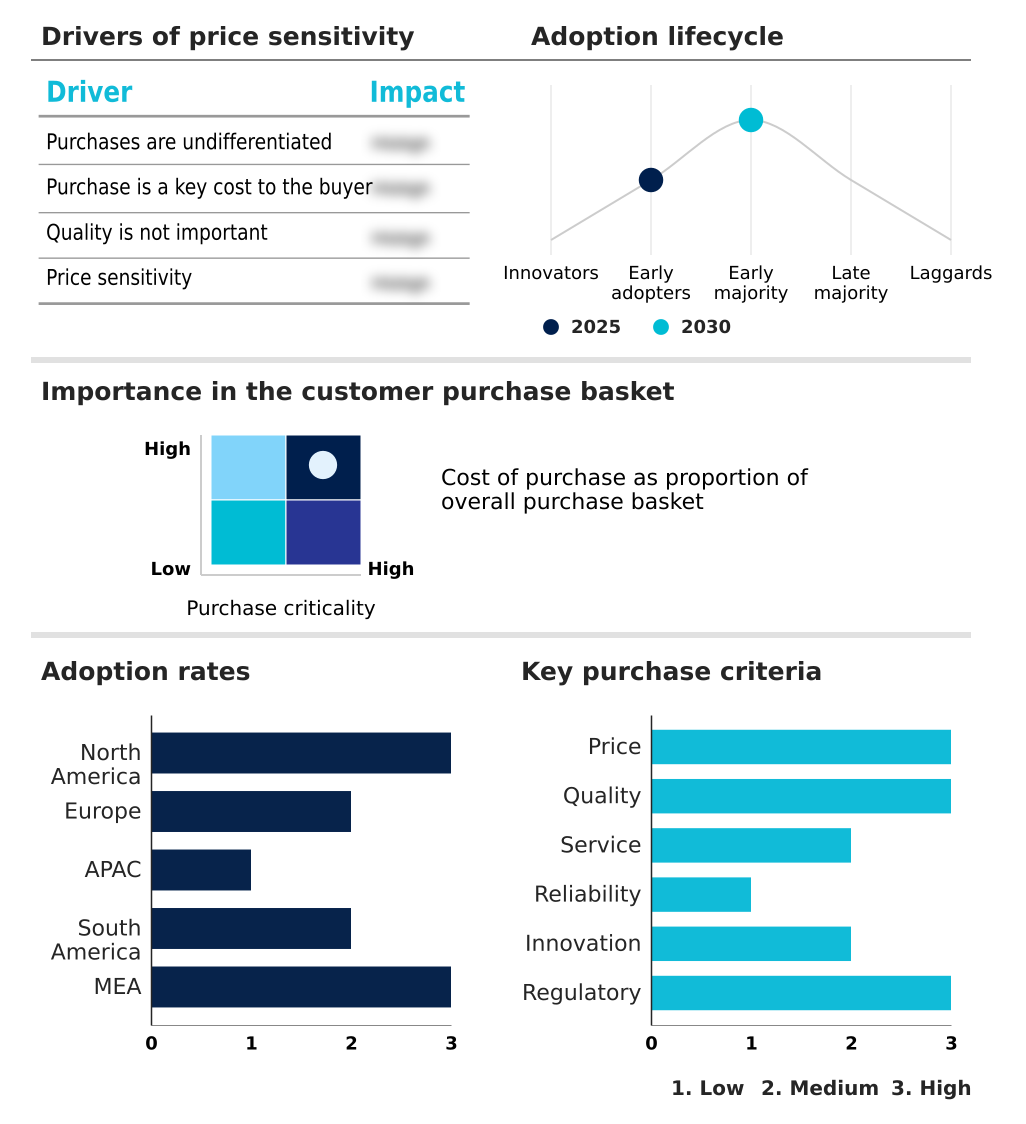
Exclusive Technavio Analysis on Customer Landscape
The print on demand market forecasting report includes the adoption lifecycle of the market, covering from the innovator’s stage to the laggard’s stage. It focuses on adoption rates in different regions based on penetration. Furthermore, the print on demand market report also includes key purchase criteria and drivers of price sensitivity to help companies evaluate and develop their market growth analysis strategies.
Customer Landscape of Print On Demand Industry
Competitive Landscape
Companies are implementing various strategies, such as strategic alliances, print on demand market forecast, partnerships, mergers and acquisitions, geographical expansion, and product/service launches, to enhance their presence in the industry.
Amazon.com Inc. - Providers offer comprehensive on-demand manufacturing and fulfillment, including custom apparel, accessories, and home décor, supported by integrated design tools and automated services for e-commerce.
The industry research and growth report includes detailed analyses of the competitive landscape of the market and information about key companies, including:
- Amazon.com Inc.
- Apliiq
- Blurb Inc.
- Breakout Commerce Inc.
- CafePress Inc.
- Cimpress Plc
- CustomCat
- Gelato ASA
- imINDY LLC
- Ingram Content Group
- Lulu Press Inc.
- Printful Inc.
- Printify Inc.
- Prodigi Group Ltd.
- Society6 LLC
- Spreadshirt Print on Demand GmbH
- Springs service
- T POP
- Threadless LLC
- Zazzle Inc.
Qualitative and quantitative analysis of companies has been conducted to help clients understand the wider business environment as well as the strengths and weaknesses of key industry players. Data is qualitatively analyzed to categorize companies as pure play, category-focused, industry-focused, and diversified; it is quantitatively analyzed to categorize companies as dominant, leading, strong, tentative, and weak.
Recent Development and News in Print on demand market
- In May, 2025, Gelato released a major update to its GelatoConnect platform, introducing 149 new features to enhance automation and scalability for creators and print providers, including advanced web-to-print storefront integrations.
- In March, 2025, Printify launched a comprehensive sustainability program, introducing a curated collection of eco-friendly products and optimizing logistics for localized production to reduce the carbon footprint of orders.
- In February, 2025, the social media platform Verve formed a strategic partnership with Oakhaven Printworks to launch Verve MerchDirect, embedding a full suite of merchandise design, sales, and analytics tools directly into its platform for creators.
- In November, 2024, Printful Inc. and Printify Inc. announced their intention to merge, a move signaling major consolidation to combine in-house production with an extensive third-party partner network for a more comprehensive global service.
Dive into Technavio’s robust research methodology, blending expert interviews, extensive data synthesis, and validated models for unparalleled Print On Demand Market insights. See full methodology.
| Market Scope | |
|---|---|
| Page number | 281 |
| Base year | 2025 |
| Historic period | 2020-2024 |
| Forecast period | 2026-2030 |
| Growth momentum & CAGR | Accelerate at a CAGR of 25.8% |
| Market growth 2026-2030 | USD 32095.9 million |
| Market structure | Fragmented |
| YoY growth 2025-2026(%) | 21.0% |
| Key countries | US, Canada, Mexico, UK, Germany, France, Italy, Spain, The Netherlands, China, India, Japan, South Korea, Australia, Indonesia, Brazil, Argentina, Colombia, UAE, Saudi Arabia, South Africa, Turkey and Egypt |
| Competitive landscape | Leading Companies, Market Positioning of Companies, Competitive Strategies, and Industry Risks |
Research Analyst Overview
- The print on demand market is defined by its continuous evolution, driven by technological integration and the expansion of the creator economy. Its core value proposition, an inventory-free retail model, has democratized e-commerce, but success now hinges on advanced operational capabilities. Boardroom decisions are increasingly focused on supply chain resilience and ethical sourcing, reflecting a market-wide shift.
- For instance, companies adopting localized production hubs have not only improved delivery speeds but have also seen a 20% reduction in their associated carbon footprint, addressing both logistical challenges and ESG mandates. This strategic pivot toward sustainability is no longer a niche advantage but a critical component for maintaining market relevance.
- The underlying digital printing technology continues to advance, enabling higher quality and a wider array of customizable products. As a result, the competitive landscape favors providers that can offer a trifecta of technological sophistication, scalable and reliable global fulfillment, and a commitment to transparent, sustainable practices.
What are the Key Data Covered in this Print On Demand Market Research and Growth Report?
-
What is the expected growth of the Print On Demand Market between 2026 and 2030?
-
USD 32.10 billion, at a CAGR of 25.8%
-
-
What segmentation does the market report cover?
-
The report is segmented by Platform (Software, and Service), Product (Apparel, Home decor, Drinkware, and Others), Channel (D2C, and Marketplace) and Geography (North America, Europe, APAC, South America, Middle East and Africa)
-
-
Which regions are analyzed in the report?
-
North America, Europe, APAC, South America and Middle East and Africa
-
-
What are the key growth drivers and market challenges?
-
Symbiotic growth of ecommerce platforms and creator economy, Maintaining quality control and consistency at scale
-
-
Who are the major players in the Print On Demand Market?
-
Amazon.com Inc., Apliiq, Blurb Inc., Breakout Commerce Inc., CafePress Inc., Cimpress Plc, CustomCat, Gelato ASA, imINDY LLC, Ingram Content Group, Lulu Press Inc., Printful Inc., Printify Inc., Prodigi Group Ltd., Society6 LLC, Spreadshirt Print on Demand GmbH, Springs service, T POP, Threadless LLC and Zazzle Inc.
-
Market Research Insights
- The print on demand market is characterized by rapid evolution, driven by technological advancements and shifting consumer expectations for personalization. The integration of AI-driven design tools can accelerate new product creation by up to 50%, allowing merchants to respond quickly to emerging trends.
- Platforms offering seamless and robust API integrations report up to 35% higher merchant retention rates compared to those with more cumbersome manual processes. This efficiency is critical as the market expands into new product categories beyond apparel.
- The ability to provide a frictionless experience, from design to delivery, while ensuring consistent quality across a global network, is what now separates market leaders from followers. This dynamic environment rewards agility and investment in the underlying technology that powers the entire ecosystem.
We can help! Our analysts can customize this print on demand market research report to meet your requirements.
 RIA -
RIA - 
