Propolis Market Analysis, Size, and Forecast 2025-2029: North America (US and Canada), Europe (France, Germany, Italy, Spain, and UK), APAC (China, India, and Japan), and Rest of World (ROW)

Propolis Market Analysis, Size, and Forecast 2025-2029:
North America (US and Canada), Europe (France, Germany, Italy, Spain, and UK), APAC (China, India, and Japan), and Rest of World (ROW)

Published: May 2025 222 Pages SKU: IRTNTR71788

Market Overview at a Glance

$135 Mn
Market Opportunity
3.3%
CAGR
3.2
YoY growth 2024-2025(%)

Propolis Market Size 2025-2029

The propolis market size is forecast to increase by USD 135 million, at a CAGR of 3.3% between 2024 and 2029.

  • The market is driven by the growing recognition of its health benefits, primarily as a natural antioxidant and antimicrobial agent. This has led to an increase in research activities aimed at enhancing propolis production in beehives to meet rising demand. However, a significant challenge facing the market is the declining number of honey bee colonies, which may impact the availability and sustainability of propolis supply. This trend necessitates the adoption of innovative beekeeping practices and the exploration of alternative sources to ensure a steady supply of propolis.
  • Companies seeking to capitalize on market opportunities should focus on developing value-added propolis products and establishing strategic partnerships with beekeepers and research institutions. Effective navigation of these challenges requires a deep understanding of market dynamics, consumer preferences, and regulatory requirements.

What will be the Size of the Propolis Market during the forecast period?

Propolis Market Size

Explore in-depth regional segment analysis with market size data - historical 2019-2023 and forecasts 2025-2029 - in the full report.  
Request Free Sample

The market continues to evolve, driven by ongoing research and development in various sectors. Propolis, a resin-like substance collected by bees from tree buds, bark, or other botanical sources, is known for its antioxidant activity and diverse bioactive compounds, including flavonoids, phenolic acids, and phenolic esters. These compounds contribute to propolis' antiviral, antifungal, antibacterial, antioxidant, anti-inflammatory, and wound healing properties. Standardization of propolis is a critical aspect of the market, ensuring consistent total phenolic content and bioactive compound profiles. Extraction methods, such as water, ethanol, and supercritical CO2, influence the chemical composition and quality of propolis extracts. Regulatory compliance and safety assessment are essential considerations for propolis products, which are available in various dosage forms, including tinctures, capsules, ointments, and topical applications.

Consumer products, such as propolis lozenges, lip balms, and sprays, offer convenience and versatility. However, potential adverse effects and allergic reactions necessitate careful quality control and ethical sourcing. Ongoing clinical trials explore the therapeutic potential of propolis in drug delivery systems, pharmacokinetic studies, and wound healing applications. HPLC analysis and GC-MS provide valuable insights into the complex chemical composition of propolis, contributing to its continued market growth and dynamism.

How is this Propolis Industry segmented?

The propolis industry research report provides comprehensive data (region-wise segment analysis), with forecasts and estimates in "USD million" for the period 2025-2029, as well as historical data from 2019-2023 for the following segments.

  • Application
    • Healthcare
    • Personal care and cosmetics
    • Food and beverages
  • Distribution Channel
    • Offline
    • Online
  • Product Type
    • Capsules and tablets
    • Liquids
    • Creams
    • Sprays
    • Others
  • Geography
    • North America
      • US
      • Canada
    • Europe
      • France
      • Germany
      • Italy
      • Spain
      • UK
    • APAC
      • China
      • India
      • Japan
    • Rest of World (ROW)

By Application Insights

The healthcare segment is estimated to witness significant growth during the forecast period.

Propolis, a natural resin produced by honey bees, is renowned for its antioxidant, antiviral, antifungal, and antibacterial properties. Derived from various plants and buds, this complex mixture of resin, wax, essential oils, pollens, and minerals is widely used in the healthcare industry for developing new drugs. Propolis drugs, available in the market, are utilized to treat ailments such as diabetes, throat cancer, oral health issues, and tuberculosis. Companies like NaturaNectar provide standardized propolis supplements with added vitamin and vitamin C, enhancing their bioavailability through bioflavonoids. Extraction methods, such as water, ethanol, and supercritical CO2, are employed to obtain raw propolis, which is then standardized to ensure consistent quality.

Propolis extracts undergo HPLC analysis to determine their total phenolic content and bioactive compounds, including phenolic acids and flavonoids. Propolis products are available in various dosage forms, including capsules, creams, ointments, sprays, lozenges, and lip balms, catering to diverse consumer preferences and applications. Despite its numerous benefits, propolis may cause allergic reactions in some individuals. Adherence to regulatory compliance and ethical sourcing is crucial to ensure product safety and efficacy. Propolis's chemical composition and storage conditions significantly impact its shelf life and potency. Ongoing research explores propolis's potential in wound healing, drug delivery systems, and clinical trials.

Propolis Market Size

Request Free Sample

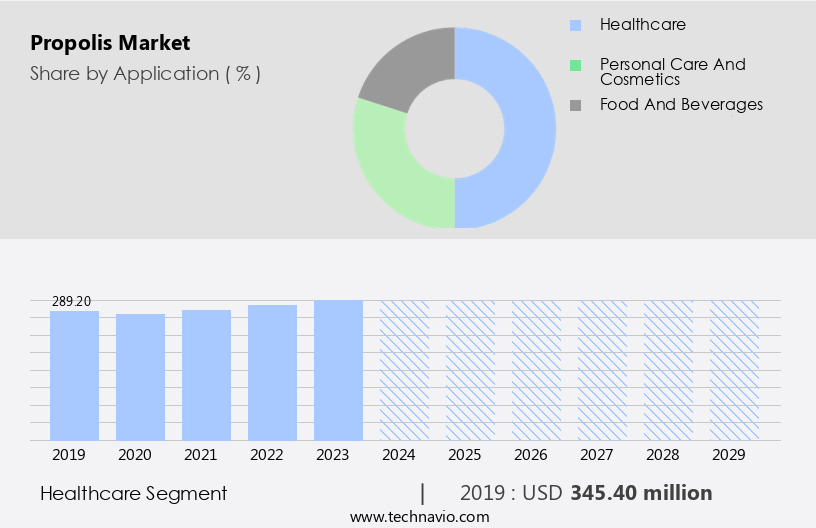
The Healthcare segment was valued at USD 345.40 million in 2019 and showed a gradual increase during the forecast period.

Regional Analysis

North America is estimated to contribute 37% to the growth of the global market during the forecast period. Technavio's analysts have elaborately explained the regional trends and drivers that shape the market during the forecast period.

Propolis Market Share by Geography

 Request Free Sample

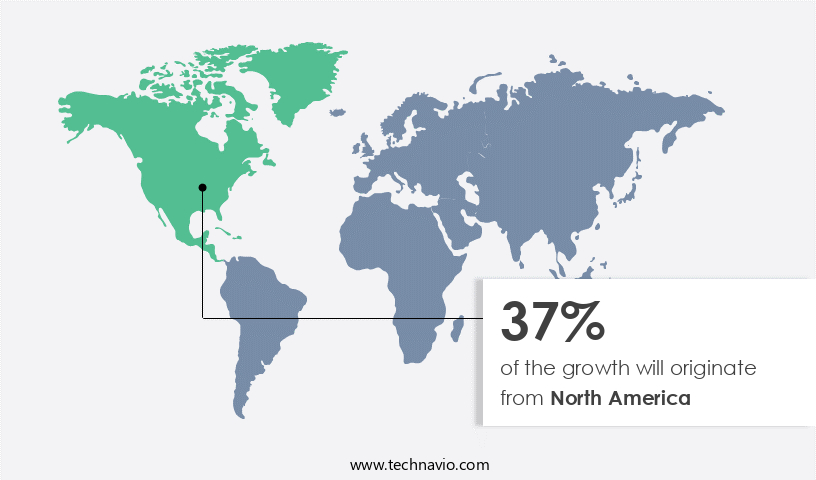
The North American market for propolis, a resin-like substance collected by bees, is experiencing growth due to the increasing number of honey bee colonies in countries like the US, Canada, and Mexico. According to the US Department of Agriculture, the total number of bee colonies for operations in the US reached approximately 2.7 million as of January 2024. This growth in bee populations is anticipated to boost the supply of raw propolis, which is used in various industries, including healthcare, personal care and cosmetics, and food and beverages. Propolis is known for its antioxidant activity, antiviral and antifungal properties, and anti-inflammatory effects.

It contains flavonoids, phenolic acids, and other bioactive compounds, making it a valuable ingredient in health supplements, topical applications, and food products. The extraction methods, such as water, ethanol, and supercritical CO2, are crucial in ensuring standardization and maintaining the chemical composition of propolis. Quality control measures and regulatory compliance are essential to ensure the safety and efficacy of propolis products. Despite its numerous benefits, adverse effects, such as allergic reactions, may occur in some individuals. Propolis is used in various dosage forms, including capsules, creams, ointments, sprays, lozenges, and tinctures. Propolis extracts undergo HPLC analysis to determine their total phenolic content and bioactive compounds.

Clinical trials have shown propolis to be effective in wound healing and drug delivery systems. Propolis's geographical origin and ethical sourcing are also essential factors in its market value. Propolis resin, royal jelly, and bee propolis are other related products with similar properties and uses. The shelf life and storage conditions of propolis products must be carefully managed to preserve their quality.

Market Dynamics

Our researchers analyzed the data with 2024 as the base year, along with the key drivers, trends, and challenges. A holistic analysis of drivers will help companies refine their marketing strategies to gain a competitive advantage.

The propolis market is flourishing due to the versatile applications of propolis, a natural resin collected by bees, valued for its antibacterial properties, anti-inflammatory effects, antioxidant benefits, antiviral properties, and therapeutic efficacy. Products like raw propolis, propolis extract, propolis capsules, propolis tablets, propolis tinctures, propolis sprays, propolis creams, propolis ointments, propolis powder, alcohol-free propolis, propolis lozenges, propolis gummies, propolis-based supplements, and organic propolis cater to diverse needs in healthcare, pharmaceuticals, cosmetics and personal care, food and beverages, dietary supplements, veterinary medicine, traditional medicine, apitherapy, nutraceuticals, and natural health products.

These are used in skincare products, hair care products, oral care products, functional foods, pharmaceutical formulations, wound healing treatments, respiratory health products, veterinary care products, anti-acne treatments, cancer treatment support, cold sore remedies, dental care products, and food preservatives.Specialized equipment like extraction reactors, supercritical CO2 extractors, filtration systems, mixing and blending units, spray dryers, freeze dryers, encapsulation machines, quality testing equipment, packaging machinery, beekeeping harvesting tools, homogenizers, and sterilization equipment ensures efficient production, aligning with the market's focus on immune system support and skin health improvement.

What are the key market drivers leading to the rise in the adoption of Propolis Industry?

  • The significant health benefits associated with propolis consumption serve as the primary driver for the market's growth. 
  • Propolis, a resin-like substance produced by bees, is renowned for its diverse health benefits due to its anti-viral, antifungal, antibacterial, and anti-inflammatory properties. These properties make propolis an essential component in various consumer products. Propolis extracts, obtained through methods such as ethanol extraction or HPLC analysis, are used in healthcare applications. Propolis tincture, another form of propolis extract, is commonly used for oral applications. The botanical origin of propolis varies, with different types derived from various plant sources. Quality control is crucial in the production of propolis products to ensure their efficacy and safety. Adverse effects of propolis consumption are minimal but may include allergic reactions in some individuals.
  • Propolis has numerous health benefits. Diabetic individuals may experience improved blood sugar levels by consuming propolis. Cold sores can be alleviated by applying propolis-based ointments. Propolis creams are effective in preventing skin infections and treating minor burns. Periodontitis, a common gum disease, can be controlled using propolis extract solutions. Additionally, propolis consumption is believed to enhance the immune response, prevent inflammation, and offer protection against infections, nose and throat cancer, intestinal disorders, ulcers, and tuberculosis. Proper storage conditions are essential to maintain the chemical composition and efficacy of propolis products. Despite its numerous benefits, it is important to consult a healthcare professional before using propolis for medicinal purposes.

What are the market trends shaping the Propolis Industry?

  • The trend in the market is toward heightened research efforts to boost propolis production in beehives. This increase in research activities is a significant development in the beekeeping industry.
  • Propolis, a resinous substance collected by bees from various tree buds and poplar sap, has gained significant attention due to its potential health benefits. Ethically sourced propolis is primarily produced by bees for use in their hives to protect against intruders and seal cracks. The geographical origin of propolis can influence its chemical composition, particularly the phenolic acid content, which is responsible for its antibacterial properties. Researchers have conducted numerous studies to assess the safety and efficacy of propolis. Toxicity studies have shown that propolis is generally safe for human use, with minimal side effects.
  • Pharmacokinetic studies have provided insights into how propolis is absorbed, distributed, metabolized, and excreted in the body. Propolis is available in various forms, including ointment, cream, and capsules, for therapeutic use. Propolis ointment and cream are commonly used topically for wound healing and infection prevention, while propolis capsules are taken orally for various health conditions. The shelf life of propolis products depends on their formulation and storage conditions. Despite the growing interest in propolis, further research is required to fully understand its mechanisms of action, optimal dosages, and long-term safety. Ongoing studies aim to enhance the production of propolis through innovative collection methods and breeding practices.
  • For instance, a study conducted between 2022 and 2023 in Egypt evaluated the effectiveness of different honey bee races and collection traps in enhancing propolis production. The results demonstrated that fiber mesh sheets were the most effective collection method, yielding an average of 14 grams of propolis per hive per year.

What challenges does the Propolis Industry face during its growth?

  • The decline in the number of honey bee colonies poses a significant challenge to the growth of the industry. This trend is a major concern for beekeepers and agricultural sectors that rely on honey bees for pollination and honey production. The health and survival of honey bee colonies are crucial for maintaining the sustainability and productivity of various agricultural systems. Consequently, ongoing research and initiatives are essential to address the root causes of colony decline and promote the health and resilience of honey bee populations. 
  • Propolis, a resin-like substance produced by honey bees, has gained significant attention in the global market due to its potential health benefits. The standardization of propolis is a critical aspect of its production and utilization, ensuring consistent total phenolic content and bioactive compounds. Clinical trials have shown propolis to be effective in wound healing and can be used in topical applications. Advancements in technology, such as supercritical CO2 extraction and GC-MS analysis, have improved the production and quality of propolis. These methods help preserve the natural compounds and enhance the therapeutic properties of propolis. Drug delivery systems, including propolis lozenges, offer an alternative method for consuming propolis as dietary supplements.
  • However, potential allergic reactions are a concern, and further research is needed to understand their prevalence and severity. The market for propolis is expected to grow as more research is conducted on its bioactive compounds and their potential applications. The use of propolis in various industries, such as pharmaceuticals and cosmetics, is also expanding. In conclusion, the standardization of propolis, advancements in production methods, and ongoing clinical trials are driving the growth of the market. Its potential applications in wound healing, drug delivery systems, and various industries offer significant opportunities for innovation and development.

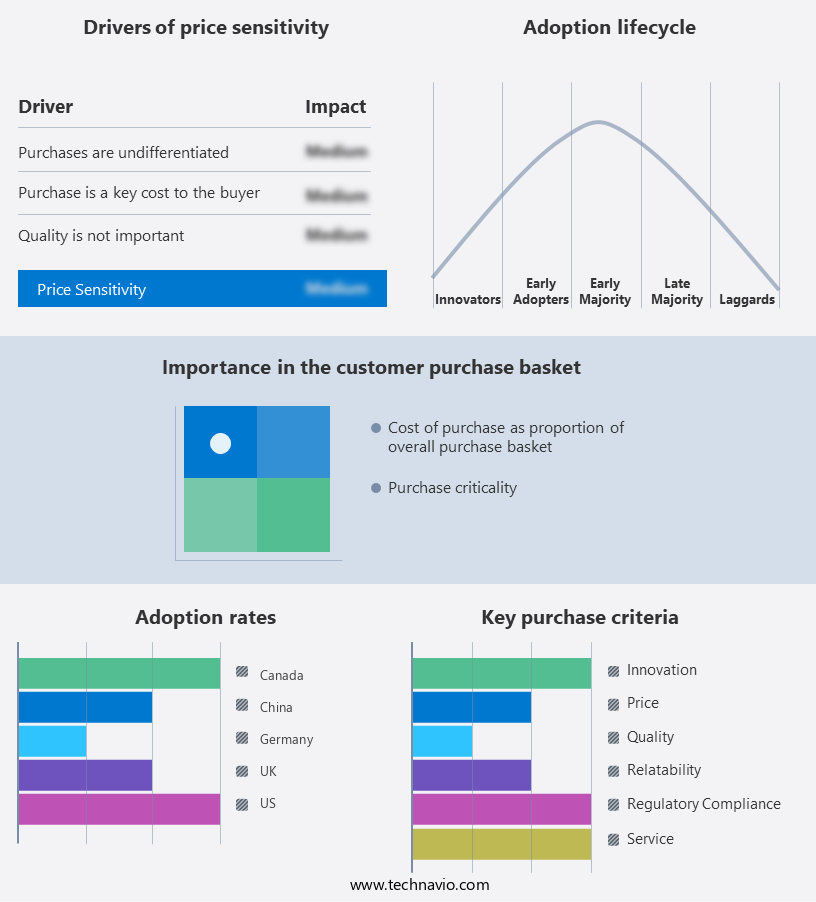
Exclusive Customer Landscape

The propolis market forecasting report includes the adoption lifecycle of the market, covering from the innovator's stage to the laggard's stage. It focuses on adoption rates in different regions based on penetration. Furthermore, the propolis market report also includes key purchase criteria and drivers of price sensitivity to help companies evaluate and develop their market growth analysis strategies.

Propolis Market Share by Geography

 Customer Landscape

Key Companies & Market Insights

Companies are implementing various strategies, such as strategic alliances, propolis market forecast, partnerships, mergers and acquisitions, geographical expansion, and product/service launches, to enhance their presence in the industry.

Apis Flora Industrial e Comercial Ltda. - This company specializes in the production and distribution of propolis extracts, including the popular Green Extract 70. 

The industry research and growth report includes detailed analyses of the competitive landscape of the market and information about key companies, including:

  • Apis Flora Industrial e Comercial Ltda.
  • Associated British Foods Plc
  • Bio Botanica Inc.
  • Comvita Ltd.
  • Country Life Vitamins LLC
  • Herb Pharm
  • Hi Tech Natural Products India Ltd.
  • iHerb LLC
  • INW Manufacturing LLC
  • Laprell Beehive Products Inc.
  • Manuka Health New Zealand Ltd.
  • Natural Factors Nutritional Products Ltd.
  • NaturaNectar LLC
  • Natures Goodness Australia Pty Ltd
  • NOW Foods
  • Nutraceutical Corp.
  • Sunyata Productos Alternativos Ltda.
  • Uniflora Nutraceutica Ltda.
  • Wax Green USA
  • YS Organic Bee Farms

Qualitative and quantitative analysis of companies has been conducted to help clients understand the wider business environment as well as the strengths and weaknesses of key industry players. Data is qualitatively analyzed to categorize companies as pure play, category-focused, industry-focused, and diversified; it is quantitatively analyzed to categorize companies as dominant, leading, strong, tentative, and weak.

Recent Development and News in Propolis Market

  • In January 2024, Propolis Health Sciences, a leading propolis extract manufacturer, announced the launch of their new product line, Propolis Plus, which includes a proprietary blend of propolis extract and vitamin C, aimed at boosting immune system function (Propolis Health Sciences Press Release).
  • In March 2024, Propolis Extraction Technologies (PET), a major propolis extract producer, entered into a strategic partnership with BioMedical Research Laboratories (BML), a leading biotech company, to develop and commercialize new propolis-based pharmaceutical products (PET Press Release).
  • In July 2024, the market Leader, a significant market player, raised USD30 million in a Series C funding round, led by New York-based investment firm, Greenfield Partners, to expand its production capacity and accelerate research and development efforts (Crunchbase).
  • In May 2025, the European Food Safety Authority (EFSA) granted a health claim for propolis, recognizing its antioxidant properties and potential role in supporting the immune system, marking a significant regulatory milestone for the market (EFSA Press Release).

Research Analyst Overview

  • Propolis, a natural resin produced by bees, has gained significant attention in the health and wellness industry due to its antimicrobial, antioxidant, and anti-inflammatory properties. The market for propolis-based products continues to evolve, with an increasing focus on quality assurance and standardization. Propropalis microcapsules and propolis-enriched foods are popular forms of consumption, undergoing rigorous statistical analysis and human clinical trials to evaluate their efficacy and safety. In vitro studies and animal models are used to assess the antimicrobial activity and antioxidant capacity assays of propolis-based formulations. Product testing, including ABTS assay, DPPH assay, and ORAC assay, provides valuable data for market trends.
  • Propolis resinoids, emulsions, powders, and granules are also gaining traction, with regional market differences influencing consumer preferences. Side effect monitoring and adverse event reporting are crucial components of product development, ensuring the safety and efficacy of propolis-infused products. Double-blind trials and placebo-controlled studies are essential for data interpretation and validating the benefits of propolis. Overall, the global market for propolis continues to grow, driven by scientific research and consumer demand for natural health solutions.

Dive into Technavio's robust research methodology, blending expert interviews, extensive data synthesis, and validated models for unparalleled Propolis Market insights. See full methodology.

Market Scope

Report Coverage

Details

Page number

222

Base year

2024

Historic period

2019-2023

Forecast period

2025-2029

Growth momentum & CAGR

Accelerate at a CAGR of 3.3%

Market growth 2025-2029

USD 135 million

Market structure

Fragmented

YoY growth 2024-2025(%)

3.2

Key countries

US, UK, Germany, Canada, China, France, Italy, Spain, Japan, and India

Competitive landscape

Leading Companies, Market Positioning of Companies, Competitive Strategies, and Industry Risks

Request Free Sample

What are the Key Data Covered in this Propolis Market Research and Growth Report?

  • CAGR of the Propolis industry during the forecast period
  • Detailed information on factors that will drive the growth and forecasting between 2025 and 2029
  • Precise estimation of the size of the market and its contribution of the industry in focus to the parent market
  • Accurate predictions about upcoming growth and trends and changes in consumer behaviour
  • Growth of the market across North America, Europe, APAC, South America, and Middle East and Africa
  • Thorough analysis of the market's competitive landscape and detailed information about companies
  • Comprehensive analysis of factors that will challenge the propolis market growth of industry companies

We can help! Our analysts can customize this propolis market research report to meet your requirements.

Get in touch

1 Executive Summary

  • 1.1 Market overview
    • Executive Summary - Chart on Market Overview
    • Executive Summary - Data Table on Market Overview
    • Executive Summary - Chart on Global Market Characteristics
    • Executive Summary - Chart on Market by Geography
    • Executive Summary - Chart on Market Segmentation by Application
    • Executive Summary - Chart on Market Segmentation by Distribution Channel
    • Executive Summary - Chart on Market Segmentation by Product Type
    • Executive Summary - Chart on Incremental Growth
    • Executive Summary - Data Table on Incremental Growth
    • Executive Summary - Chart on Company Market Positioning

2 Technavio Analysis

  • 2.1 Analysis of price sensitivity, lifecycle, customer purchase basket, adoption rates, and purchase criteria
    • Analysis of price sensitivity, lifecycle, customer purchase basket, adoption rates, and purchase criteria
  • 2.2 Criticality of inputs and Factors of differentiation
    • Overview on criticality of inputs and factors of differentiation
  • 2.3 Factors of disruption
    • Overview on factors of disruption
  • 2.4 Impact of drivers and challenges
    • Impact of drivers and challenges in 2024 and 2029

3 Market Landscape

  • 3.1 Market ecosystem
    • Parent Market
    • Data Table on - Parent Market
  • 3.2 Market characteristics
    • Market characteristics analysis
  • 3.3 Value chain analysis
    • Value chain analysis

4 Market Sizing

  • 4.1 Market definition
    • Offerings of companies included in the market definition
  • 4.2 Market segment analysis
    • Market segments
  • 4.3 Market size 2024
    • 4.4 Market outlook: Forecast for 2024-2029
      • Chart on Global - Market size and forecast 2024-2029 ($ million)
      • Data Table on Global - Market size and forecast 2024-2029 ($ million)
      • Chart on Global Market: Year-over-year growth 2024-2029 (%)
      • Data Table on Global Market: Year-over-year growth 2024-2029 (%)

    5 Historic Market Size

    • 5.1 Global Propolis Market 2019 - 2023
      • Historic Market Size - Data Table on Global Propolis Market 2019 - 2023 ($ million)
    • 5.2 Application segment analysis 2019 - 2023
      • Historic Market Size - Application Segment 2019 - 2023 ($ million)
    • 5.3 Distribution Channel segment analysis 2019 - 2023
      • Historic Market Size - Distribution Channel Segment 2019 - 2023 ($ million)
    • 5.4 Product Type segment analysis 2019 - 2023
      • Historic Market Size - Product Type Segment 2019 - 2023 ($ million)
    • 5.5 Geography segment analysis 2019 - 2023
      • Historic Market Size - Geography Segment 2019 - 2023 ($ million)
    • 5.6 Country segment analysis 2019 - 2023
      • Historic Market Size - Country Segment 2019 - 2023 ($ million)

    6 Qualitative Analysis

    • 6.1 Impact of AI on Global Propolis Market

      7 Five Forces Analysis

      • 7.1 Five forces summary
        • Five forces analysis - Comparison between 2024 and 2029
      • 7.2 Bargaining power of buyers
        • Bargaining power of buyers - Impact of key factors 2024 and 2029
      • 7.3 Bargaining power of suppliers
        • Bargaining power of suppliers - Impact of key factors in 2024 and 2029
      • 7.4 Threat of new entrants
        • Threat of new entrants - Impact of key factors in 2024 and 2029
      • 7.5 Threat of substitutes
        • Threat of substitutes - Impact of key factors in 2024 and 2029
      • 7.6 Threat of rivalry
        • Threat of rivalry - Impact of key factors in 2024 and 2029
      • 7.7 Market condition
        • Chart on Market condition - Five forces 2024 and 2029

      8 Market Segmentation by Application

      • 8.1 Market segments
        • Chart on Application - Market share 2024-2029 (%)
        • Data Table on Application - Market share 2024-2029 (%)
      • 8.2 Comparison by Application
        • Chart on Comparison by Application
        • Data Table on Comparison by Application
      • 8.3 Healthcare - Market size and forecast 2024-2029
        • Chart on Healthcare - Market size and forecast 2024-2029 ($ million)
        • Data Table on Healthcare - Market size and forecast 2024-2029 ($ million)
        • Chart on Healthcare - Year-over-year growth 2024-2029 (%)
        • Data Table on Healthcare - Year-over-year growth 2024-2029 (%)
      • 8.4 Personal care and cosmetics - Market size and forecast 2024-2029
        • Chart on Personal care and cosmetics - Market size and forecast 2024-2029 ($ million)
        • Data Table on Personal care and cosmetics - Market size and forecast 2024-2029 ($ million)
        • Chart on Personal care and cosmetics - Year-over-year growth 2024-2029 (%)
        • Data Table on Personal care and cosmetics - Year-over-year growth 2024-2029 (%)
      • 8.5 Food and beverages - Market size and forecast 2024-2029
        • Chart on Food and beverages - Market size and forecast 2024-2029 ($ million)
        • Data Table on Food and beverages - Market size and forecast 2024-2029 ($ million)
        • Chart on Food and beverages - Year-over-year growth 2024-2029 (%)
        • Data Table on Food and beverages - Year-over-year growth 2024-2029 (%)
      • 8.6 Market opportunity by Application
        • Market opportunity by Application ($ million)
        • Data Table on Market opportunity by Application ($ million)

      9 Market Segmentation by Distribution Channel

      • 9.1 Market segments
        • Chart on Distribution Channel - Market share 2024-2029 (%)
        • Data Table on Distribution Channel - Market share 2024-2029 (%)
      • 9.2 Comparison by Distribution Channel
        • Chart on Comparison by Distribution Channel
        • Data Table on Comparison by Distribution Channel
      • 9.3 Offline - Market size and forecast 2024-2029
        • Chart on Offline - Market size and forecast 2024-2029 ($ million)
        • Data Table on Offline - Market size and forecast 2024-2029 ($ million)
        • Chart on Offline - Year-over-year growth 2024-2029 (%)
        • Data Table on Offline - Year-over-year growth 2024-2029 (%)
      • 9.4 Online - Market size and forecast 2024-2029
        • Chart on Online - Market size and forecast 2024-2029 ($ million)
        • Data Table on Online - Market size and forecast 2024-2029 ($ million)
        • Chart on Online - Year-over-year growth 2024-2029 (%)
        • Data Table on Online - Year-over-year growth 2024-2029 (%)
      • 9.5 Market opportunity by Distribution Channel
        • Market opportunity by Distribution Channel ($ million)
        • Data Table on Market opportunity by Distribution Channel ($ million)

      10 Market Segmentation by Product Type

      • 10.1 Market segments
        • Chart on Product Type - Market share 2024-2029 (%)
        • Data Table on Product Type - Market share 2024-2029 (%)
      • 10.2 Comparison by Product Type
        • Chart on Comparison by Product Type
        • Data Table on Comparison by Product Type
      • 10.3 Capsules and tablets - Market size and forecast 2024-2029
        • Chart on Capsules and tablets - Market size and forecast 2024-2029 ($ million)
        • Data Table on Capsules and tablets - Market size and forecast 2024-2029 ($ million)
        • Chart on Capsules and tablets - Year-over-year growth 2024-2029 (%)
        • Data Table on Capsules and tablets - Year-over-year growth 2024-2029 (%)
      • 10.4 Liquids - Market size and forecast 2024-2029
        • Chart on Liquids - Market size and forecast 2024-2029 ($ million)
        • Data Table on Liquids - Market size and forecast 2024-2029 ($ million)
        • Chart on Liquids - Year-over-year growth 2024-2029 (%)
        • Data Table on Liquids - Year-over-year growth 2024-2029 (%)
      • 10.5 Creams - Market size and forecast 2024-2029
        • Chart on Creams - Market size and forecast 2024-2029 ($ million)
        • Data Table on Creams - Market size and forecast 2024-2029 ($ million)
        • Chart on Creams - Year-over-year growth 2024-2029 (%)
        • Data Table on Creams - Year-over-year growth 2024-2029 (%)
      • 10.6 Sprays - Market size and forecast 2024-2029
        • Chart on Sprays - Market size and forecast 2024-2029 ($ million)
        • Data Table on Sprays - Market size and forecast 2024-2029 ($ million)
        • Chart on Sprays - Year-over-year growth 2024-2029 (%)
        • Data Table on Sprays - Year-over-year growth 2024-2029 (%)
      • 10.7 Others - Market size and forecast 2024-2029
        • Chart on Others - Market size and forecast 2024-2029 ($ million)
        • Data Table on Others - Market size and forecast 2024-2029 ($ million)
        • Chart on Others - Year-over-year growth 2024-2029 (%)
        • Data Table on Others - Year-over-year growth 2024-2029 (%)
      • 10.8 Market opportunity by Product Type
        • Market opportunity by Product Type ($ million)
        • Data Table on Market opportunity by Product Type ($ million)

      11 Customer Landscape

      • 11.1 Customer landscape overview
        • Analysis of price sensitivity, lifecycle, customer purchase basket, adoption rates, and purchase criteria

      12 Geographic Landscape

      • 12.1 Geographic segmentation
        • Chart on Market share by geography 2024-2029 (%)
        • Data Table on Market share by geography 2024-2029 (%)
      • 12.2 Geographic comparison
        • Chart on Geographic comparison
        • Data Table on Geographic comparison
      • 12.3 North America - Market size and forecast 2024-2029
        • Chart on North America - Market size and forecast 2024-2029 ($ million)
        • Data Table on North America - Market size and forecast 2024-2029 ($ million)
        • Chart on North America - Year-over-year growth 2024-2029 (%)
        • Data Table on North America - Year-over-year growth 2024-2029 (%)
      • 12.4 Europe - Market size and forecast 2024-2029
        • Chart on Europe - Market size and forecast 2024-2029 ($ million)
        • Data Table on Europe - Market size and forecast 2024-2029 ($ million)
        • Chart on Europe - Year-over-year growth 2024-2029 (%)
        • Data Table on Europe - Year-over-year growth 2024-2029 (%)
      • 12.5 APAC - Market size and forecast 2024-2029
        • Chart on APAC - Market size and forecast 2024-2029 ($ million)
        • Data Table on APAC - Market size and forecast 2024-2029 ($ million)
        • Chart on APAC - Year-over-year growth 2024-2029 (%)
        • Data Table on APAC - Year-over-year growth 2024-2029 (%)
      • 12.6 South America - Market size and forecast 2024-2029
        • Chart on South America - Market size and forecast 2024-2029 ($ million)
        • Data Table on South America - Market size and forecast 2024-2029 ($ million)
        • Chart on South America - Year-over-year growth 2024-2029 (%)
        • Data Table on South America - Year-over-year growth 2024-2029 (%)
      • 12.7 Middle East and Africa - Market size and forecast 2024-2029
        • Chart on Middle East and Africa - Market size and forecast 2024-2029 ($ million)
        • Data Table on Middle East and Africa - Market size and forecast 2024-2029 ($ million)
        • Chart on Middle East and Africa - Year-over-year growth 2024-2029 (%)
        • Data Table on Middle East and Africa - Year-over-year growth 2024-2029 (%)
      • 12.8 US - Market size and forecast 2024-2029
        • Chart on US - Market size and forecast 2024-2029 ($ million)
        • Data Table on US - Market size and forecast 2024-2029 ($ million)
        • Chart on US - Year-over-year growth 2024-2029 (%)
        • Data Table on US - Year-over-year growth 2024-2029 (%)
      • 12.9 UK - Market size and forecast 2024-2029
        • Chart on UK - Market size and forecast 2024-2029 ($ million)
        • Data Table on UK - Market size and forecast 2024-2029 ($ million)
        • Chart on UK - Year-over-year growth 2024-2029 (%)
        • Data Table on UK - Year-over-year growth 2024-2029 (%)
      • 12.10 Germany - Market size and forecast 2024-2029
        • Chart on Germany - Market size and forecast 2024-2029 ($ million)
        • Data Table on Germany - Market size and forecast 2024-2029 ($ million)
        • Chart on Germany - Year-over-year growth 2024-2029 (%)
        • Data Table on Germany - Year-over-year growth 2024-2029 (%)
      • 12.11 China - Market size and forecast 2024-2029
        • Chart on China - Market size and forecast 2024-2029 ($ million)
        • Data Table on China - Market size and forecast 2024-2029 ($ million)
        • Chart on China - Year-over-year growth 2024-2029 (%)
        • Data Table on China - Year-over-year growth 2024-2029 (%)
      • 12.12 Canada - Market size and forecast 2024-2029
        • Chart on Canada - Market size and forecast 2024-2029 ($ million)
        • Data Table on Canada - Market size and forecast 2024-2029 ($ million)
        • Chart on Canada - Year-over-year growth 2024-2029 (%)
        • Data Table on Canada - Year-over-year growth 2024-2029 (%)
      • 12.13 France - Market size and forecast 2024-2029
        • Chart on France - Market size and forecast 2024-2029 ($ million)
        • Data Table on France - Market size and forecast 2024-2029 ($ million)
        • Chart on France - Year-over-year growth 2024-2029 (%)
        • Data Table on France - Year-over-year growth 2024-2029 (%)
      • 12.14 Italy - Market size and forecast 2024-2029
        • Chart on Italy - Market size and forecast 2024-2029 ($ million)
        • Data Table on Italy - Market size and forecast 2024-2029 ($ million)
        • Chart on Italy - Year-over-year growth 2024-2029 (%)
        • Data Table on Italy - Year-over-year growth 2024-2029 (%)
      • 12.15 Spain - Market size and forecast 2024-2029
        • Chart on Spain - Market size and forecast 2024-2029 ($ million)
        • Data Table on Spain - Market size and forecast 2024-2029 ($ million)
        • Chart on Spain - Year-over-year growth 2024-2029 (%)
        • Data Table on Spain - Year-over-year growth 2024-2029 (%)
      • 12.16 Japan - Market size and forecast 2024-2029
        • Chart on Japan - Market size and forecast 2024-2029 ($ million)
        • Data Table on Japan - Market size and forecast 2024-2029 ($ million)
        • Chart on Japan - Year-over-year growth 2024-2029 (%)
        • Data Table on Japan - Year-over-year growth 2024-2029 (%)
      • 12.17 India - Market size and forecast 2024-2029
        • Chart on India - Market size and forecast 2024-2029 ($ million)
        • Data Table on India - Market size and forecast 2024-2029 ($ million)
        • Chart on India - Year-over-year growth 2024-2029 (%)
        • Data Table on India - Year-over-year growth 2024-2029 (%)
      • 12.18 Market opportunity by geography
        • Market opportunity by geography ($ million)
        • Data Tables on Market opportunity by geography ($ million)

      13 Drivers, Challenges, and Opportunity/Restraints

      • 13.1 Market drivers
        • 13.2 Market challenges
          • 13.3 Impact of drivers and challenges
            • Impact of drivers and challenges in 2024 and 2029
          • 13.4 Market opportunities/restraints

            14 Competitive Landscape

            • 14.1 Overview
              • 14.2 Competitive Landscape
                • Overview on criticality of inputs and factors of differentiation
              • 14.3 Landscape disruption
                • Overview on factors of disruption
              • 14.4 Industry risks
                • Impact of key risks on business

              15 Competitive Analysis

              • 15.1 Companies profiled
                • Companies covered
              • 15.2 Company ranking index
                • Company ranking index
              • 15.3 Market positioning of companies
                • Matrix on companies position and classification
              • 15.4 Apis Flora Industrial e Comercial Ltda.
                • Apis Flora Industrial e Comercial Ltda. - Overview
                • Apis Flora Industrial e Comercial Ltda. - Product / Service
                • Apis Flora Industrial e Comercial Ltda. - Key offerings
                • SWOT
              • 15.5 Associated British Foods Plc
                • Associated British Foods Plc - Overview
                • Associated British Foods Plc - Business segments
                • Associated British Foods Plc - Key offerings
                • Associated British Foods Plc - Segment focus
                • SWOT
              • 15.6 Comvita Ltd.
                • Comvita Ltd. - Overview
                • Comvita Ltd. - Business segments
                • Comvita Ltd. - Key offerings
                • Comvita Ltd. - Segment focus
                • SWOT
              • 15.7 Herb Pharm
                • Herb Pharm - Overview
                • Herb Pharm - Product / Service
                • Herb Pharm - Key offerings
                • SWOT
              • 15.8 Hi Tech Natural Products India Ltd.
                • Hi Tech Natural Products India Ltd. - Overview
                • Hi Tech Natural Products India Ltd. - Product / Service
                • Hi Tech Natural Products India Ltd. - Key offerings
                • SWOT
              • 15.9 INW Manufacturing LLC
                • INW Manufacturing LLC - Overview
                • INW Manufacturing LLC - Product / Service
                • INW Manufacturing LLC - Key offerings
                • SWOT
              • 15.10 Laprell Beehive Products Inc.
                • Laprell Beehive Products Inc. - Overview
                • Laprell Beehive Products Inc. - Product / Service
                • Laprell Beehive Products Inc. - Key offerings
                • SWOT
              • 15.11 Manuka Health New Zealand Ltd.
                • Manuka Health New Zealand Ltd. - Overview
                • Manuka Health New Zealand Ltd. - Product / Service
                • Manuka Health New Zealand Ltd. - Key offerings
                • SWOT
              • 15.12 NaturaNectar LLC
                • NaturaNectar LLC - Overview
                • NaturaNectar LLC - Product / Service
                • NaturaNectar LLC - Key offerings
                • SWOT
              • 15.13 Natures Goodness Australia Pty Ltd
                • Natures Goodness Australia Pty Ltd - Overview
                • Natures Goodness Australia Pty Ltd - Product / Service
                • Natures Goodness Australia Pty Ltd - Key offerings
                • SWOT
              • 15.14 NOW Foods
                • NOW Foods - Overview
                • NOW Foods - Product / Service
                • NOW Foods - Key offerings
                • SWOT
              • 15.15 Nutraceutical Corp.
                • Nutraceutical Corp. - Overview
                • Nutraceutical Corp. - Product / Service
                • Nutraceutical Corp. - Key offerings
                • SWOT
              • 15.16 Sunyata Productos Alternativos Ltda.
                • Sunyata Productos Alternativos Ltda. - Overview
                • Sunyata Productos Alternativos Ltda. - Product / Service
                • Sunyata Productos Alternativos Ltda. - Key offerings
                • SWOT
              • 15.17 Wax Green USA
                • Wax Green USA - Overview
                • Wax Green USA - Product / Service
                • Wax Green USA - Key offerings
                • SWOT
              • 15.18 YS Organic Bee Farms
                • YS Organic Bee Farms - Overview
                • YS Organic Bee Farms - Product / Service
                • YS Organic Bee Farms - Key offerings
                • SWOT

              16 Appendix

              • 16.1 Scope of the report
                • 16.2 Inclusions and exclusions checklist
                  • Inclusions checklist
                  • Exclusions checklist
                • 16.3 Currency conversion rates for US$
                  • Currency conversion rates for US$
                • 16.4 Research methodology
                  • Research methodology
                • 16.5 Data procurement
                  • Information sources
                • 16.6 Data validation
                  • Data validation
                • 16.7 Validation techniques employed for market sizing
                  • Validation techniques employed for market sizing
                • 16.8 Data synthesis
                  • Data synthesis
                • 16.9 360 degree market analysis
                  • 360 degree market analysis
                • 16.10 List of abbreviations
                  • List of abbreviations

                Research Methodology

                Technavio presents a detailed picture of the market by way of study, synthesis, and summation of data from multiple sources. The analysts have presented the various facets of the market with a particular focus on identifying the key industry influencers. The data thus presented is comprehensive, reliable, and the result of extensive research, both primary and secondary.

                INFORMATION SOURCES

                Primary sources

                • Manufacturers and suppliers
                • Channel partners
                • Industry experts
                • Strategic decision makers

                Secondary sources

                • Industry journals and periodicals
                • Government data
                • Financial reports of key industry players
                • Historical data
                • Press releases

                DATA ANALYSIS

                Data Synthesis

                • Collation of data
                • Estimation of key figures
                • Analysis of derived insights

                Data Validation

                • Triangulation with data models
                • Reference against proprietary databases
                • Corroboration with industry experts

                REPORT WRITING

                Qualitative

                • Market drivers
                • Market challenges
                • Market trends
                • Five forces analysis

                Quantitative

                • Market size and forecast
                • Market segmentation
                • Geographical insights
                • Competitive landscape

                Interested in this report?

                Get your sample now to see our research methodology and insights!

                Download Now

                Frequently Asked Questions

                Propolis market growth will increase by $ 135 mn during 2025-2029.

                The Propolis market is expected to grow at a CAGR of 3.3% during 2025-2029.

                Propolis market is segmented by Application( Healthcare, Personal care and cosmetics, Food and beverages) Distribution Channel( Offline, Online, North America, South America, Middle East and Africa) Product Type( Capsules and tablets, Liquids, Creams, Sprays, Others)

                Apis Flora Industrial e Comercial Ltda., Associated British Foods Plc, Bio Botanica Inc., Comvita Ltd., Country Life Vitamins LLC, Herb Pharm, Hi Tech Natural Products India Ltd., iHerb LLC, INW Manufacturing LLC, Laprell Beehive Products Inc., Manuka Health New Zealand Ltd., Natural Factors Nutritional Products Ltd., NaturaNectar LLC, Natures Goodness Australia Pty Ltd, NOW Foods, Nutraceutical Corp., Sunyata Productos Alternativos Ltda., Uniflora Nutraceutica Ltda., Wax Green USA, YS Organic Bee Farms are a few of the key vendors in the Propolis market.

                North America will register the highest growth rate of 37% among the other regions. Therefore, the Propolis market in North America is expected to garner significant business opportunities for the vendors during the forecast period.

                US, UK, Germany, Canada, China, France, Italy, Spain, Japan, India

                • Health benefits of consuming propolisPropolis compositions exhibit anti-viral is the driving factor this market.
                • antifungal is the driving factor this market.
                • antibacterial is the driving factor this market.
                • and anti-inflammatory properties and offer protection from some bacteria is the driving factor this market.
                • viruses is the driving factor this market.
                • and fungi. Thus is the driving factor this market.
                • propolis is a vital ingredient in many healthcare products. Some of the health benefits of consuming propolis are as follows:Propolis helps improve blood sugar levels in diabetic people.Regular application of propolis-based ointment reduces pain from cold sores.Regular application of propolis-based products is the driving factor this market.
                • such as propolis cream is the driving factor this market.
                • on the skin helps prevent infections and treats minor burns.Gum diseases is the driving factor this market.
                • such as periodontitis (gum bleeding) is the driving factor this market.
                • in humans can be controlled by using propolis extract solutions.Other benefits of consuming propolis include improved immune response and prevention from inflammation is the driving factor this market.
                • infections is the driving factor this market.
                • nose and throat cancer is the driving factor this market.
                • intestinal disorders is the driving factor this market.
                • ulcers is the driving factor this market.
                • and tuberculosis.Companies operating in the market offer propolis-based products for specific health needs. Manuka Health New Zealand Ltd. (Manuka Health) offers Immune Response is the driving factor this market.
                • a product that contains propolis extract as a vital ingredient and helps enhance the immunity of the body.Natures Goodness offers PROPOLIS TOOTHPASTE 110G is the driving factor this market.
                • which is used to treat various oral health issues such as plaque is the driving factor this market.
                • ulcers is the driving factor this market.
                • and gum diseases. This product comprises propolis extract is the driving factor this market.
                • an active ingredient is the driving factor this market.
                • along with organic acids is the driving factor this market.
                • flavonoids is the driving factor this market.
                • and other minerals. The easy availability of products containing propolis extracts is one of the major factors driving the growth of the market in focus during the forecast period. is the driving factor this market.

                The Propolis market vendors should focus on grabbing business opportunities from the Healthcare segment as it accounted for the largest market share in the base year.