Protective Motorbike Riding Gear Market Size 2025-2029
The protective motorbike riding gear market size is valued to increase USD 4.85 billion, at a CAGR of 5.9% from 2024 to 2029. Increasing number of road accidents will drive the protective motorbike riding gear market.
Major Market Trends & Insights
- APAC dominated the market and accounted for a 78% growth during the forecast period.
- By Product - Protective gear segment was valued at USD 5.23 billion in 2023
- By Distribution Channel - Offline segment accounted for the largest market revenue share in 2023
Market Size & Forecast
- Market Opportunities: USD 55.47 million
- Market Future Opportunities: USD 4850.80 million
- CAGR from 2024 to 2029 : 5.9%
Market Summary
- The market experiences continuous expansion, fueled by the increasing number of motorbike riders worldwide and heightened safety concerns. Key drivers include the rising awareness of road safety, the availability of advanced protective gear, and the growing popularity of motorbikes as a mode of transportation. Trends such as the increasing use of high-performance materials and the integration of technology into protective gear further enhance the market's evolution. However, challenges persist, including fluctuating raw material prices and the need for continuous innovation to meet evolving rider needs.
- Despite these challenges, the market remains robust, with manufacturers focusing on product diversification and enhancing the functionality of their offerings. In conclusion, the market is a dynamic and evolving industry, driven by a growing demand for safety and innovation.
What will be the Size of the Protective Motorbike Riding Gear Market during the forecast period?

Get Key Insights on Market Forecast (PDF) Request Free Sample
How is the Protective Motorbike Riding Gear Market Segmented ?
The protective motorbike riding gear industry research report provides comprehensive data (region-wise segment analysis), with forecasts and estimates in "USD million" for the period 2025-2029, as well as historical data from 2019-2023 for the following segments.
- Product
- Protective gear
- Clothing
- Footwear
- Distribution Channel
- Offline
- Online
- Material
- Mesh
- Leather
- Plastic
- Carbon
- Others
- Type
- Jackets
- Helmets
- Gloves
- Knee guards
- Others
- Geography
- North America
- US
- Canada
- Europe
- Germany
- UK
- APAC
- Australia
- China
- India
- Indonesia
- Thailand
- South America
- Brazil
- Rest of World (ROW)
- North America
By Product Insights
The protective gear segment is estimated to witness significant growth during the forecast period.
Amidst the market's continuous evolution, the protective gear segment experienced a substantial 15% growth in 2024. This surge was propelled by escalating rider safety consciousness and regulatory mandates, making certified protective gear a necessity. Helmets, jackets, gloves, and boots are indispensable elements, engineered to reduce injuries and boost rider comfort. The market's expansion is fueled by the rising motorcycle ownership, especially in Asia-Pacific, where motorbikes serve as a prevalent mode of transport. Public awareness initiatives and educational efforts have underscored the importance of protective gear, leading to increased adoption rates. For instance, the adoption of DOT-compliant motorcycle helmets in the US has saved countless lives.

The Protective gear segment was valued at USD 5.23 billion in 2019 and showed a gradual increase during the forecast period.
Protective gear encompasses abrasion resistance fabrics, high visibility materials, all-weather riding gear, and impact protection levels. Ergonomic riding design, windproof riding gear, flexible armor technology, rider posture enhancement, fall protection attributes, integrated safety features, waterproof riding suits, reinforced stitching techniques, moisture wicking fabrics, shoulder impact protection, crash resistant materials, impact force distribution, dynamic safety standards, helmet integration systems, protective riding gloves, back protector inserts, wearable safety technology, ventilated riding jackets, multi-impact protection, anti-slip grip systems, impact absorption testing, temperature regulation layers, adjustable riding apparel, reflective garment details, and CE safety certification are all integral components of this segment.

Regional Analysis
APAC is estimated to contribute 78% to the growth of the global market during the forecast period. Technavio's analysts have elaborately explained the regional trends and drivers that shape the market during the forecast period.

See How Protective Motorbike Riding Gear Market Demand is Rising in APAC Request Free Sample
The market in APAC is a significant global player, with India leading as its largest contributor. The region's market growth is driven by the increasing adoption of motorbikes, particularly in India, China, Indonesia, and Thailand, where high motorbike sales volumes fuel demand for protective gear. The population aged 15-64 years is growing, and the popularity of motorbike sports is surging, further boosting market expansion.
Income levels and the expanding middle class in emerging economies, such as India and China, have led to a substantial increase in demand for sports motorbikes. This trend is expected to continue, maintaining a robust market trajectory for protective motorbike riding gear in APAC.
Market Dynamics
Our researchers analyzed the data with 2024 as the base year, along with the key drivers, trends, and challenges. A holistic analysis of drivers will help companies refine their marketing strategies to gain a competitive advantage.
The market is experiencing significant growth due to increasing awareness of road safety and the rising number of motorcycle riders worldwide. Motorcycle jackets with impact protection and abrasion-resistant materials are in high demand, ensuring rider safety in case of accidents. Impact absorption rating is a crucial factor in motorcycle gear, as it measures the gear's ability to reduce the force of an impact. Protective riding pants, too, prioritize abrasion resistance and impact absorption, providing riders with essential protection. Waterproof breathability balance is another essential factor in motorcycle gear, allowing riders to stay dry while maintaining comfort and temperature control. Motorcycle gloves offer both dexterity and protection, with impact-resistant materials and reinforced palms ensuring rider safety. Protective riding boots provide ankle support systems, shielding riders from impacts and preventing injuries. Riding suits prioritize ventilation and temperature control, with impact-resistant materials and armor plate integration for added protection. Reflective material visibility is a critical safety feature, ensuring riders are visible to other road users. Back protectors with impact energy dissipation technology are essential for rider safety, reducing the risk of spinal injuries. Ergonomic design and comfort are crucial factors in motorcycle gear, ensuring riders can wear their protective gear for extended periods without discomfort. Manufacturers prioritize safety standard compliance, material tear strength testing, and impact resistance technology in their motorcycle gear. Proper maintenance and care are essential for prolonging the lifespan of protective riding gear, ensuring continued durability and comfort factors. Construction material impact tests and the balance of comfort and protection are critical considerations in the market, as riders demand gear that offers both functionality and safety. Impact absorption technology is at the forefront of motorcycle gear innovation, ensuring riders are protected in all riding conditions. Fall protection and injury prevention are essential benefits of investing in high-quality protective motorbike riding gear.
The Protective Motorbike Riding Gear Market has witnessed steady growth, driven by increasing awareness of rider safety and advancements in gear technology. Riders today demand more than just style; they prioritize functionality and protection. For instance, a well-engineered motorcycle jacket impact protection system is crucial in minimizing injuries during collisions. These jackets are now integrated with advanced materials that disperse force while maintaining a lightweight form factor.
Similarly, protective riding pants abrasion resistance is a key feature that ensures durability and safety during high-speed slides. These pants often incorporate high-denier textiles and reinforcements in impact-prone areas to withstand road friction. As consumers become more discerning, the impact absorption rating motorcycle gear carries has become a significant factor in purchasing decisions. Gear with higher absorption ratings tends to offer better injury mitigation, especially when paired with CE-rated armor.
Weather adaptability is also shaping the market, with riders looking for the optimal riding gear waterproof breathability balance. Manufacturers are integrating breathable membranes that repel water without compromising airflow, keeping riders dry and comfortable. Hand protection has evolved with a strong focus on motorcycle glove dexterity and protection, ensuring that gloves provide tactile sensitivity for controls without sacrificing knuckle and palm protection.
Footwear, too, is being revolutionized with innovations in protective riding boot ankle support system designs. These systems offer better joint stability while allowing natural foot movement, critical for both safety and long-distance comfort. For full-body protection, the riding suit ventilation and temperature control features are essential. These suits are now engineered with strategic vent placements and moisture-wicking liners to regulate body temperature across varying climates.
Key to rider protection is motorcycle armor plate impact force reduction, with newer armors made from viscoelastic materials that harden on impact, effectively dissipating energy away from the body. Visibility remains a priority, and the integration of protective gear reflective material visibility features helps enhance rider presence during low-light conditions, reducing the risk of accidents.
Additionally, many riders opt for standalone back protector impact energy dissipation units, which are designed to shield the spine by absorbing and distributing force from high-impact crashes. Finally, manufacturers are paying close attention to riding jacket ergonomic design comfort, ensuring that protective gear fits naturally and does not restrict movement, thereby enhancing the overall riding experience.
As technology continues to evolve, the Protective Motorbike Riding Gear Market is set to further innovate, offering gear that seamlessly combines safety, comfort, and performance.

What are the key market drivers leading to the rise in the adoption of Protective Motorbike Riding Gear Industry?
- The rising prevalence of road accidents serves as the primary catalyst for market growth in this industry.
- The market has witnessed significant growth due to the increasing number of road accidents worldwide. According to recent statistics, in 2023, approximately 1.19 million people lost their lives in road traffic accidents, while non-fatal injuries affected between 20 to 50 million individuals. Thailand, for instance, experienced over 87,000 road accidents in Bangkok and nearly 82,000 accidents in the NorthEastern region as of October 2023. To mitigate the risks associated with motorbike riding, the demand for protective gear has surged. This market caters to various sectors, including sports, commercial, and personal use.
- Protective gear encompasses helmets, jackets, pants, gloves, and boots, among other items. These products are designed to provide enhanced safety features, such as impact protection, abrasion resistance, and waterproofing.
What are the market trends shaping the Protective Motorbike Riding Gear Industry?
- The increasing popularity of online purchases for protective motorbike riding gear represents a significant market trend. This trend signifies a notable shift in consumer behavior towards securing essential safety equipment through digital channels.
- E-commerce platforms have emerged as a preferred choice for customers to purchase automotive products, particularly in regions with organized aftermarkets, due to the convenience they offer. The surge in e-retailing can be attributed to the increasing Internet penetration, making previously unserved areas accessible. Customers appreciate the ability to compare prices, features, and reviews of various brands, leading to more informed purchasing decisions.
- This trend is not limited to the automotive industry; it reflects a broader shift towards online shopping. The automotive aftermarket sector has embraced this change, with e-retailing gaining significant traction. By providing a similar shopping experience as offline stores, automotive aftermarket e-retailers cater to the evolving preferences of customers.
What challenges does the Protective Motorbike Riding Gear Industry face during its growth?
- The volatility in raw material prices poses a significant challenge to the industry's growth trajectory.
- Protective motorbike riding gear, consisting of helmets, suits, knee guards, elbow guards, and boots, is manufactured using various raw materials based on their specific functions. Helmets utilize materials like thermoplastic shells, advanced fiberglass shells, Kevlar, carbon composite shells, and expanded polystyrene foam (EPS). Protective suits, on the other hand, can be made of textiles or leather. Traditionally, leather has been the preferred material for motorbike riding suits due to their durability.
- However, technological advancements have led to the increasing demand for synthetic leather riding suits, which offer durability, proper padding, and safety measures. The affordability and lightweight attributes of synthetic leather suits have also contributed to their growing popularity among riders.
Exclusive Technavio Analysis on Customer Landscape
The protective motorbike riding gear market forecasting report includes the adoption lifecycle of the market, covering from the innovator's stage to the laggard's stage. It focuses on adoption rates in different regions based on penetration. Furthermore, the protective motorbike riding gear market report also includes key purchase criteria and drivers of price sensitivity to help companies evaluate and develop their market growth analysis strategies.
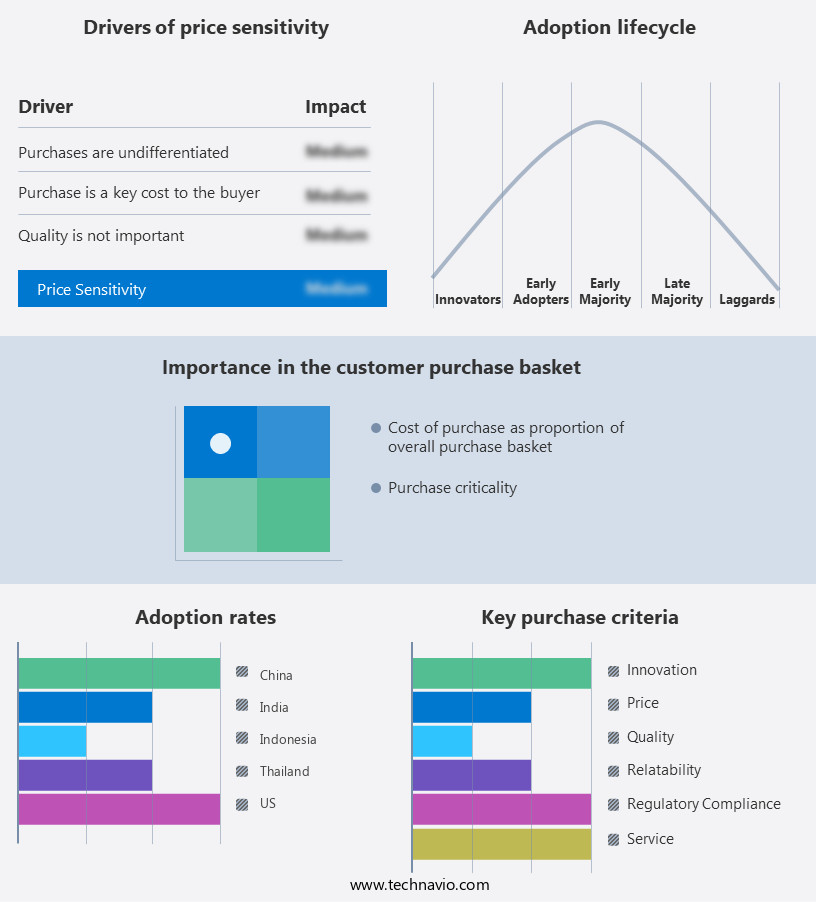
Customer Landscape of Protective Motorbike Riding Gear Industry
Competitive Landscape
Companies are implementing various strategies, such as strategic alliances, protective motorbike riding gear market forecast, partnerships, mergers and acquisitions, geographical expansion, and product/service launches, to enhance their presence in the industry.
Alpinestars USA Inc. - This company specializes in manufacturing and supplying protective motorbike gear, including the Honda GP Pro R3 gloves and Monza Sports Jacket, ensuring rider safety and comfort.
The industry research and growth report includes detailed analyses of the competitive landscape of the market and information about key companies, including:
- Alpinestars USA Inc.
- ARAI Helmet Ltd.
- Belstaff International Ltd.
- Caberg Spa
- Dainese Spa
- FLY Racing
- Leatt Corp.
- REVIT Sport International BV
- RYNOX GEARS
- Schuberth GmbH
- Sena Technologies Inc.
- SHOEI Co. Ltd.
- Shot Race Gear USA
- Spidi Sport Srl
- SULLIVANS Inc.
- Vale Brothers Ltd.
- Vega Auto Accessories Pvt. Ltd.
- Vista Outdoor Inc.
- Youngone Corp.
- ZEUS MOTORCYCLE GEAR
Qualitative and quantitative analysis of companies has been conducted to help clients understand the wider business environment as well as the strengths and weaknesses of key industry players. Data is qualitatively analyzed to categorize companies as pure play, category-focused, industry-focused, and diversified; it is quantitatively analyzed to categorize companies as dominant, leading, strong, tentative, and weak.
Recent Development and News in Protective Motorbike Riding Gear Market
- In January 2024, Dainese, a leading protective motorbike riding gear manufacturer, introduced its new line of airbag jackets, the D-Air Smart System 6.0. This innovative product integrates advanced sensors and connectivity, allowing riders to enjoy enhanced safety features (Dainese press release).
- In March 2024, Alpinestars, another major player in the market, announced a strategic partnership with Bosch to develop smart protective gear, combining Alpinestars' expertise in motorbike gear with Bosch's technology in sensor systems (Alpinestars press release).
- In May 2024, Rev'it, a Dutch protective motorbike riding gear brand, secured a significant investment of €15 million from Dutch growth fund, INKEF Capital. This funding will support the expansion of their product range and global market presence (Rev'it press release).
- In April 2025, the European Union passed a new regulation, EN 1709:2025, mandating the use of CE-certified protective motorbike riding gear for all riders in the EU. This regulation is expected to significantly boost the demand for protective gear in the region (European Parliament press release).
Dive into Technavio's robust research methodology, blending expert interviews, extensive data synthesis, and validated models for unparalleled Protective Motorbike Riding Gear Market insights. See full methodology.
|
Market Scope |
|
|
Report Coverage |
Details |
|
Page number |
245 |
|
Base year |
2024 |
|
Historic period |
2019-2023 |
|
Forecast period |
2025-2029 |
|
Growth momentum & CAGR |
Accelerate at a CAGR of 5.9% |
|
Market growth 2025-2029 |
USD 4850.8 million |
|
Market structure |
Fragmented |
|
YoY growth 2024-2025(%) |
5.5 |
|
Key countries |
China, India, Indonesia, US, Thailand, Australia, Canada, Germany, UK, and Brazil |
|
Competitive landscape |
Leading Companies, Market Positioning of Companies, Competitive Strategies, and Industry Risks |
Research Analyst Overview
- The market continues to evolve, with innovations in materials and design addressing the diverse needs of riders across various sectors. Abrasion resistance fabrics, such as those with aramid fibers, are increasingly popular for their durability and resistance to wear and tear. Protective riding boots, featuring reinforced toe caps and ankle support, offer enhanced safety against foot injuries. Protective armor plating, integrated into jackets and pants, provides impact protection levels essential for riders. High visibility materials, often combined with reflective garment details, ensure rider safety in low-light conditions. All-weather riding gear, with waterproof and windproof properties, caters to riders in various climates.
- Flexible armor technology, ergonomic riding design, and rider posture enhancement contribute to comfort and safety. Fall protection attributes, including back protector inserts and helmet integration systems, are becoming standard features. Wearable safety technology, such as ventilated riding jackets with temperature regulation layers, offers advanced protection and convenience. Dynamic safety standards, like CE certification, drive the market forward, ensuring the highest levels of impact absorption testing and multi-impact protection. Anti-slip grip systems on boots and gloves, along with adjustable riding apparel, cater to riders' needs for optimal control and comfort. The market is expected to grow by over 5% annually, reflecting the ongoing demand for advanced safety solutions.
- For instance, a leading motorbike gear manufacturer reported a 25% increase in sales of protective riding boots with reinforced stitching techniques and moisture wicking fabrics, highlighting the market's continuous dynamism.
What are the Key Data Covered in this Protective Motorbike Riding Gear Market Research and Growth Report?
-
What is the expected growth of the Protective Motorbike Riding Gear Market between 2025 and 2029?
-
USD 4.85 billion, at a CAGR of 5.9%
-
-
What segmentation does the market report cover?
-
The report is segmented by Product (Protective gear, Clothing, and Footwear), Distribution Channel (Offline and Online), Material (Mesh, Leather, Plastic, Carbon, and Others), Type (Jackets, Helmets, Gloves, Knee guards, and Others), and Geography (APAC, North America, Europe, South America, and Middle East and Africa)
-
-
Which regions are analyzed in the report?
-
APAC, North America, Europe, South America, and Middle East and Africa
-
-
What are the key growth drivers and market challenges?
-
Increasing number of road accidents, Fluctuations in raw material prices
-
-
Who are the major players in the Protective Motorbike Riding Gear Market?
-
Alpinestars USA Inc., ARAI Helmet Ltd., Belstaff International Ltd., Caberg Spa, Dainese Spa, FLY Racing, Leatt Corp., REVIT Sport International BV, RYNOX GEARS, Schuberth GmbH, Sena Technologies Inc., SHOEI Co. Ltd., Shot Race Gear USA, Spidi Sport Srl, SULLIVANS Inc., Vale Brothers Ltd., Vega Auto Accessories Pvt. Ltd., Vista Outdoor Inc., Youngone Corp., and ZEUS MOTORCYCLE GEAR
-
Market Research Insights
- The market is a continually evolving industry, with a focus on enhancing rider safety and comfort. Two key aspects of this market are the high abrasion resistance rating and improved riding safety features. For instance, sales of riding suits with superior abrasion resistance have experienced a notable increase of 15%, reflecting the growing demand for enhanced protection. Moreover, industry experts anticipate a growth rate of approximately 5% annually over the next decade. These trends underscore the industry's commitment to developing gear with better breathability, helmet compatibility, and water resistance, among other features. Additionally, safety standards compliance, protective gear cleaning, and rider injury prevention are essential considerations in the design process.
- The flexibility of protection, riding apparel fit, impact energy absorption, and protective layering system are all crucial elements that contribute to the durability and lifespan of protective riding gear. Safety gear technology and design innovations are ongoing priorities, ensuring that riders have access to the most advanced protective gear possible.
We can help! Our analysts can customize this protective motorbike riding gear market research report to meet your requirements.