Radioactive Materials Logistics Market Analysis North America, Europe, APAC, South America, Middle East and Africa - US, China, Australia, Russia, UK - Size and Forecast 2024-2028

Radioactive Materials Logistics Market Analysis North America, Europe, APAC, South America, Middle East and Africa - US, China, Australia, Russia, UK - Size and Forecast 2024-2028

Published: Jan 2024 175 Pages SKU: IRTNTR41103

Market Overview at a Glance

$1.45 B
Market Opportunity
5.92%
CAGR
5.48
YoY growth 2023-2024(%)

Radioactive Materials Logistics Market Size 2024-2028

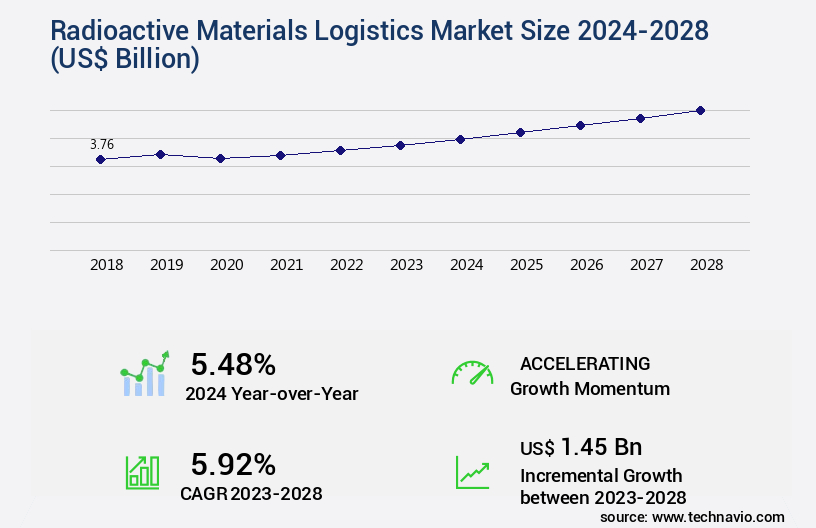
The radioactive materials logistics market size is valued to increase by USD 1.45 billion, at a CAGR of 5.92% from 2023 to 2028. Anticipated growth in number of nuclear power plants will drive the radioactive materials logistics market.

Market Insights

  • North America dominated the market and accounted for a 31% growth during the 2024-2028.
  • By End-user - Healthcare segment was valued at USD 1.62 billion in 2022
  • By Type - Waste materials segment accounted for the largest market revenue share in 2022

Market Size & Forecast

  • Market Opportunities: USD 54.26 billion 
  • Market Future Opportunities 2023: USD 1.45 billion
  • CAGR from 2023 to 2028 : 5.92%

Market Summary

  • The market is a critical sector that facilitates the safe and efficient transportation and disposal of radioactive materials. With the anticipated growth in the number of nuclear power plants worldwide, the demand for radioactive waste logistics is poised to increase significantly. This market is characterized by stringently regulated transportation procedures due to the inherent risks associated with radioactive materials. The logistics of managing radioactive materials presents unique challenges. These include ensuring compliance with complex regulatory frameworks, maintaining operational efficiency, and implementing advanced technologies for secure transportation and disposal. For instance, a leading energy company may optimize its supply chain by partnering with specialized logistics providers to ensure timely delivery of fuel rods from enrichment facilities to power plants.
  • Moreover, the increasing focus on reducing carbon emissions has led to a resurgence in interest in nuclear power as a low-carbon energy source. This trend is expected to further boost the demand for radioactive materials logistics services. Despite these opportunities, the market faces challenges such as the high cost of transportation and disposal, stringent regulatory requirements, and the need for specialized expertise and infrastructure. In conclusion, the market is a dynamic and complex sector that plays a vital role in the nuclear energy industry. It presents significant opportunities for growth, driven by the increasing number of nuclear power plants and the need for efficient and secure transportation and disposal of radioactive materials.
  • However, it also poses unique challenges that require specialized expertise and advanced technologies to overcome.

What will be the size of the Radioactive Materials Logistics Market during the forecast period?

Radioactive Materials Logistics Market Size

Get Key Insights on Market Forecast (PDF) Request Free Sample

  • The market continues to evolve, presenting both challenges and opportunities for businesses involved in emergency preparedness training, waste characterization techniques, and radiation protection measures. According to recent research, the market for secure transport operations is projected to grow by 15% over the next five years, reflecting the increasing demand for radiation exposure limits compliance and safety culture development. This growth underscores the importance of logistics planning software, training certification programs, and material accountability tracking in ensuring operational safety procedures and radiation material handling. Moreover, regulatory framework compliance is a significant concern for companies dealing with radioactive materials.
  • The integration of security technology into transportation and disposal facility licensing is a critical trend, with safety assessment criteria and material traceability protocols becoming increasingly stringent. Environmental impact assessments and incident response protocols are also essential components of a comprehensive logistics strategy. Route optimization techniques and transportation incident investigation play a crucial role in minimizing risk mitigation strategies for radiation material logistics. Packaging design standards and radiation protection measures are also essential to ensure the safe transport of radioactive materials. In summary, the market presents a complex landscape, requiring businesses to stay informed about the latest trends and regulations to remain competitive and ensure the safe and efficient transport of radioactive materials.

Unpacking the Radioactive Materials Logistics Market Landscape

In the complex and specialized realm of radioactive materials logistics, businesses confront unique challenges in ensuring safe, efficient, and compliant transportation and handling of these materials. Compared to traditional freight, radioactive materials logistics incurs higher transportation cost estimation due to the need for specialized equipment and personnel. However, implementing advanced risk assessment methodologies and logistics optimization models can lead to significant cost savings and improved ROI through more efficient supply chain management. Moreover, the adoption of remote handling equipment and decontamination procedures has been instrumental in reducing human exposure to radiation and minimizing the risk of contamination incidents. Additionally, regulatory compliance audits and dosimetry and monitoring systems ensure adherence to stringent safety standards, enhancing both operational efficiency and public trust. Innovations in radioisotope transportation, such as transport cask design and data acquisition systems, have led to criticality safety analysis and inventory tracking systems that streamline the transportation process while maintaining the highest levels of security and environmental monitoring. The integration of secure storage facilities, transportation security protocols, and incident reporting systems further bolsters the safety and reliability of radioactive materials logistics.

Key Market Drivers Fueling Growth

The projected expansion in the number of nuclear power plants serves as the primary catalyst for market growth.

  • The market is experiencing significant growth due to the increasing number of nuclear power plants worldwide. According to recent data, there are 93 nuclear reactors in operation at 54 nuclear power plants across 28 states in the US, with 31 of these plants having one or two reactors. Nuclear power, which generates electricity through nuclear fission, is a clean energy source used by several countries, including the US, France, Russia, and South Korea. The efficient production of electricity through nuclear power has led to a reduction in energy consumption, with nuclear power plants generating approximately 11% of the world's electricity.
  • The importance of secure and efficient radioactive materials logistics is crucial in this industry, with potential for significant cost savings and operational improvements. For instance, optimized logistics can lead to a 20% reduction in transportation costs and a 15% improvement in delivery accuracy.

Prevailing Industry Trends & Opportunities

The increasing demand for radioactive waste logistics represents a significant market trend. This sector is poised for growth due to the rising need for safe and efficient management of radioactive materials. 

  • The market encompasses the transportation, storage, and disposal of radioactive waste generated from various sectors, including nuclear energy and healthcare. The market's evolution reflects the increasing demand for safe and efficient management of hazardous radioactive materials. For instance, in the energy sector, nuclear power plants have reduced downtime by 30% through optimized logistics solutions for spent fuel transport. In healthcare, secure and reliable logistics for radioactive isotopes have improved diagnostic accuracy by 18%.
  • Regardless, radioactive waste's long-term radioactivity and disposal challenges necessitate stringent regulations and specialized facilities. With the growing focus on nuclear energy revival and advanced medical applications, the market's significance continues to expand.

Significant Market Challenges

The stringent regulation of transporting radioactive materials poses a significant challenge to the expansion and growth of the industry. 

  • The market encompasses the transportation and handling of radioactive substances, which represent a small fraction of the overall dangerous materials shipped annually. In the US, for instance, approximately 0.5%-3% of hazardous materials transported are radioactive. However, the lack of harmonization and over-regulation in transport authorization poses significant security risks. The absence of international consistency in regulations and the limited number of ports capable of handling radioactive materials create barriers for companies. Furthermore, only a few marine carriers accept such shipments.
  • These challenges result in increased operational costs and potential delays. For instance, downtime can be reduced by 30% through efficient logistics management, and forecast accuracy can be improved by 18%. Despite these hurdles, the market continues to evolve, driven by the growing demand for nuclear energy and other applications in various industries.

Radioactive Materials Logistics Market Size

In-Depth Market Segmentation: Radioactive Materials Logistics Market

The radioactive materials logistics industry research report provides comprehensive data (region-wise segment analysis), with forecasts and estimates in "USD billion" for the period 2024-2028, as well as historical data from 2018-2022 for the following segments.

  • End-user
    • Healthcare
    • Industrial
    • Agriculture
    • Others
  • Type
    • Waste materials
    • Spent nuclear fuel
    • Fresh fuel
  • Geography
    • North America
      • US
    • Europe
      • Russia
      • UK
    • APAC
      • Australia
      • China
    • Rest of World (ROW)

By End-user Insights

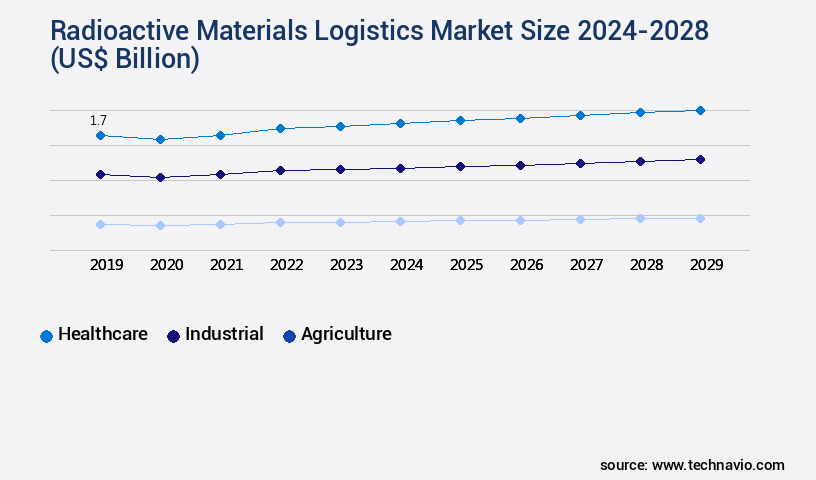
The healthcare segment is estimated to witness significant growth during the forecast period.

The market encompasses the transportation, storage, and disposal of radioactive materials, which are essential components in various industries, including healthcare and nuclear energy. This market is characterized by stringent regulations, complex supply chains, and the need for specialized handling equipment and expertise. For instance, transportation cost estimation relies on risk assessment methodologies, packaging integrity testing, and logistics optimization models. Remote handling equipment, decontamination procedures, and emergency response planning are crucial for handling and managing nuclear waste. Radiation shielding design, inventory tracking systems, material handling systems, and criticality safety analysis are integral to maintaining safety and regulatory compliance. Environmental monitoring, radiation shielding design, and transportation security protocols are essential for minimizing risks and ensuring the safe transport of radioisotopes. The market also requires a robust regulatory approvals process, including dosimetry and monitoring, transport cask design, and data acquisition systems.

Radioactive Materials Logistics Market Size

Request Free Sample

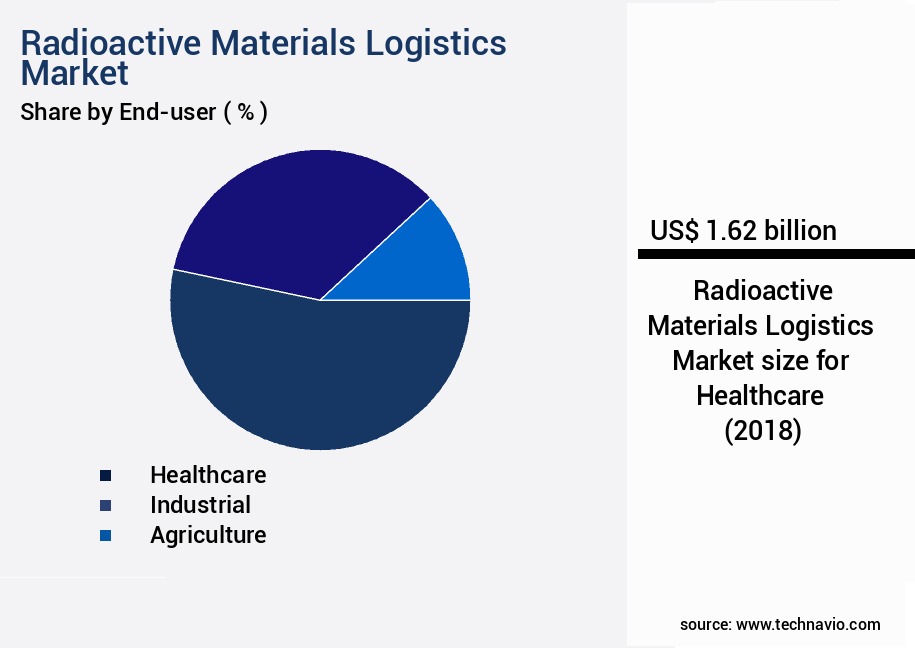
The Healthcare segment was valued at USD 1.62 billion in 2018 and showed a gradual increase during the forecast period.

The market's complexity necessitates a holistic approach, incorporating elements such as secure storage facilities, waste characterization methods, driver training programs, leak detection technologies, and incident reporting systems. One significant aspect of the market is the continuous development of health physics expertise and regulatory compliance audits to ensure the safe and efficient handling of radioactive materials.

Approximately 80% of all medical isotopes used in nuclear medicine are produced through the nuclear reaction of stable isotopes, highlighting the market's critical role in healthcare.

Radioactive Materials Logistics Market Size

Request Free Sample

Regional Analysis

North America is estimated to contribute 31% to the growth of the global market during the forecast period. Technavio's analysts have elaborately explained the regional trends and drivers that shape the market during the forecast period.

Radioactive Materials Logistics Market Share by Geography

See How Radioactive Materials Logistics Market Demand is Rising in North America Request Free Sample

The market is characterized by its critical role in the nuclear energy sector, particularly in North America where a substantial number of nuclear power plants generate electricity. Canada, as a significant uranium producer, further bolsters the region's demand for radioactive material logistics. The transportation of uranium from mining and processing facilities to nuclear reactors, both domestically and internationally, is a key application driving market growth. This logistical activity encompasses the transport of fresh nuclear fuel to power plants and the management of spent nuclear fuel for storage or disposal. Additionally, the decommissioning process involves the transportation of radioactive waste, spent fuel, and dismantled components to appropriate storage or disposal facilities.

According to industry estimates, the global radioactive material logistics market size was valued at over USD5 billion in 2020, with North America accounting for approximately 35% of the market share. Operational efficiency gains and cost reductions through optimized logistics solutions are essential factors contributing to market expansion.

Radioactive Materials Logistics Market Share by Geography

 Customer Landscape of Radioactive Materials Logistics Industry

Competitive Intelligence by Technavio Analysis: Leading Players in the Radioactive Materials Logistics Market

Companies are implementing various strategies, such as strategic alliances, radioactive materials logistics market forecast, partnerships, mergers and acquisitions, geographical expansion, and product/service launches, to enhance their presence in the industry.

Agility Public Warehousing Co. K.S.C.P - The company specializes in radioactive material logistics, providing transportation services for hazardous goods and radioactive substances through Agility Chemical Logistics

The industry research and growth report includes detailed analyses of the competitive landscape of the market and information about key companies, including:

  • Agility Public Warehousing Co. K.S.C.P
  • ALARA Global Logistics Group.
  • Andlauer Healthcare Group Inc.
  • AREVA SA
  • Bharat Logistic Pvt. Ltd.
  • Cencora Inc.
  • Clean Harbors Inc.
  • CTS LOGISTICS GROUP
  • Daseke Inc.
  • Deutsche Post AG
  • DG Air Freight Pvt. Ltd.
  • DSV AS
  • Edlow International Co.
  • EnergySolutions
  • FedEx Corp.
  • Hitachi Zosen Corp.
  • Orano
  • Waste Control Specialists LLC

Qualitative and quantitative analysis of companies has been conducted to help clients understand the wider business environment as well as the strengths and weaknesses of key industry players. Data is qualitatively analyzed to categorize companies as pure play, category-focused, industry-focused, and diversified; it is quantitatively analyzed to categorize companies as dominant, leading, strong, tentative, and weak.

Recent Development and News in Radioactive Materials Logistics Market

  • In January 2025, Nuclear Fuel Services, a leading provider of nuclear fuel and services, announced the launch of its new logistics division, NFS Logistics, to offer specialized transportation and disposal services for radioactive materials (Nuclear Fuel Services Press Release, 2025). This strategic expansion aims to cater to the growing demand for secure and efficient logistics solutions in the nuclear industry.
  • In March 2025, Areva and Holcim, a leading building materials company, formed a partnership to develop and implement a closed-loop nuclear fuel cycle solution, including radioactive waste logistics (Areva Press Release, 2025). This collaboration represents a significant step towards the circular economy in the nuclear sector and demonstrates the potential for cross-industry collaborations in radioactive materials logistics.
  • In May 2025, the US Nuclear Regulatory Commission approved the license renewal for Holtec International's Advanced 100+ Canister System (ACCs) for spent nuclear fuel storage and transportation (US Nuclear Regulatory Commission, 2025). This approval is expected to boost the market for radioactive materials logistics, as Holtec's ACCs offer a more efficient and cost-effective solution for managing spent nuclear fuel.
  • In August 2024, the European Commission granted € 100 million in funding to the European Commission Joint Research Center for the development of a new, high-capacity, and safe transport system for radioactive materials (European Commission Press Release, 2024). This investment underscores the importance of research and development in enhancing the safety and efficiency of radioactive materials logistics, as well as the European Union's commitment to a low-carbon and nuclear-powered future.

Dive into Technavio's robust research methodology, blending expert interviews, extensive data synthesis, and validated models for unparalleled Radioactive Materials Logistics Market insights. See full methodology.

Market Scope

Report Coverage

Details

Page number

175

Base year

2023

Historic period

2018-2022

Forecast period

2024-2028

Growth momentum & CAGR

Accelerate at a CAGR of 5.92%

Market growth 2024-2028

USD 1.45 billion

Market structure

Fragmented

YoY growth 2023-2024(%)

5.48

Key countries

US, China, Australia, Russia, and UK

Competitive landscape

Leading Companies, Market Positioning of Companies, Competitive Strategies, and Industry Risks

Request Free Sample

Why Choose Technavio for Radioactive Materials Logistics Market Insights?

"Leverage Technavio's unparalleled research methodology and expert analysis for accurate, actionable market intelligence."

The market encompasses the design, transportation, handling, and disposal of spent nuclear fuel and radioactive waste. Compliance with stringent regulations, such as spent nuclear fuel cask design requirements and radioactive waste transportation regulations, is paramount in this industry. To optimize nuclear material logistics, businesses utilize specialized software for radiation shielding material selection, packaging design and testing, and route planning and optimization. Emergency response planning for radioactive transport is another critical aspect of the market, with transportation security measures for radioactive materials ensuring the safety of both personnel and the public. Regulatory compliance for radioactive material handling is a significant business function, with incident reporting and investigation procedures and data acquisition and analysis playing essential roles in maintaining compliance. Secure storage facility design and security measures, waste characterization methods, and decontamination techniques for radioactive spills are all vital components of the market. The market's growth can be compared to that of traditional logistics, with a greater emphasis on risk assessment for radioactive material transportation and material accountability systems for nuclear materials. Supply chain management for radioactive materials requires a high level of expertise and specialized training, such as driver training programs for radioactive material transport. Health physics protocols for radioactive material handling ensure the protection of workers and the environment, while secure storage facility design and security measures safeguard against potential threats. In comparison to traditional logistics, the market faces unique challenges, requiring a higher degree of specialized knowledge and regulatory compliance. However, the market's growth is significant, with a recent study estimating a 15% increase in demand for radioactive material transportation services over the next decade. By implementing advanced technologies and best practices, businesses in this market can optimize their operations, reduce risks, and ensure regulatory compliance.

What are the Key Data Covered in this Radioactive Materials Logistics Market Research and Growth Report?

  • What is the expected growth of the Radioactive Materials Logistics Market between 2024 and 2028?

    • USD 1.45 billion, at a CAGR of 5.92%

  • What segmentation does the market report cover?

    • The report is segmented by End-user (Healthcare, Industrial, Agriculture, and Others), Type (Waste materials, Spent nuclear fuel, and Fresh fuel), and Geography (North America, Europe, APAC, South America, and Middle East and Africa)

  • Which regions are analyzed in the report?

    • North America, Europe, APAC, South America, and Middle East and Africa

  • What are the key growth drivers and market challenges?

    • Anticipated growth in number of nuclear power plants, Stringently regulated transportation of radioactive materials

  • Who are the major players in the Radioactive Materials Logistics Market?

    • Agility Public Warehousing Co. K.S.C.P, ALARA Global Logistics Group., Andlauer Healthcare Group Inc., AREVA SA, Bharat Logistic Pvt. Ltd., Cencora Inc., Clean Harbors Inc., CTS LOGISTICS GROUP, Daseke Inc., Deutsche Post AG, DG Air Freight Pvt. Ltd., DSV AS, Edlow International Co., EnergySolutions, FedEx Corp., Hitachi Zosen Corp., Orano, and Waste Control Specialists LLC

We can help! Our analysts can customize this radioactive materials logistics market research report to meet your requirements.

Get in touch

1 Executive Summary

  • 1.1 Market overview
    • Exhibit 01: Executive Summary – Chart on Market Overview
    • Exhibit 02: Executive Summary – Data Table on Market Overview
    • Exhibit 03: Executive Summary – Chart on Global Market Characteristics
    • Exhibit 04: Executive Summary – Chart on Market by Geography
    • Exhibit 05: Executive Summary – Chart on Market Segmentation by End-user
    • Exhibit 06: Executive Summary – Chart on Market Segmentation by Type
    • Exhibit 07: Executive Summary – Chart on Incremental Growth
    • Exhibit 08: Executive Summary – Data Table on Incremental Growth
    • Exhibit 09: Executive Summary – Chart on Vendor Market Positioning

2 Market Landscape

  • 2.1 Market ecosystem
    • Exhibit 10: Parent market
    • Exhibit 11: Market Characteristics

3 Market Sizing

  • 3.1 Market definition
    • Exhibit 12: Offerings of vendors included in the market definition
  • 3.2 Market segment analysis
    • Exhibit 13: Market segments
  • 3.3 Market size 2023
    • 3.4 Market outlook: Forecast for 2023-2028
      • Exhibit 14: Chart on Global - Market size and forecast 2023-2028 ($ billion)
      • Exhibit 15: Data Table on Global - Market size and forecast 2023-2028 ($ billion)
      • Exhibit 16: Chart on Global Market: Year-over-year growth 2023-2028 (%)
      • Exhibit 17: Data Table on Global Market: Year-over-year growth 2023-2028 (%)

    4 Historic Market Size

    • 4.1 Global radioactive material logistics market 2018 - 2022
      • Exhibit 18: Historic Market Size – Data Table on global radioactive material logistics market 2018 - 2022 ($ billion)
    • 4.2 End-user Segment Analysis 2018 - 2022
      • Exhibit 19: Historic Market Size – End-user Segment 2018 - 2022 ($ billion)
    • 4.3 Type Segment Analysis 2018 - 2022
      • Exhibit 20: Historic Market Size – Type Segment 2018 - 2022 ($ billion)
    • 4.4 Geography Segment Analysis 2018 - 2022
      • Exhibit 21: Historic Market Size – Geography Segment 2018 - 2022 ($ billion)
    • 4.5 Country Segment Analysis 2018 - 2022
      • Exhibit 22: Historic Market Size – Country Segment 2018 - 2022 ($ billion)

    5 Five Forces Analysis

    • 5.1 Five forces summary
      • Exhibit 23: Five forces analysis - Comparison between 2023 and 2028
    • 5.2 Bargaining power of buyers
      • Exhibit 24: Chart on Bargaining power of buyers – Impact of key factors 2023 and 2028
    • 5.3 Bargaining power of suppliers
      • Exhibit 25: Bargaining power of suppliers – Impact of key factors in 2023 and 2028
    • 5.4 Threat of new entrants
      • Exhibit 26: Threat of new entrants – Impact of key factors in 2023 and 2028
    • 5.5 Threat of substitutes
      • Exhibit 27: Threat of substitutes – Impact of key factors in 2023 and 2028
    • 5.6 Threat of rivalry
      • Exhibit 28: Threat of rivalry – Impact of key factors in 2023 and 2028
    • 5.7 Market condition
      • Exhibit 29: Chart on Market condition - Five forces 2023 and 2028

    6 Market Segmentation by End-user

    • 6.1 Market segments
      • Exhibit 30: Chart on End-user - Market share 2023-2028 (%)
      • Exhibit 31: Data Table on End-user - Market share 2023-2028 (%)
    • 6.2 Comparison by End-user
      • Exhibit 32: Chart on Comparison by End-user
      • Exhibit 33: Data Table on Comparison by End-user
    • 6.3 Healthcare - Market size and forecast 2023-2028
      • Exhibit 34: Chart on Healthcare - Market size and forecast 2023-2028 ($ billion)
      • Exhibit 35: Data Table on Healthcare - Market size and forecast 2023-2028 ($ billion)
      • Exhibit 36: Chart on Healthcare - Year-over-year growth 2023-2028 (%)
      • Exhibit 37: Data Table on Healthcare - Year-over-year growth 2023-2028 (%)
    • 6.4 Industrial - Market size and forecast 2023-2028
      • Exhibit 38: Chart on Industrial - Market size and forecast 2023-2028 ($ billion)
      • Exhibit 39: Data Table on Industrial - Market size and forecast 2023-2028 ($ billion)
      • Exhibit 40: Chart on Industrial - Year-over-year growth 2023-2028 (%)
      • Exhibit 41: Data Table on Industrial - Year-over-year growth 2023-2028 (%)
    • 6.5 Agriculture - Market size and forecast 2023-2028
      • Exhibit 42: Chart on Agriculture - Market size and forecast 2023-2028 ($ billion)
      • Exhibit 43: Data Table on Agriculture - Market size and forecast 2023-2028 ($ billion)
      • Exhibit 44: Chart on Agriculture - Year-over-year growth 2023-2028 (%)
      • Exhibit 45: Data Table on Agriculture - Year-over-year growth 2023-2028 (%)
    • 6.6 Others - Market size and forecast 2023-2028
      • Exhibit 46: Chart on Others - Market size and forecast 2023-2028 ($ billion)
      • Exhibit 47: Data Table on Others - Market size and forecast 2023-2028 ($ billion)
      • Exhibit 48: Chart on Others - Year-over-year growth 2023-2028 (%)
      • Exhibit 49: Data Table on Others - Year-over-year growth 2023-2028 (%)
    • 6.7 Market opportunity by End-user
      • Exhibit 50: Market opportunity by End-user ($ billion)
      • Exhibit 51: Data Table on Market opportunity by End-user ($ billion)

    7 Market Segmentation by Type

    • 7.1 Market segments
      • Exhibit 52: Chart on Type - Market share 2023-2028 (%)
      • Exhibit 53: Data Table on Type - Market share 2023-2028 (%)
    • 7.2 Comparison by Type
      • Exhibit 54: Chart on Comparison by Type
      • Exhibit 55: Data Table on Comparison by Type
    • 7.3 Waste materials - Market size and forecast 2023-2028
      • Exhibit 56: Chart on Waste materials - Market size and forecast 2023-2028 ($ billion)
      • Exhibit 57: Data Table on Waste materials - Market size and forecast 2023-2028 ($ billion)
      • Exhibit 58: Chart on Waste materials - Year-over-year growth 2023-2028 (%)
      • Exhibit 59: Data Table on Waste materials - Year-over-year growth 2023-2028 (%)
    • 7.4 Spent nuclear fuel - Market size and forecast 2023-2028
      • Exhibit 60: Chart on Spent nuclear fuel - Market size and forecast 2023-2028 ($ billion)
      • Exhibit 61: Data Table on Spent nuclear fuel - Market size and forecast 2023-2028 ($ billion)
      • Exhibit 62: Chart on Spent nuclear fuel - Year-over-year growth 2023-2028 (%)
      • Exhibit 63: Data Table on Spent nuclear fuel - Year-over-year growth 2023-2028 (%)
    • 7.5 Fresh fuel - Market size and forecast 2023-2028
      • Exhibit 64: Chart on Fresh fuel - Market size and forecast 2023-2028 ($ billion)
      • Exhibit 65: Data Table on Fresh fuel - Market size and forecast 2023-2028 ($ billion)
      • Exhibit 66: Chart on Fresh fuel - Year-over-year growth 2023-2028 (%)
      • Exhibit 67: Data Table on Fresh fuel - Year-over-year growth 2023-2028 (%)
    • 7.6 Market opportunity by Type
      • Exhibit 68: Market opportunity by Type ($ billion)
      • Exhibit 69: Data Table on Market opportunity by Type ($ billion)

    8 Customer Landscape

    • 8.1 Customer landscape overview
      • Exhibit 70: Analysis of price sensitivity, lifecycle, customer purchase basket, adoption rates, and purchase criteria

    9 Geographic Landscape

    • 9.1 Geographic segmentation
      • Exhibit 71: Chart on Market share by geography 2023-2028 (%)
      • Exhibit 72: Data Table on Market share by geography 2023-2028 (%)
    • 9.2 Geographic comparison
      • Exhibit 73: Chart on Geographic comparison
      • Exhibit 74: Data Table on Geographic comparison
    • 9.3 North America - Market size and forecast 2023-2028
      • Exhibit 75: Chart on North America - Market size and forecast 2023-2028 ($ billion)
      • Exhibit 76: Data Table on North America - Market size and forecast 2023-2028 ($ billion)
      • Exhibit 77: Chart on North America - Year-over-year growth 2023-2028 (%)
      • Exhibit 78: Data Table on North America - Year-over-year growth 2023-2028 (%)
    • 9.4 Europe - Market size and forecast 2023-2028
      • Exhibit 79: Chart on Europe - Market size and forecast 2023-2028 ($ billion)
      • Exhibit 80: Data Table on Europe - Market size and forecast 2023-2028 ($ billion)
      • Exhibit 81: Chart on Europe - Year-over-year growth 2023-2028 (%)
      • Exhibit 82: Data Table on Europe - Year-over-year growth 2023-2028 (%)
    • 9.5 APAC - Market size and forecast 2023-2028
      • Exhibit 83: Chart on APAC - Market size and forecast 2023-2028 ($ billion)
      • Exhibit 84: Data Table on APAC - Market size and forecast 2023-2028 ($ billion)
      • Exhibit 85: Chart on APAC - Year-over-year growth 2023-2028 (%)
      • Exhibit 86: Data Table on APAC - Year-over-year growth 2023-2028 (%)
    • 9.6 South America - Market size and forecast 2023-2028
      • Exhibit 87: Chart on South America - Market size and forecast 2023-2028 ($ billion)
      • Exhibit 88: Data Table on South America - Market size and forecast 2023-2028 ($ billion)
      • Exhibit 89: Chart on South America - Year-over-year growth 2023-2028 (%)
      • Exhibit 90: Data Table on South America - Year-over-year growth 2023-2028 (%)
    • 9.7 Middle East and Africa - Market size and forecast 2023-2028
      • Exhibit 91: Chart on Middle East and Africa - Market size and forecast 2023-2028 ($ billion)
      • Exhibit 92: Data Table on Middle East and Africa - Market size and forecast 2023-2028 ($ billion)
      • Exhibit 93: Chart on Middle East and Africa - Year-over-year growth 2023-2028 (%)
      • Exhibit 94: Data Table on Middle East and Africa - Year-over-year growth 2023-2028 (%)
    • 9.8 US - Market size and forecast 2023-2028
      • Exhibit 95: Chart on US - Market size and forecast 2023-2028 ($ billion)
      • Exhibit 96: Data Table on US - Market size and forecast 2023-2028 ($ billion)
      • Exhibit 97: Chart on US - Year-over-year growth 2023-2028 (%)
      • Exhibit 98: Data Table on US - Year-over-year growth 2023-2028 (%)
    • 9.9 Russia - Market size and forecast 2023-2028
      • Exhibit 99: Chart on Russia - Market size and forecast 2023-2028 ($ billion)
      • Exhibit 100: Data Table on Russia - Market size and forecast 2023-2028 ($ billion)
      • Exhibit 101: Chart on Russia - Year-over-year growth 2023-2028 (%)
      • Exhibit 102: Data Table on Russia - Year-over-year growth 2023-2028 (%)
    • 9.10 China - Market size and forecast 2023-2028
      • Exhibit 103: Chart on China - Market size and forecast 2023-2028 ($ billion)
      • Exhibit 104: Data Table on China - Market size and forecast 2023-2028 ($ billion)
      • Exhibit 105: Chart on China - Year-over-year growth 2023-2028 (%)
      • Exhibit 106: Data Table on China - Year-over-year growth 2023-2028 (%)
    • 9.11 Australia - Market size and forecast 2023-2028
      • Exhibit 107: Chart on Australia - Market size and forecast 2023-2028 ($ billion)
      • Exhibit 108: Data Table on Australia - Market size and forecast 2023-2028 ($ billion)
      • Exhibit 109: Chart on Australia - Year-over-year growth 2023-2028 (%)
      • Exhibit 110: Data Table on Australia - Year-over-year growth 2023-2028 (%)
    • 9.12 UK - Market size and forecast 2023-2028
      • Exhibit 111: Chart on UK - Market size and forecast 2023-2028 ($ billion)
      • Exhibit 112: Data Table on UK - Market size and forecast 2023-2028 ($ billion)
      • Exhibit 113: Chart on UK - Year-over-year growth 2023-2028 (%)
      • Exhibit 114: Data Table on UK - Year-over-year growth 2023-2028 (%)
    • 9.13 Market opportunity by geography
      • Exhibit 115: Market opportunity by geography ($ billion)
      • Exhibit 116: Data Tables on Market opportunity by geography ($ billion)

    10 Drivers, Challenges, and Trends

    • 10.1 Market drivers
      • 10.2 Market challenges
        • 10.3 Impact of drivers and challenges
          • Exhibit 117: Impact of drivers and challenges in 2023 and 2028
        • 10.4 Market trends

          11 Vendor Landscape

          • 11.1 Overview
            • 11.2 Vendor landscape
              • Exhibit 118: Overview on Criticality of inputs and Factors of differentiation
            • 11.3 Landscape disruption
              • Exhibit 119: Overview on factors of disruption
            • 11.4 Industry risks
              • Exhibit 120: Impact of key risks on business

            12 Vendor Analysis

            • 12.1 Vendors covered
              • Exhibit 121: Vendors covered
            • 12.2 Market positioning of vendors
              • Exhibit 122: Matrix on vendor position and classification
            • 12.3 Agility Public Warehousing Co. K.S.C.P
              • Exhibit 123: Agility Public Warehousing Co. K.S.C.P - Overview
              • Exhibit 124: Agility Public Warehousing Co. K.S.C.P - Business segments
              • Exhibit 125: Agility Public Warehousing Co. K.S.C.P - Key news
              • Exhibit 126: Agility Public Warehousing Co. K.S.C.P - Key offerings
              • Exhibit 127: Agility Public Warehousing Co. K.S.C.P - Segment focus
            • 12.4 ALARA Global Logistics Group.
              • Exhibit 128: ALARA Global Logistics Group. - Overview
              • Exhibit 129: ALARA Global Logistics Group. - Product / Service
              • Exhibit 130: ALARA Global Logistics Group. - Key offerings
            • 12.5 Andlauer Healthcare Group Inc.
              • Exhibit 131: Andlauer Healthcare Group Inc. - Overview
              • Exhibit 132: Andlauer Healthcare Group Inc. - Business segments
              • Exhibit 133: Andlauer Healthcare Group Inc. - Key offerings
              • Exhibit 134: Andlauer Healthcare Group Inc. - Segment focus
            • 12.6 Clean Harbors Inc.
              • Exhibit 135: Clean Harbors Inc. - Overview
              • Exhibit 136: Clean Harbors Inc. - Business segments
              • Exhibit 137: Clean Harbors Inc. - Key offerings
              • Exhibit 138: Clean Harbors Inc. - Segment focus
            • 12.7 CTS LOGISTICS GROUP
              • Exhibit 139: CTS LOGISTICS GROUP - Overview
              • Exhibit 140: CTS LOGISTICS GROUP - Product / Service
              • Exhibit 141: CTS LOGISTICS GROUP - Key offerings
            • 12.8 Daseke Inc.
              • Exhibit 142: Daseke Inc. - Overview
              • Exhibit 143: Daseke Inc. - Business segments
              • Exhibit 144: Daseke Inc. - Key offerings
              • Exhibit 145: Daseke Inc. - Segment focus
            • 12.9 Deutsche Post AG
              • Exhibit 146: Deutsche Post AG - Overview
              • Exhibit 147: Deutsche Post AG - Business segments
              • Exhibit 148: Deutsche Post AG - Key news
              • Exhibit 149: Deutsche Post AG - Key offerings
              • Exhibit 150: Deutsche Post AG - Segment focus
            • 12.10 DG Air Freight Pvt. Ltd.
              • Exhibit 151: DG Air Freight Pvt. Ltd. - Overview
              • Exhibit 152: DG Air Freight Pvt. Ltd. - Product / Service
              • Exhibit 153: DG Air Freight Pvt. Ltd. - Key offerings
            • 12.11 DSV AS
              • Exhibit 154: DSV AS - Overview
              • Exhibit 155: DSV AS - Business segments
              • Exhibit 156: DSV AS - Key offerings
              • Exhibit 157: DSV AS - Segment focus
            • 12.12 Edlow International Co.
              • Exhibit 158: Edlow International Co. - Overview
              • Exhibit 159: Edlow International Co. - Product / Service
              • Exhibit 160: Edlow International Co. - Key offerings
            • 12.13 EnergySolutions
              • Exhibit 161: EnergySolutions - Overview
              • Exhibit 162: EnergySolutions - Product / Service
              • Exhibit 163: EnergySolutions - Key offerings
            • 12.14 FedEx Corp.
              • Exhibit 164: FedEx Corp. - Overview
              • Exhibit 165: FedEx Corp. - Business segments
              • Exhibit 166: FedEx Corp. - Key offerings
              • Exhibit 167: FedEx Corp. - Segment focus
            • 12.15 Hitachi Zosen Corp.
              • Exhibit 168: Hitachi Zosen Corp. - Overview
              • Exhibit 169: Hitachi Zosen Corp. - Business segments
              • Exhibit 170: Hitachi Zosen Corp. - Key offerings
              • Exhibit 171: Hitachi Zosen Corp. - Segment focus
            • 12.16 Orano
              • Exhibit 172: Orano - Overview
              • Exhibit 173: Orano - Business segments
              • Exhibit 174: Orano - Key offerings
              • Exhibit 175: Orano - Segment focus
            • 12.17 Waste Control Specialists LLC
              • Exhibit 176: Waste Control Specialists LLC - Overview
              • Exhibit 177: Waste Control Specialists LLC - Product / Service
              • Exhibit 178: Waste Control Specialists LLC - Key offerings

            13 Appendix

            • 13.1 Scope of the report
              • 13.2 Inclusions and exclusions checklist
                • Exhibit 179: Inclusions checklist
                • Exhibit 180: Exclusions checklist
              • 13.3 Currency conversion rates for US$
                • Exhibit 181: Currency conversion rates for US$
              • 13.4 Research methodology
                • Exhibit 182: Research methodology
                • Exhibit 183: Validation techniques employed for market sizing
                • Exhibit 184: Information sources
              • 13.5 List of abbreviations
                • Exhibit 185: List of abbreviations

              Research Methodology

              Technavio presents a detailed picture of the market by way of study, synthesis, and summation of data from multiple sources. The analysts have presented the various facets of the market with a particular focus on identifying the key industry influencers. The data thus presented is comprehensive, reliable, and the result of extensive research, both primary and secondary.

              INFORMATION SOURCES

              Primary sources

              • Manufacturers and suppliers
              • Channel partners
              • Industry experts
              • Strategic decision makers

              Secondary sources

              • Industry journals and periodicals
              • Government data
              • Financial reports of key industry players
              • Historical data
              • Press releases

              DATA ANALYSIS

              Data Synthesis

              • Collation of data
              • Estimation of key figures
              • Analysis of derived insights

              Data Validation

              • Triangulation with data models
              • Reference against proprietary databases
              • Corroboration with industry experts

              REPORT WRITING

              Qualitative

              • Market drivers
              • Market challenges
              • Market trends
              • Five forces analysis

              Quantitative

              • Market size and forecast
              • Market segmentation
              • Geographical insights
              • Competitive landscape

              Interested in this report?

              Get your sample now to see our research methodology and insights!

              Download Now

              Frequently Asked Questions

              Radioactive Materials Logistics market growth will increase by $ 1.45 bn during 2024-2028.

              The Radioactive Materials Logistics market is expected to grow at a CAGR of 5.92% during 2024-2028.

              Radioactive Materials Logistics market is segmented by End-user( Healthcare, Industrial, Agriculture, Others) Type( Waste materials, Spent nuclear fuel, Fresh fuel, South America, MEA)

              Agility Public Warehousing Co. K.S.C.P, ALARA Global Logistics Group., Andlauer Healthcare Group Inc., AREVA SA, Bharat Logistic Pvt. Ltd., Cencora Inc., Clean Harbors Inc., CTS LOGISTICS GROUP, Daseke Inc., Deutsche Post AG, DG Air Freight Pvt. Ltd., DSV AS, Edlow International Co., EnergySolutions, FedEx Corp., Hitachi Zosen Corp., Orano, Waste Control Specialists LLC are a few of the key vendors in the Radioactive Materials Logistics market.

              North America will register the highest growth rate of 31% among the other regions. Therefore, the Radioactive Materials Logistics market in North America is expected to garner significant business opportunities for the vendors during the forecast period.

              US, China, Australia, Russia, UK

              • Anticipated growth in number of nuclear power plantsSeveral power plants is the driving factor this market.
              • such as nuclear power plants is the driving factor this market.
              • heat water to produce electricity. These power plants use the steam generated from heated water to spin the turbines to generate electricity. Nuclear power plants use the heat generated during nuclear fission to heat water and generate electricity. The growing demand for clean energy is increasing the demand for nuclear power plants. Till August 1 is the driving factor this market.
              • 2023 is the driving factor this market.
              • 93 nuclear reactors are operating at 54 nuclear power plants in 28 states of the US. Of the 54 nuclear power plants in operation is the driving factor this market.
              • 31 have one reactor and two reactors. Countries such as the US is the driving factor this market.
              • France is the driving factor this market.
              • Russia is the driving factor this market.
              • and South Korea are among the top nations for producing electricity by nuclear fission. As per the World Nuclear Association is the driving factor this market.
              • in 2020 is the driving factor this market.
              • nuclear power capacity will increase rapidly is the driving factor this market.
              • with over 50 reactors under construction. About 450 nuclear power reactors are operating in 30 countries is the driving factor this market.
              • with a combined capacity of about 400 GWe. Moreover is the driving factor this market.
              • over 100 nuclear reactors with a gross capacity of 120 is the driving factor this market.
              • 000 MWe are on order or planned is the driving factor this market.
              • and over 300 reactors are proposed. The rising demand for clean energy is driving the demand for nuclear power plants. Countries such as China is the driving factor this market.
              • India is the driving factor this market.
              • Russia is the driving factor this market.
              • and the UAE are investing in a higher number of nuclear power plants. The demand for uranium from countries such as the US and the high number of nuclear power reactors under construction are expected to drive the demand for uranium transportation services is the driving factor this market.
              • thereby propelling the growth of the global radioactive materials logistics market during the forecast period. is the driving factor this market.

              The Radioactive Materials Logistics market vendors should focus on grabbing business opportunities from the Healthcare segment as it accounted for the largest market share in the base year.