
Radioimmunoassay Market Size 2024-2028
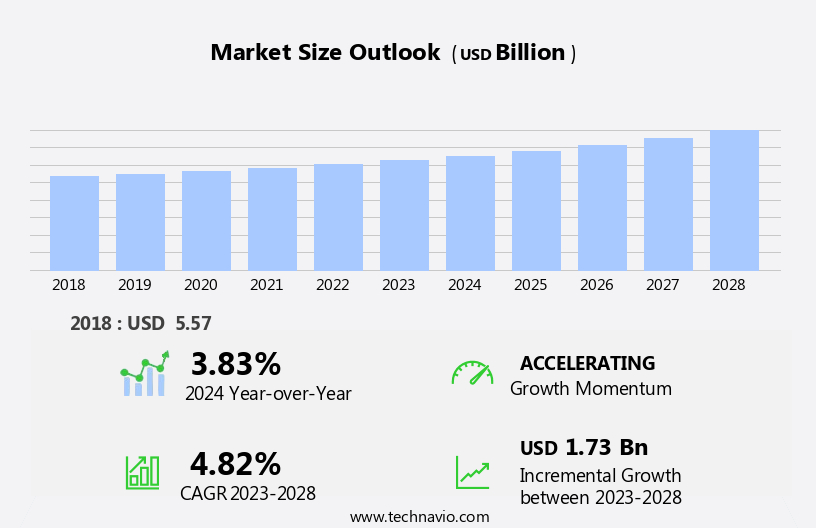
The radioimmunoassay market size is forecast to increase by USD 1.73 billion, at a CAGR of 4.82% between 2023 and 2028.
- The Radioimmunoassay (RIA) market is experiencing significant growth, driven primarily by the expansion of the pharmaceutical and biotechnology industries. These sectors' increasing focus on research and development, particularly in areas such as drug discovery and diagnostics, fuels the demand for RIA technology. Another key trend shaping the market is the shift towards automation and integration of RIA systems, enabling higher throughput, improved accuracy, and reduced labor costs.
- However, the RIA market also faces challenges from alternative technologies, such as ELISA and mass spectrometry, which offer faster and more cost-effective analysis. Companies seeking to capitalize on the opportunities presented by the RIA market must stay abreast of these trends and effectively navigate the competitive landscape to maintain a competitive edge.
What will be the Size of the Radioimmunoassay Market during the forecast period?
Explore in-depth regional segment analysis with market size data - historical 2018-2022 and forecasts 2024-2028 - in the full report.
Request Free Sample
The radioimmunoassay (RIA) market continues to evolve, driven by the persistent demand for accurate and reliable diagnostic procedures in various sectors. This in-vitro assay technique, which involves the binding of a labeled ligand to a specific antibody, is finding extensive applications in the detection and monitoring of chronic diseases. The market encompasses entities such as patient self-testing centers, market players, middle Eastern countries, blood banks, and clinical laboratories, among others. In the healthcare industry, RIA is extensively used in oncology testing, where antigen-antibody complexes play a crucial role in identifying tumour indicators. However, the market's growth is not without challenges.
Restraining factors include the high cost of reagents and the requirement for specialized training. Automated procedures and high-throughput techniques are gaining popularity in ambulatory surgical centers and diagnostic centers to enhance efficiency and reduce errors. The RIA market's size is influenced by the prevalence of chronic diseases, such as cardiovascular diseases and peptic ulcers, and the need for therapeutic drug monitoring in various therapeutic areas. The market's dynamics are further shaped by the development of radioimmunoassay kits and the use of labelled and unlabelled antigens in various applications, including toxicology testing and clinical diagnostics. The market's future growth is expected to be influenced by the ongoing research and development in the field, including the use of stable free radicals and enzyme inhibitors to enhance the sensitivity and specificity of RIA assays.
How is this Radioimmunoassay Industry segmented?
The radioimmunoassay industry research report provides comprehensive data (region-wise segment analysis), with forecasts and estimates in "USD billion" for the period 2024-2028, as well as historical data from 2018-2022 for the following segments.
- Application
- Clinical diagnostics
- Research
- Product
- Reagents kits
- Analyzers
- End-User
- Hospitals
- Diagnostic Laboratories
- Research Institutes
- Pharmaceutical & Biotechnology Companies
- Geography
- North America
- US
- Canada
- Europe
- France
- Germany
- Italy
- UK
- Middle East and Africa
- Egypt
- KSA
- Oman
- UAE
- APAC
- China
- India
- Japan
- South America
- Argentina
- Brazil
- Rest of World (ROW)
- North America
By Application Insights
The clinical diagnostics segment is estimated to witness significant growth during the forecast period.
In the realm of clinical diagnostics, radioimmunoassay (RIA) is a significant technique underpinning various applications, propelling the expansion of the market. Primarily, RIA finds extensive usage in endocrine testing, enabling the precise quantification of hormones such as insulin, thyroid hormones, cortisol, and growth hormones. This facilitates the diagnosis and monitoring of disorders like diabetes, thyroid dysfunction, and adrenal insufficiency in physician offices. RIA's role extends to oncology, where it is employed for tumor marker testing. Tumor markers like prostate-specific antigen (PSA), alpha-fetoprotein (AFP), and carcinoembryonic antigen (CEA) can be accurately measured using RIA, contributing to early cancer detection and surveillance in diagnostic centers and patient self-testing centers.
RIA is also utilized in therapeutic drug monitoring and infectious disease diagnosis, including abused drugs and chronic infections. The market encompasses key players specializing in RIA equipment and reagents, such as Beckman Coulter Inc., and is further applied in ambulatory surgical centers, blood banks, clinical laboratories, home health agencies, and nursing homes. The market's growth is driven by the increasing prevalence of chronic diseases, the demand for automated procedures, and the need for high-throughput procedures in in vitro diagnostics. Despite these growth factors, the market faces restraints due to the expensive nature of RIA reagents and the handling of radioactive material.
The RIA market size is anticipated to grow substantially, with the development of radioimmunoassay kits, unlabelled antigens, and stable free radicals, as well as the emergence of handheld gadgets for on-site testing. The market further caters to applications in cardiovascular disease biomarkers, oncology testing, and toxicology testing.
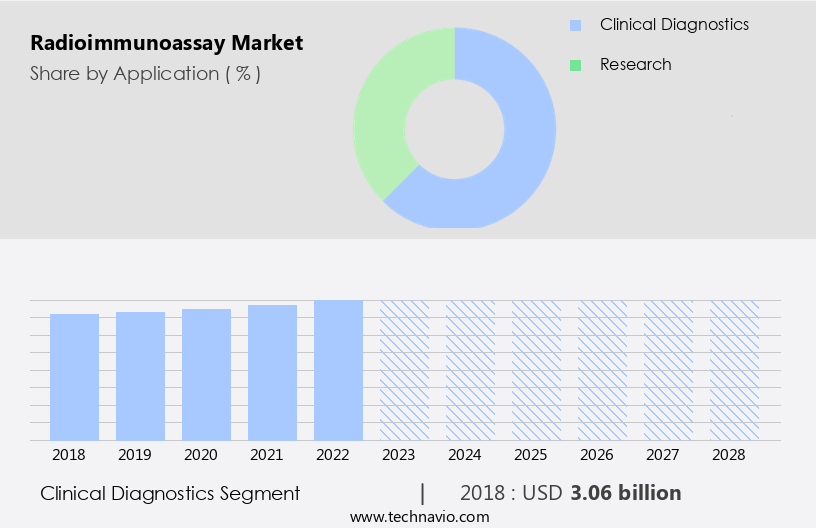
The Clinical diagnostics segment was valued at USD 3.06 billion in 2018 and showed a gradual increase during the forecast period.
Regional Analysis
North America is estimated to contribute 40% to the growth of the global market during the forecast period.Technavio's analysts have elaborately explained the regional trends and drivers that shape the market during the forecast period.
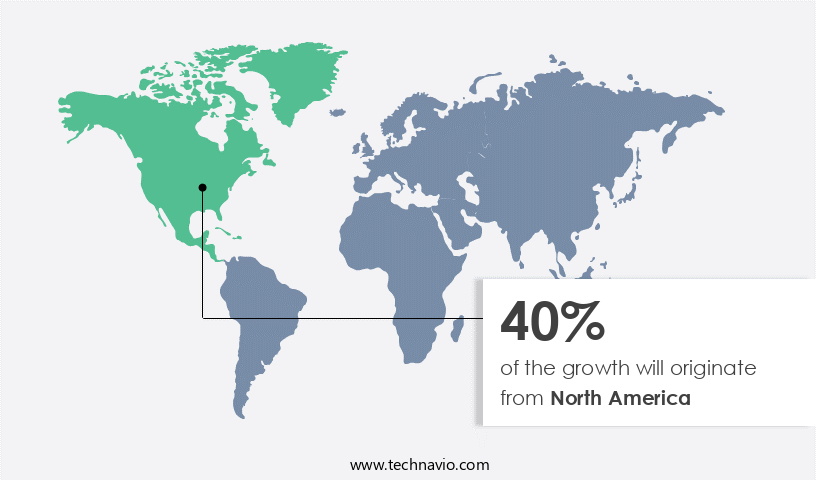
In the market, North America holds a prominent position due to factors such as technological advancements, rising healthcare expenditure, and a high prevalence of chronic diseases. Key players in this region include Beckman Coulter Inc. And other industry leaders, who contribute to the market's growth through their innovative radioimmunoassay equipment and reagents. In the United States and Canada, radioimmunoassay is extensively used in clinical diagnostics, pharmaceutical research, and academic institutions. The increasing incidence of diseases such as diabetes, cancer, and cardiovascular disorders necessitates accurate diagnostic tools, driving market expansion. Furthermore, government initiatives aimed at promoting early disease detection and personalized medicine add impetus to market growth.
This in-vitro assay technique is also used in therapeutic drug monitoring, patient self-testing centers, and diagnostic procedures in various settings, including physician offices, ambulatory surgical centers, blood banks, clinical laboratories, nursing homes, home health agencies, and diagnostic centers. Radioimmunoassay's ability to detect antigen-antibody complexes and measure drug levels, somatostatin content, delta-cell number, and other biomarkers makes it an essential tool in the diagnosis and monitoring of chronic diseases, oncology testing, toxicology testing, and peptic ulcers. However, the market faces restraining factors such as the high cost of expensive reagents and the need for special training for operators. Despite these challenges, the market continues to evolve with automated procedures, high-throughput techniques, and the development of radioimmunoassay kits and unlabelled antigens.
The immunoassays market encompasses various applications, including infectious diseases, abused drugs, and tumour indicators, further expanding the scope of radioimmunoassay's role in healthcare and research.
Market Dynamics
Our researchers analyzed the data with 2023 as the base year, along with the key drivers, trends, and challenges. A holistic analysis of drivers will help companies refine their marketing strategies to gain a competitive advantage.
The market is a significant segment of the diagnostic industry, characterized by its high sensitivity and specificity in detecting various biomolecules. This assay employs radioactive isotopes for labeling antibodies or antigens, enabling precise quantification of analytes in complex biological samples. The market witnesses continuous growth due to its extensive applications in diverse fields, including clinical diagnostics, research, and pharmaceuticals. Key players in this market include automation, reagents, and instruments providers. Radioimmunoassay offers advantages such as high accuracy, low detection limits, and versatility, making it an indispensable tool for disease diagnosis and therapeutic development. This technology's applications span from measuring hormones, drugs, and neurotransmitters to detecting tumor markers and infectious agents, underscoring its importance in healthcare and research. Additionally, advancements in automation and miniaturization are driving innovation and expanding the market's reach.
What are the key market drivers leading to the rise in the adoption of Radioimmunoassay Industry?
- The expansion of the pharmaceutical and biotechnology industries serves as the primary catalyst for market growth in this sector.
- The market experiences continuous growth due to its essential role in the pharmaceutical and biotechnology industries. These sectors heavily utilize radioimmunoassay analyzers for various applications, such as drug development, pharmacokinetic studies, and biomarker analysis. The pharmaceutical industry's increasing focus on research and development for novel therapeutics and improved drugs fuels market expansion. Simultaneously, the biotechnology sector's rapid advancements in biologics, gene therapy, and personalized medicine necessitate the use of radioimmunoassay techniques. Radioimmunoassays are crucial for biotechnological research, enabling the quantification of proteins, antibodies, and biomarkers essential for therapeutic development and disease monitoring. For instance, in immuno-oncology, radioimmunoassays are employed to measure immune checkpoint proteins like PD-L1, contributing to the development of immunotherapies for cancer treatment.
- Chronic diseases, such as diabetes and thyroid disorders, also drive the demand for radioimmunoassay equipment due to their prevalence and the need for diagnostic procedures. Despite the expensive reagents used in radioimmunoassays, the market's potential benefits to healthcare and research justify the investment.
What are the market trends shaping the Radioimmunoassay Industry?
- The market is experiencing a significant shift towards automation and integration in radioimmunoassay (RIA) systems. This trend reflects the growing demand for efficient, accurate, and standardized laboratory processes. RIA systems, which are commonly used for the quantitative measurement of antigens, antibodies, and hormones, can greatly benefit from automation and integration. By automating repetitive tasks and integrating various components of the RIA process, laboratories can improve productivity, reduce errors, and enhance overall workflow.
- The market is experiencing significant growth due to the increasing adoption of automation and integration of assay systems. Laboratories are prioritizing the streamlining of workflows, enhancing efficiency, and minimizing manual errors. Automated radioimmunoassay systems, such as those integrated with laboratory information management systems (LIMS) and other laboratory automation solutions, are becoming increasingly popular. These systems offer walk-away capabilities, enabling continuous sample processing without manual intervention. For instance, Siemens Healthineers AG's IMMULITE 2000 XPi Immunoassay System automates radioimmunoassays, leading to increased laboratory productivity and reduced turnaround times. Additionally, the market is witnessing substantial growth in various industries, including oncology testing and blood banks, due to the importance of accurate and timely diagnosis and monitoring of antigen-antibody complexes in chronic infections.
- Despite these growth factors, restraining factors, such as high capital investment and the need for specialized expertise, may hinder market expansion. However, the benefits of automation and improved efficiency are expected to outweigh these challenges, driving the market forward.
What challenges does the Radioimmunoassay Industry face during its growth?
- The radioimmunoassay industry faces significant competition from emerging technologies, posing a key challenge to its growth.
- The market faces significant competition from alternative diagnostic technologies, such as enzyme-linked immunosorbent assays (ELISA) and chemiluminescence immunoassays (CLIA). Although radioimmunoassays provide high sensitivity and specificity, their use of radioactive labels and complex procedures make them less preferred in some applications. ELISA assays, which do not use radioactive labels, offer comparable performance characteristics and are more environmentally friendly. Additionally, ELISA assays can be easily automated, enabling higher throughput and shorter turnaround times. CLIA assays, which utilize chemiluminescent signals for detection, provide enhanced sensitivity and a broader dynamic range compared to radioimmunoassays. Applications of radioimmunoassays include the detection of abused drugs, infectious diseases, and disease prevalence in various settings, such as diagnostic centers, home health agencies, nursing homes, and toxicology testing.
- In vitro diagnostics using radioimmunoassays play a crucial role in the diagnosis and monitoring of conditions like peptic ulcers. Despite the challenges, the market continues to grow due to the unique advantages it offers in terms of accuracy and specificity.
Exclusive Customer Landscape
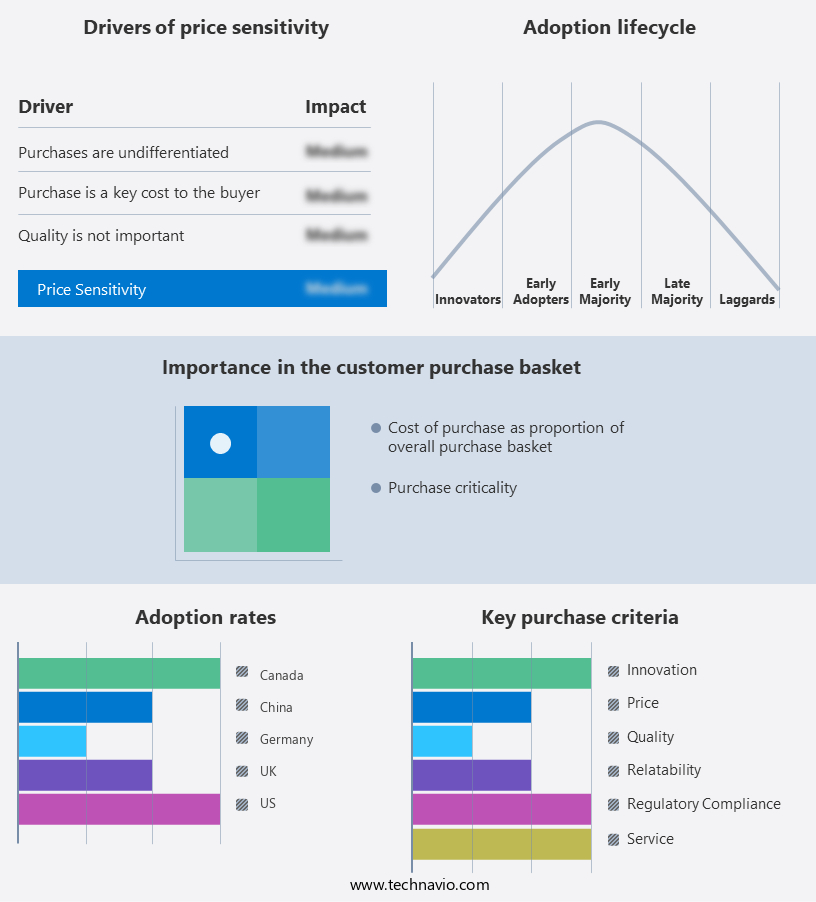
The radioimmunoassay market forecasting report includes the adoption lifecycle of the market, covering from the innovator's stage to the laggard's stage. It focuses on adoption rates in different regions based on penetration. Furthermore, the radioimmunoassay market report also includes key purchase criteria and drivers of price sensitivity to help companies evaluate and develop their market growth analysis strategies.
Customer Landscape
Key Companies & Market Insights
Companies are implementing various strategies, such as strategic alliances, radioimmunoassay market forecast, partnerships, mergers and acquisitions, geographical expansion, and product/service launches, to enhance their presence in the industry.
Abbott Laboratories - The company specializes in radioimmunoassay techniques, including Cortisol Radioimmunoassay (RIA), for quantitative determination of free cortisol in various human samples, such as serum, plasma, urine, and recently, saliva. This analytical method enhances search engine visibility while delivering accurate and informative results, reflecting a research analyst's perspective.
The industry research and growth report includes detailed analyses of the competitive landscape of the market and information about key companies, including:
- Abbott Laboratories
- Beckman Coulter, Inc. (Danaher Corporation)
- Bio-Rad Laboratories, Inc.
- DiaSorin S.p.A.
- FUJIFILM Wako Pure Chemical Corporation
- Izotop
- Labcorp (Laboratory Corporation of America Holdings)
- Merck KGaA
- Ortho Clinical Diagnostics (QuidelOrtho Corporation)
- PerkinElmer Inc.
- Roche Diagnostics (F. Hoffmann-La Roche Ltd.)
- Siemens Healthineers AG
- Thermo Fisher Scientific Inc.
- Tosoh Corporation
- TOSOH Bioscience, Inc.
- Wallac Oy (PerkinElmer Inc.)
- Waters Corporation
- WRUP
- YMAB Bioscience
- ZIVAK
Qualitative and quantitative analysis of companies has been conducted to help clients understand the wider business environment as well as the strengths and weaknesses of key industry players. Data is qualitatively analyzed to categorize companies as pure play, category-focused, industry-focused, and diversified; it is quantitatively analyzed to categorize companies as dominant, leading, strong, tentative, and weak.
Recent Development and News in Radioimmunoassay Market
- In January 2024, Roche Diagnostics announced the launch of its Elecsys 2010 Immunoassay System, featuring improved accuracy and faster turnaround time for Radioimmunoassay (RIA) tests. This innovation aimed to enhance diagnostic efficiency and patient care (Roche Diagnostics press release).
- In March 2024, PerkinElmer entered into a strategic partnership with the University of California, San Francisco (UCSF) to develop new RIA-based assays for research applications. This collaboration aimed to expand PerkinElmer's product portfolio and strengthen its presence in the academic research market (PerkinElmer press release).
- In May 2024, Siemens Healthineers secured regulatory approval from the U.S. Food and Drug Administration (FDA) for its Atellica Solution Immunoassay System. This approval marked a significant milestone in Siemens Healthineers' expansion into the RIA market, offering a more comprehensive diagnostic platform for clinical laboratories (Siemens Healthineers press release).
- In April 2025, DiaSorin announced the acquisition of Bio-Rad Laboratories' Diagnostic Immunoassay Business. This strategic move allowed DiaSorin to expand its product portfolio and strengthen its position as a leading player in the RIA market, with an increased focus on research applications (DiaSorin press release).
Research Analyst Overview
The in-vitro assay technique, a fundamental analytical methodology, plays a significant role In the diagnostic and research fields. This technique relies on the interaction between antigens, proteins, and antibodies, which results in radioactivity. The application of this technique spans various domains, including hormones, drug level determination, and clinical laboratories. The utilization of antigens, proteins, and antibodies In the formation of antigen-antibody complexes is a critical aspect of this technique. In radioimmunoassay (RIA), labelled antigens or unlabelled antigens bind with antibody sites, leading to the formation of a complex. The presence of radioactivity In the complex enables its detection and quantification.
RIA has found extensive use in diverse diagnostic procedures, such as those for abused drugs, cancer, peptic ulcers, neurotransmitters, infections, allergens, and chronic diseases. High-throughput procedures and automated procedures have further expanded the application scope of RIA. The RIA market encompasses a wide range of products, including RIA analyzers, kits, and equipment. The use of radioactive material necessitates stringent safety measures and specialized handling. RIA is employed in numerous industries, including oncology testing, toxicology testing, and various healthcare facilities, such as clinics, diagnostic centers, hospitals, blood banks, home health agencies, nursing homes, ambulatory surgical centers, and patient self-testing centers.
The prevalence of chronic diseases, such as HIV, diabetes, and cardiovascular disease, has driven the demand for RIA In the diagnostic landscape. The sensitivity and specificity of RIA make it an indispensable tool for detecting tumour indicators, peptides, steroids, vitamins, medicines, and other substances. The development of RIA has been marked by numerous advancements, including the introduction of handheld gadgets and the collaboration between various entities to improve the technique's efficiency and accuracy. However, factors such as the high cost of equipment and expensive reagents, licensing, containment, and the need for special training pose challenges to the market's growth.
The RIA market is influenced by various factors, including the prevalence of diseases, the availability of RIA tools and kits, and the impact of competition. The market's size varies across different regions, with North America, Europe, China, and other countries contributing significantly to its growth. The market's landscape is characterized by the presence of various market players and the continuous research and development efforts aimed at improving RIA's performance and applicability. In conclusion, the RIA technique plays a crucial role in various diagnostic and research applications, and its market continues to grow due to the increasing prevalence of chronic diseases and the ongoing advancements In the field.
Despite challenges such as high costs and safety concerns, RIA remains an essential tool for detecting and quantifying various substances, making it a valuable asset In the healthcare industry.
Dive into Technavio's robust research methodology, blending expert interviews, extensive data synthesis, and validated models for unparalleled Radioimmunoassay Market insights. See full methodology.
|
Market Scope |
|
|
Report Coverage |
Details |
|
Page number |
150 |
|
Base year |
2023 |
|
Historic period |
2018-2022 |
|
Forecast period |
2024-2028 |
|
Growth momentum & CAGR |
Accelerate at a CAGR of 4.82% |
|
Market growth 2024-2028 |
USD 1.73 billion |
|
Market structure |
Concentrated |
|
YoY growth 2023-2024(%) |
3.83 |
|
Key countries |
US, Canada, Germany, UK, Italy, France, China, India, Japan, Brazil, Egypt, UAE, Oman, Argentina, KSA, UAE, Brazil, and Rest of World (ROW) |
|
Competitive landscape |
Leading Companies, Market Positioning of Companies, Competitive Strategies, and Industry Risks |
What are the Key Data Covered in this Radioimmunoassay Market Research and Growth Report?
- CAGR of the Radioimmunoassay industry during the forecast period
- Detailed information on factors that will drive the growth and forecasting between 2024 and 2028
- Precise estimation of the size of the market and its contribution of the industry in focus to the parent market
- Accurate predictions about upcoming growth and trends and changes in consumer behaviour
- Growth of the market across North America, Europe, Asia, and Rest of World (ROW)
- Thorough analysis of the market's competitive landscape and detailed information about companies
- Comprehensive analysis of factors that will challenge the radioimmunoassay market growth of industry companies
We can help! Our analysts can customize this radioimmunoassay market research report to meet your requirements.
 RIA -
RIA - 
