Rattan Furniture Market Size and Trends
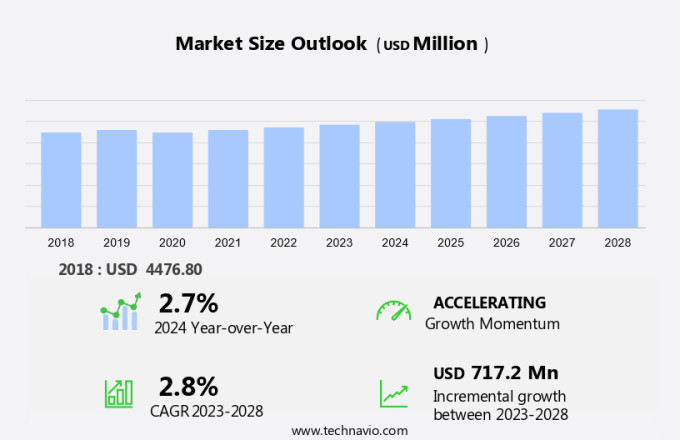
The rattan furniture market size is forecast to increase by USD 717.2 million, at a CAGR of 2.8% between 2023 and 2028. The market is experiencing significant growth due to several key drivers. The increasing preference for outdoor living and the trend towards natural home décor are major factors fueling market expansion. Weaved rattan items, such as charcoal-colored chairs and tables, continue to be popular choices for creating a beach-chic atmosphere. Additionally, the demand for low-cost furnishings has led to the proliferation of multi-brand stores and exclusive outlets. Consumers are increasingly seeking eco-friendly alternatives to traditional materials, making rattan an attractive option due to its natural and sustainable origins. As the market continues to evolve, businesses need to stay informed about these trends and challenges to remain competitive.
The market is witnessing significant growth due to its unique features and increasing popularity as a sustainable alternative to traditional timber. Rattan, derived from the tropical climbing palm, offers numerous benefits for both indoor and outdoor furniture applications. Rattan furniture is gaining traction as a preferred choice for construction materials and home décor due to its water-resistant properties, making it ideal for outdoor living spaces. Its lightweight and flexible structure makes it a popular option for creating authentic, natural textures in both residential and commercial settings. The use of rattan furniture extends beyond seating and weaved items. It is increasingly being adopted for flooring and other construction materials, providing a natural direction for interior design and outdoor living culture. The biodegradable nature of rattan also aligns with the growing trend towards sustainable practices and eco-friendly materials. Despite the increasing demand for rattan furniture, it is essential to ensure sustainable harvesting practices to maintain the long-term viability of the market. A gap assessment can help identify areas for improvement and promote responsible sourcing.
Rattan furniture offers a cost-effective solution for low-cost furnishings while maintaining a high level of aesthetic appeal. Its versatility and compatibility with various design styles, from beach chic to formal interior design, make it a valuable addition to any home or business. The natural textures and resistance to toxic chemicals found in rattan make it a desirable alternative to traditional materials like charcoal. As the market for rattan furniture continues to grow, it is crucial for manufacturers to focus on maintaining the authenticity and quality of their products to meet the evolving demands of consumers. The market presents numerous opportunities for growth and innovation. Its unique features, sustainability, and versatility make it a valuable addition to the construction materials and furniture industries. By focusing on sustainable harvesting practices and maintaining the authenticity of their products, manufacturers can capitalize on the growing demand for rattan furniture and contribute to the ongoing trend toward eco-friendly materials and designs.
Market Segmentation
The market research report provides comprehensive data (region-wise segment analysis), with forecasts and estimates in "USD million" for the period 2024-2028, as well as historical data from 2018 - 2022 for the following segments.
- End-user
- Residential
- Commercial
- Geography
- North America
- Canada
- US
- APAC
- China
- India
- Japan
- South Korea
- Europe
- Germany
- UK
- France
- South America
- Brazil
- Middle East and Africa
- North America
By End-user Insights
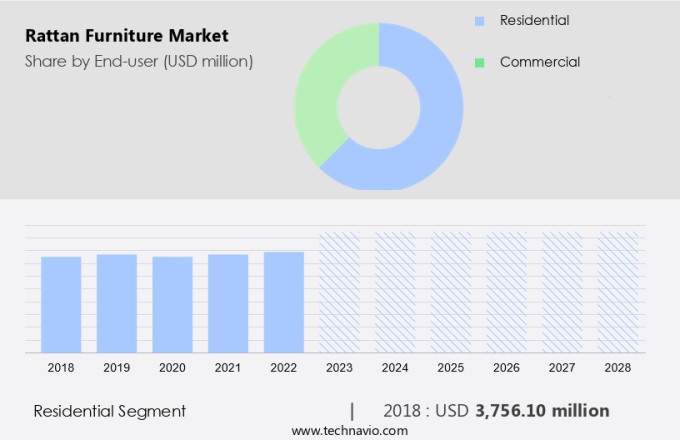
The residential segment is estimated to witness significant growth during the forecast period. The United States market for rattan furniture is witnessing significant expansion due to the rising demand for interior design solutions that are both stylish and sustainable. The natural beauty and lightweight design of rattan furniture make it an ideal choice for American homeowners looking to create inviting and comfortable living spaces. Rattan's versatility allows it to be used in various settings, including dining and living rooms, as well as outdoor patios and gardens. Moreover, the renewable nature of rattan has made it increasingly popular among consumers who prioritize eco-friendly and sustainable products.
Get a glance at the market share of various segments Download the PDF Sample
The residential segment was valued at USD 3.76 billion in 2018. Rattan is sourced from palm trees in a way that does not cause significant harm to the environment, making it an attractive option for those seeking to reduce their carbon footprint. Rattan furniture's appeal extends beyond residential applications. The hospitality industry has also recognized its potential, using it to create unique and inviting spaces for guests. Additionally, rattan baskets, mats, and decorative items have become popular accessories, adding natural warmth and texture to interiors. The market is experiencing growth due to its aesthetic appeal, versatility, and eco-friendly attributes. As consumers continue to prioritize sustainable and natural materials in their purchasing decisions, rattan furniture is poised to remain a popular choice for both residential and commercial applications.
Regional Analysis
For more insights on the market share of various regions Download PDF Sample now!
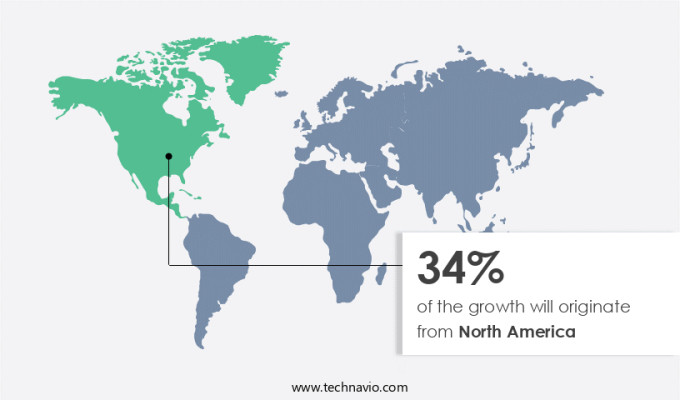
North America is estimated to contribute 34% to the growth of the global market during the forecast period. Technavio's analysts have elaborately explained the regional trends and drivers that shape the market during the forecast period. The North American market is projected to expand at a consistent pace throughout the forecast period. The US, Canada, and Mexico are primary markets in North America, accounting for a significant portion of the demand for rattan furniture. The increasing trend of urbanization and the popularity of co-living spaces in the US are key factors fueling the growth of the market. Moreover, the preference of the millennial population in the US towards rattan furniture is another significant factor contributing to market expansion.
Our researchers analyzed the data with 2023 as the base year, along with the key drivers, trends, and challenges. A holistic analysis of drivers will help companies refine their marketing strategies to gain a competitive advantage.
Rattan Furniture Market Driver
The growing popularity of outdoor and patio furniture is notably driving market growth. The market experiences continuous growth due to the increasing preference for outdoor living spaces. Homeowners are investing in stylish, long-lasting, and comfortable furniture to enhance their patios, gardens, and balconies. Rattan furniture, recognized for its lightweight and water-resistant characteristics, is an excellent alternative to timber for outdoor construction. This trend is fueled by the increasing emphasis on creating functional outdoor areas that serve as extensions of homes. With the growing importance of outdoor spaces for relaxation, entertainment, and social gatherings, rattan furniture's aesthetic appeal and versatility make it an attractive choice.
The poverty eradication efforts in the US have identified livelihood opportunities in the rattan cultivation and furniture industry, further driving market growth. This sector offers a sustainable and eco-friendly solution for outdoor furniture needs while providing income opportunities for local communities. Thus, such factors are driving the growth of the market during the forecast period.
Rattan Furniture Market Trends
Rising emphasis on eco-friendly furniture is the key trend in the market. Eco-friendly furniture, including charcoal-infused and weaved items, has gained significant traction in the market due to growing environmental consciousness. With increasing consumer awareness and regulations, the demand for low-cost, naturally-sourced furnishings is on the rise. Multi-brand stores and exclusive outlets cater to this trend, offering a wide range of beach chic eco-friendly pieces.
Although these items may carry a slightly higher price tag, their appeal lies in their unique aesthetic and sustainable origins. Indonesia, known for its rich natural resources, is a major player in the eco-friendly furniture industry. As this trend continues to grow, it is expected to significantly impact the home décor market. Thus, such trends will shape the growth of the market during the forecast period.
Rattan Furniture Market Challenge
Limited awareness of rattan benefits is the major challenge that affects the growth of the market. The market faces a notable gap in consumer awareness regarding the authentic benefits of this furniture type. Rattan furniture boasts several merits, including durability, lightweight construction, and sustainability through sustainable harvesting of the tropical climbing palm. However, many consumers in the United States remain uneducated about these advantages, leading them to opt for alternatives like wood, metal, or synthetic materials.
This ignorance can hinder market expansion, as potential buyers may overlook rattan furniture as a suitable option for their homes or outdoor spaces. Moreover, the misconception that rattan furniture is outdated or confined to tropical or casual settings further complicates matters. Consumers may also be oblivious to the diverse range of contemporary designs and applications for rattan, restricting its appeal in modern interiors. Hence, the above factors will impede the growth of the market during the forecast period.
Exclusive Customer Landscape
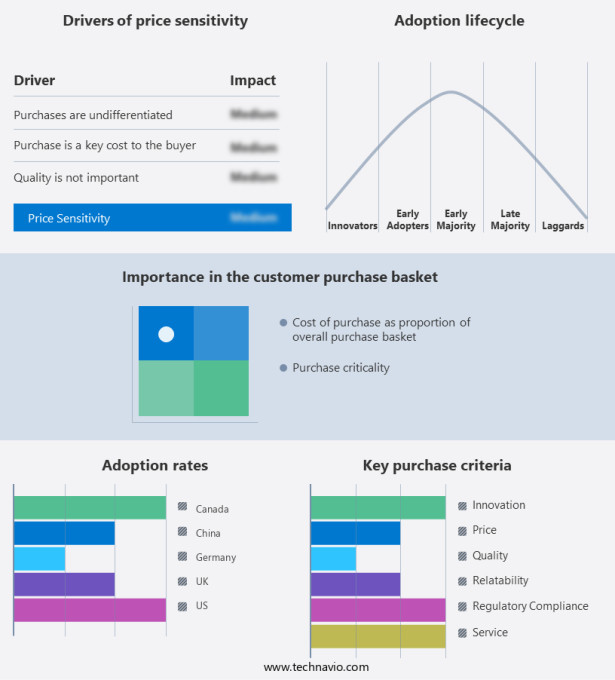
The market forecasting report includes the adoption lifecycle of the market, covering from the innovator's stage to the laggard's stage. It focuses on adoption rates in different regions based on penetration. Furthermore, the report also includes key purchase criteria and drivers of price sensitivity to help companies evaluate and develop their market growth analysis strategies.
Customer Landscape
Key Companies & Market Insights
Companies are implementing various strategies, such as strategic alliances, partnerships, mergers and acquisitions, geographical expansion, and product/service launches, to enhance their presence in the market.
Agio International Co. - The company offers rattan furniture products such as Sydney husk outdoor wicker and concealed cushion sofa.
The market research and growth report also includes detailed analyses of the competitive landscape of the market and information about key companies, including:
- Ashley Global Retail LLC
- Barbeques Galore Aust Pty Ltd.
- Braxton Culler Inc.
- Century Furniture LLC
- Fischer Mobel GmbH
- Hartman Outdoor Products UK Ltd
- Haworth Inc.
- Inter IKEA Holding BV
- Keter Group
- Linya Group Ltd.
- MillerKnoll Inc.
- Modi Workspace Pvt Ltd.
- Roda srl
- Royal Botania NV
- Steelcase Inc.
- TUUCI LLC
- Williams Sonoma Inc.
Qualitative and quantitative analysis of companies has been conducted to help clients understand the wider business environment as well as the strengths and weaknesses of key market players. Data is qualitatively analyzed to categorize companies as pure play, category-focused, industry-focused, and diversified; it is quantitatively analyzed to categorize companies as dominant, leading, strong, tentative, and weak.
Rattan furniture has gained significant popularity in the global market due to its unique blend of natural textures and modern aesthetics. This tropical climbing palm is not only used for creating authentic weaved items like baskets and mats but also as a sustainable alternative to timber for construction materials, flooring, and furniture. The cultivation of rattan provides livelihood opportunities for communities in tropical regions, contributing to poverty eradication. Rattan furniture is known for its lightweight and flexible structure, making it an ideal choice for both indoor and outdoor use. Its water-resistant property makes it perfect for outdoor living culture, offering a natural direction for home décor and hospitality industries. The natural material usage in rattan furniture is biodegradable, making it an eco-friendly option for residential and commercial spaces.
Despite the numerous benefits, there are concerns regarding the use of toxic chemicals in the production of synthetic rattan furniture. Natural rattan furniture, on the other hand, is a healthier and more sustainable choice. The gap assessment between natural and synthetic rattan furniture is crucial in promoting the use of authentic rattan furniture. Multi-brand and exclusive stores have capitalized on the trend, offering a wide range of rattan furniture, from low-cost furnishings to fine arts pieces. The natural material's versatility allows for the creation of various items, including household essentials, decorative items, and even charcoal for cooking. The outdoor leisure areas have become a significant market for rattan furniture, with beach chic and modern minimalist aesthetics driving demand.
|
Market Scope |
|
|
Report Coverage |
Details |
|
Page number |
157 |
|
Base year |
2023 |
|
Historic period |
2018 - 2022 |
|
Forecast period |
2024-2028 |
|
Growth momentum & CAGR |
Accelerate at a CAGR of 2.8% |
|
Market Growth 2024-2028 |
USD 717.2 million |
|
Market structure |
Fragmented |
|
YoY growth 2023-2024(%) |
2.7 |
|
Regional analysis |
North America, APAC, Europe, South America, and Middle East and Africa |
|
Performing market contribution |
North America at 34% |
|
Key countries |
US, China, Germany, UK, Canada, India, Japan, South Korea, France, and Brazil |
|
Competitive landscape |
Leading Companies, Market Positioning of Companies, Competitive Strategies, and Industry Risks |
|
Key companies profiled |
Agio International Co., Ashley Global Retail LLC, Barbeques Galore Aust Pty Ltd., Braxton Culler Inc., Century Furniture LLC, Fischer Mobel GmbH, Hartman Outdoor Products UK Ltd, Haworth Inc., Inter IKEA Holding BV, Keter Group, Linya Group Ltd., MillerKnoll Inc., Modi Workspace Pvt Ltd., Roda srl, Royal Botania NV, Steelcase Inc., TUUCI LLC, and Williams Sonoma Inc. |
|
Market dynamics |
Parent market analysis, Market growth inducers and obstacles, Fast-growing and slow-growing segment analysis, COVID-19 impact and recovery analysis and future consumer dynamics, Market condition analysis for market forecast period |
|
Customization purview |
If our market report has not included the data that you are looking for, you can reach out to our analysts and get segments customized. |
What are the Key Data Covered in this Market Research Report?
- CAGR of the market during the forecast period
- Detailed information on factors that will drive the market growth and forecasting between 2024 and 2028
- Precise estimation of the size of the market and its contribution of the market in focus to the parent market
- Accurate predictions about upcoming market growth and trends and changes in consumer behaviour
- Growth of the market across North America, APAC, Europe, South America, and Middle East and Africa
- Thorough analysis of the market's competitive landscape and detailed information about companies
- Comprehensive analysis of factors that will challenge the growth of market companies
We can help! Our analysts can customize this market research report to meet your requirements. Get in touch


