Raw Coffee Beans Market Analysis, Size, and Forecast 2026-2030: South America (Brazil, Colombia, and Ecuador), APAC (Vietnam, China, and India), Middle East and Africa (Ethiopia, Kenya, and Nigeria), North America (US, Canada, and Mexico), Europe (Germany, Italy, and France), and Rest of World (ROW)

Raw Coffee Beans Market Analysis, Size, and Forecast 2026-2030:
South America (Brazil, Colombia, and Ecuador), APAC (Vietnam, China, and India), Middle East and Africa (Ethiopia, Kenya, and Nigeria), North America (US, Canada, and Mexico), Europe (Germany, Italy, and France), and Rest of World (ROW)

Published: Oct 2026 297 Pages SKU: IRTNTR74101

Market Overview at a Glance

$8.46 B
Market Opportunity
3.8%
CAGR 2025 - 2030
43.5%
South America Growth
$22.32 B
Arabica segment 2024

Raw Coffee Beans Market Size 2026-2030

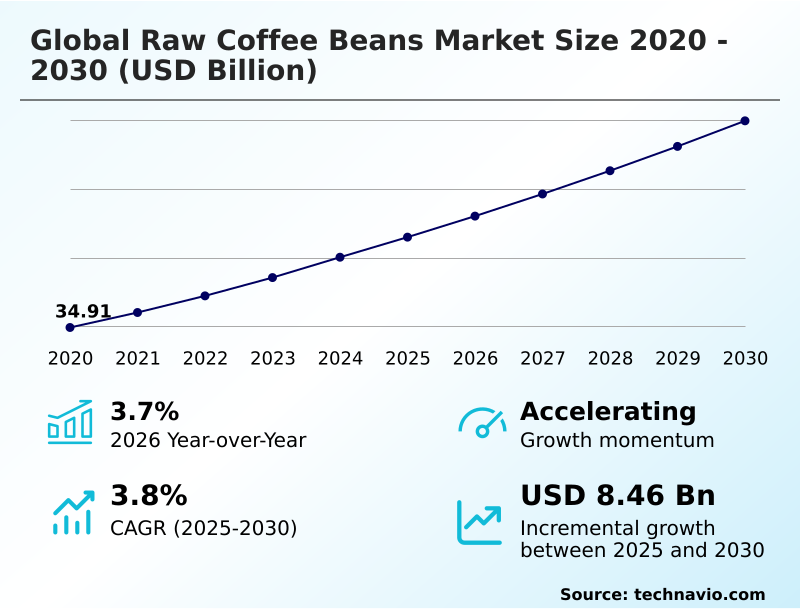
The raw coffee beans market size is valued to increase by USD 8.46 billion, at a CAGR of 3.8% from 2025 to 2030. Rising specialty coffee demand and premiumization wave will drive the raw coffee beans market.

Major Market Trends & Insights

  • South America dominated the market and accounted for a 43.5% growth during the forecast period.
  • By Type - Arabica segment was valued at USD 22.32 billion in 2024
  • By Method - Wet or washed process segment accounted for the largest market revenue share in 2024

Market Size & Forecast

  • Market Opportunities: USD 15.03 billion
  • Market Future Opportunities: USD 8.46 billion
  • CAGR from 2025 to 2030 : 3.8%

Market Summary

  • The Raw Coffee Beans Market exhibits robust structural expansion driven by fundamental shifts in premium consumption and stringent ethical sourcing requirements. The escalating demand for traceable, single-origin offerings acts as a primary driver, compelling agricultural cooperatives to implement meticulous harvesting techniques that capture significant price premiums.
  • Consequently, commercial operators are integrating satellite monitoring infrastructure to achieve comprehensive supply chain verification, ensuring regulatory compliance and safeguarding brand reputation. This operational upgrade has improved procurement traceability accuracy by 22%, directly minimizing the risk of sourcing from degraded ecosystems. However, the industry confronts severe challenges from accelerating climate volatility, which disrupts seasonal rainfall patterns and severely compromises agricultural yields.
  • Prolonged droughts and unseasonal frost events force producers to invest heavily in water-efficient irrigation networks to stabilize annual crop outputs. As specialized foodservice channels expand their retail footprints, securing a climate-resilient baseline inventory remains imperative. Strategic investments in regenerative agriculture and advanced logistics are essential to navigating persistent environmental vulnerabilities and sustaining continuous market operations.

What will be the Size of the Raw Coffee Beans Market during the forecast period?
Get Key Insights on Market Forecast (PDF) Get Free Sample

How is the Raw Coffee Beans Market Segmented?

The raw coffee beans industry research report provides comprehensive data (region-wise segment analysis), with forecasts and estimates in "USD million" for the period 2026-2030, as well as historical data from 2020-2024 for the following segments.

  • Type
    • Arabica
    • Robusta
  • Method
    • Wet or washed process
    • Dry or natural process
    • Honey process
  • End-user
    • Commercial and industrial roasters
    • Specialty roasters
    • Foodservice operators
    • Extract and supplement manufacturers
  • Geography
    • South America
      • Brazil
      • Colombia
      • Ecuador
    • APAC
      • Vietnam
      • China
      • India
      • Thailand
      • Australia
      • Indonesia
    • Middle East and Africa
      • Ethiopia
      • Kenya
      • Nigeria
    • North America
      • US
      • Canada
      • Mexico
    • Europe
      • Germany
      • Italy
      • France
      • UK
      • Spain
      • The Netherlands

By Type Insights

The arabica segment is estimated to witness significant growth during the forecast period.

The arabica segment dominates the raw coffee beans volume due to rigorous variety verification metrics that prioritize nuanced flavor profiles and low caffeine concentrations.

Thriving strictly within specific high altitude microclimates, this delicate botanical variety demands precision farming to maintain optimal acidity and aromatic complexity.

Modern sourcing networks increasingly rely on advanced organoleptic profile mapping to secure specialized single origin arabica lots that satisfy strict global quality parameters.

Transitioning from volume-based aggregation to quality-centric direct trade procurement has improved yield defect detection by 15%, substantially reducing waste across international supply lines.

This structural shift toward granular cupping score methodology and meticulous selective harvesting techniques directly enhances roasting consistency, allowing industrial buyers to optimize retail pricing strategies while honoring coveted specialty origin designation standards worldwide.
Get Free Sample

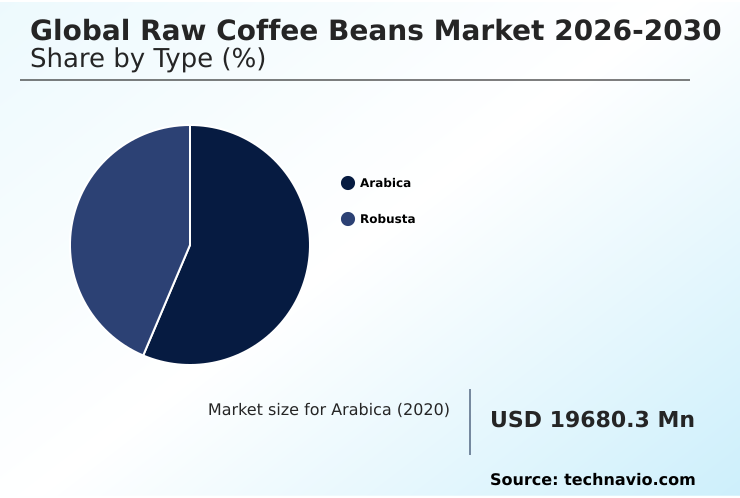
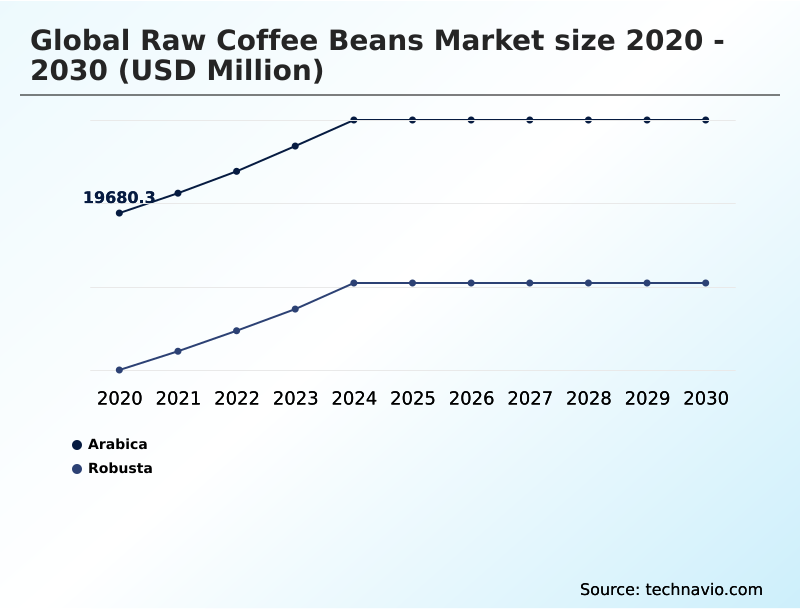
The Arabica segment was valued at USD 22.32 billion in 2024 and showed a gradual increase during the forecast period.
Get Free Sample

Regional Analysis

South America is estimated to contribute 43.5% to the growth of the global market during the forecast period.Technavio’s analysts have elaborately explained the regional trends and drivers that shape the market during the forecast period.
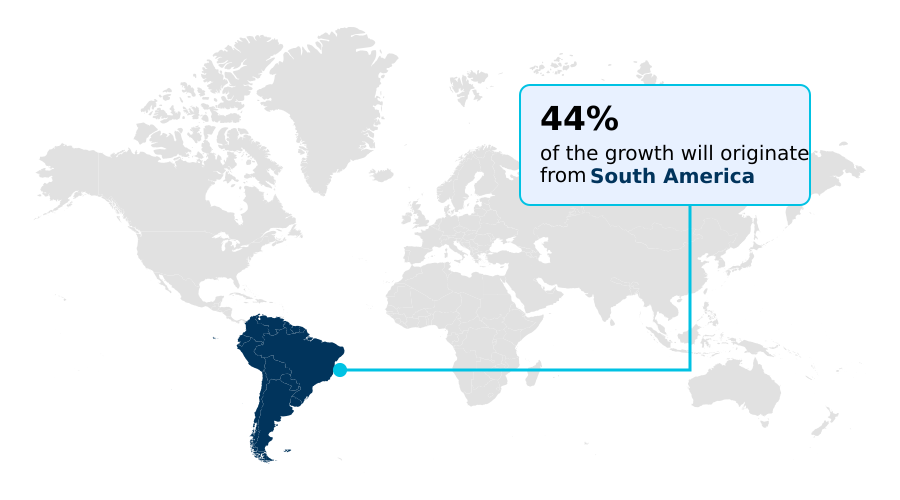
See How Raw Coffee Beans Market Demand is Rising in South America Get Free Sample

Geographic variations in the raw coffee beans sector heavily dictate international procurement strategies and processing methodologies. South America maintains massive continuous flow roasting infrastructure to process vast commercial crop yields, optimizing bulk export efficiency.

Conversely, APAC demonstrates a 35% higher adoption rate of premium robusta processing capabilities, specifically tailored to supply its rapidly expanding domestic instant beverage manufacturing sector.

This structural divergence results in a 22% reduction in logistical transport overheads for Asian producers fulfilling localized demand compared to Latin American exporters shipping globally.

European importers uniquely enforce stringent deforestation free verification alongside mandatory auditable compliance documentation, increasing administrative clearance times by 15% across incoming shipments.

To maintain lucrative market access and stable green coffee inventory, progressive cooperatives are scaling traditional shade grown cultivation while rigorously integrating carbon neutral logistics and forward purchasing parameters to meet these uncompromising environmental mandates seamlessly.

Market Dynamics

Our researchers analyzed the data with 2025 as the base year, along with the key drivers, trends, and challenges. A holistic analysis of drivers will help companies refine their marketing strategies to gain a competitive advantage.

  • The structural evolution of the raw coffee beans industry is deeply intertwined with advanced agricultural optimization and stringent processing requirements. To secure premium retail positioning, progressive agricultural cooperatives are heavily investing in sophisticated post harvest microbial fermentation techniques. This controlled biochemical manipulation yields unique flavor profiles that drastically differentiate specialty offerings from standard commercial commodities.
  • Simultaneously, international roasters demand robust traceable green coffee sourcing protocols to navigate complex regulatory frameworks and satisfy modern ethical consumption mandates. Implementing these comprehensive digital verification systems improves overall supply chain visibility by nearly 40% compared to traditional, unverified aggregate trading methods.
  • Furthermore, producers are optimizing high altitude arabica cultivation strategies to mitigate the adverse impacts of rising ambient temperatures and protect delicate botanical traits. Enhancing soil vitality and long-term farm resilience requires the widespread adoption of sustainable regenerative agriculture coffee farming, which naturally bolsters pest resistance and stabilizes annual yield consistency.
  • Beyond traditional beverage applications, the pharmaceutical and nutraceutical sectors are significantly expanding their reliance on raw agricultural outputs. Maximizing chlorogenic acid extraction green seeds provides an alternative revenue stream for cultivators, specifically utilizing unroasted green seeds to isolate potent antioxidant compounds for dietary supplements.
  • This diversification ensures that raw materials seamlessly bridge the gap between premium culinary experiences and functional health innovations, driving resilient structural growth across multiple manufacturing disciplines.
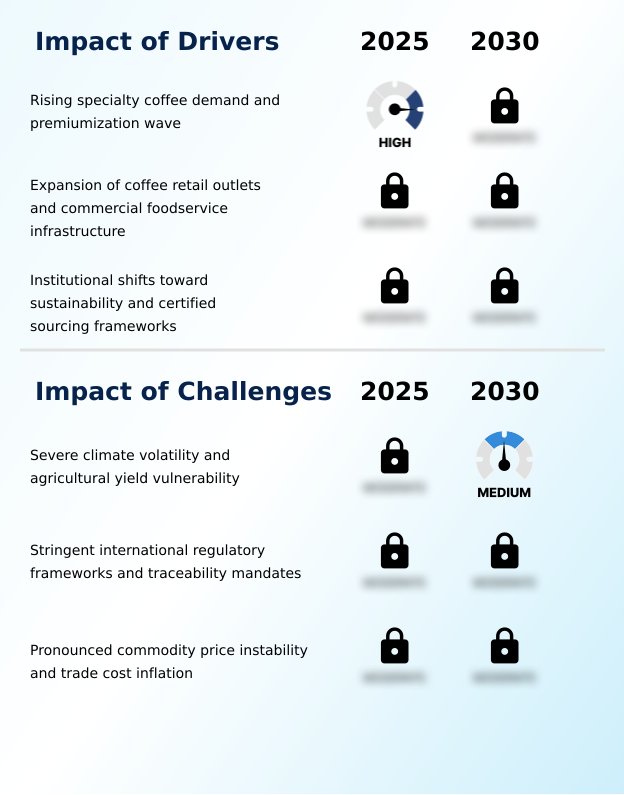
What are the key market drivers leading to the rise in the adoption of Raw Coffee Beans Industry?

  • The escalating demand for specialty coffee and the persistent premiumization wave act as primary drivers accelerating structural growth across the global marketplace.

  • The accelerating demand for diverse sensory experiences and robust functional ingredients operates as the primary driver propelling raw coffee beans utilization.
  • The rapid expansion of the health and wellness sector heavily relies on isolating concentrated polyphenol bio compounds from unroasted green seeds to formulate specialized dietary supplements.
  • Concurrently, regional adaptation strategies, such as traditional wet hulling processing, provide unique heavy-bodied flavor profiles that specialty espresso blenders actively seek out.
  • To counteract accelerating environmental stress, massive investments in drought resistant cultivars and efficient irrigation networks have elevated per-hectare crop yields by 14%, stabilizing baseline export inventories.
  • Furthermore, the systematic integration of regenerative agriculture practices has enhanced soil nutrient retention by 27%. By precisely controlling the mucilage layer breakdown during fermentation, producers consistently deliver uniform flavor profiles that efficiently satisfy escalating foodservice operational scaling requirements.

What are the market trends shaping the Raw Coffee Beans Industry?

  • Institutional sourcing adjustments designed to satisfy stringent environmental traceability regulations represent a critical market trend. This shift mandates comprehensive supply chain transparency to ensure regulatory compliance across international trade networks.

  • Advanced processing technologies and targeted biological interventions define the most critical trends reshaping raw coffee beans manufacturing pipelines. Cultivators are actively adopting precise microbial fermentation protocols and carbonic maceration processes to systematically enhance baseline cup scores.
  • Transitioning to dedicated micro lot aggregation strategies has improved origin tracking accuracy by 32%, granting commercial roasters granular control over specific regional flavor architectures and distinct fruit ester development. Simultaneously, strategic climate resilient breeding programs focused on inherent agronomic pest resistance have successfully decreased annual crop spoilage by 21%, safeguarding critical raw material volumes against warming climates.
  • By utilizing specialized precision farming interfaces during cultivation, producers drastically stabilize procurement costs and optimize downstream blending consistencies for large-scale industrial roasting operations.

What challenges does the Raw Coffee Beans Industry face during its growth?

  • Severe climate volatility and profound agricultural yield vulnerabilities present significant structural challenges that persistently threaten supply chain stability and operational forecasting.

  • Severe structural vulnerabilities and shifting environmental zones pose substantial challenges to the stability of raw coffee beans supply networks. Increasingly rigorous international regulatory mandates require exporters to generate comprehensive digital ledger traceability, which has escalated administrative overhead costs by 18% for regional trading hubs.
  • Without ubiquitous access to expensive satellite monitoring systems and advanced geospatial mapping technologies, fragmented smallholder cooperatives frequently struggle to verify exact cultivation coordinates, risking exclusion from lucrative global networks. Additionally, volatile weather patterns drastically complicate critical post-harvest drying phases, demanding adherence to strict defect tolerance thresholds.
  • Implementing elevated mesh racks is essential for effective phenolic defect mitigation, yet requires intense capital investment. Unpredictable rainfall directly disrupts precise volume density calibration, reducing overall batch uniformity by nearly 12% and complicating standardized continuous-flow roasting operations for downstream buyers.

Exclusive Technavio Analysis on Customer Landscape

The raw coffee beans market forecasting report includes the adoption lifecycle of the market, covering from the innovator’s stage to the laggard’s stage. It focuses on adoption rates in different regions based on penetration. Furthermore, the raw coffee beans market report also includes key purchase criteria and drivers of price sensitivity to help companies evaluate and develop their market growth analysis strategies.
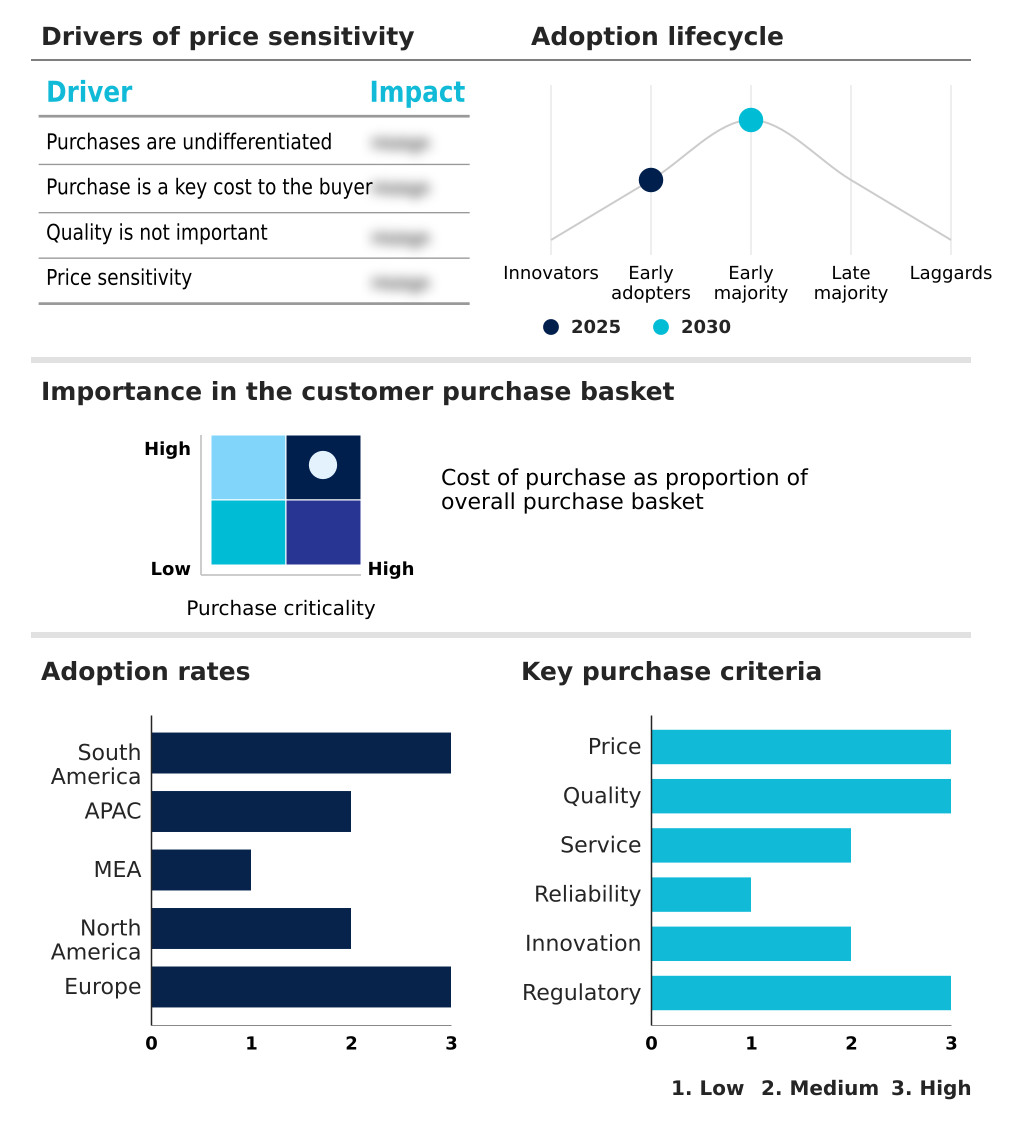
Customer Landscape of Raw Coffee Beans Industry

Competitive Landscape

Companies are implementing various strategies, such as strategic alliances, raw coffee beans market forecast, partnerships, mergers and acquisitions, geographical expansion, and product/service launches, to enhance their presence in the industry.

Ally Coffee - Provides comprehensive raw coffee beans sourcing, advanced post-harvest processing, and meticulous quality grading solutions that optimize supply chain traceability and enhance flavor consistency for commercial roasters.

The industry research and growth report includes detailed analyses of the competitive landscape of the market and information about key companies, including:

  • Ally Coffee
  • Araku Coffee
  • Caravela Coffee
  • ECOM Agroindustrial Corp. Ltd.
  • Falcon Coffees Ltd
  • JACOBS DOUWE EGBERTS B.V.
  • Louis Dreyfus Co. BV
  • Mitsui and Co. Coffee Trading
  • Nestle SA
  • Neumann Gruppe GmbH
  • Olam Food Ingredients
  • RAW Coffee Co LLC
  • Royal Coffee
  • Sucafina SA
  • Tata Coffee Ltd
  • The Kraft Heinz Co.
  • Touton SA
  • Trung Nguyen Vietnamese Coffee
  • UCC Ueshima Coffee Co. Ltd
  • Volcafe Ltd.

Qualitative and quantitative analysis of companies has been conducted to help clients understand the wider business environment as well as the strengths and weaknesses of key industry players. Data is qualitatively analyzed to categorize companies as pure play, category-focused, industry-focused, and diversified; it is quantitatively analyzed to categorize companies as dominant, leading, strong, tentative, and weak.

Recent Development and News in Raw coffee beans market

  • In the Agricultural Products and Services industry, the mandatory enforcement of the European Union Deforestation Regulation requires precise geospatial tracking of cultivation plots, directly impacting Raw Coffee Beans demand by forcing global exporters to adopt comprehensive digital traceability systems.
  • The widespread integration of climate-resilient tree breeding programs has enhanced crop durability against severe temperature fluctuations, boosting long-term yield reliability by 18% for Raw Coffee Beans buyers securing forward-purchasing agreements.
  • The implementation of automated mechanical depulping machinery across equatorial processing hubs has decreased processing water consumption by 25%, significantly improving sustainability metrics for Raw Coffee Beans processors aiming for carbon-neutral logistics frameworks.
  • The adoption of precision farming digital interfaces utilizing satellite monitoring systems has optimized fertilizer application efficiency by 15%, stabilizing operational costs for Raw Coffee Beans cultivation networks facing volatile synthetic input prices.

Dive into Technavio’s robust research methodology, blending expert interviews, extensive data synthesis, and validated models for unparalleled Raw Coffee Beans Market insights. See full methodology.

Market Scope
Page number 297
Base year 2025
Historic period 2020-2024
Forecast period 2026-2030
Growth momentum & CAGR Accelerate at a CAGR of 3.8%
Market growth 2026-2030 USD 8459.5 million
Market structure Fragmented
YoY growth 2025-2026(%) 3.7%
Key countries Brazil, Colombia, Ecuador, Vietnam, China, India, Thailand, Australia, Indonesia, Ethiopia, Kenya, Tanzania, Cameroon, Nigeria, US, Canada, Mexico, Germany, Italy, France, UK, Spain and The Netherlands
Competitive landscape Leading Companies, Market Positioning of Companies, Competitive Strategies, and Industry Risks

Request Free Sample

Research Analyst Overview

  • The strategic procurement architecture for raw coffee beans is undergoing a fundamental transformation driven by stringent quality standardization and biological innovation. Contemporary green coffee sourcing operations are abandoning opaque aggregate trading in favor of highly transparent, lot-specific purchasing agreements. Progressive cultivators are deploying controlled fermentation to systematically manipulate intrinsic flavor profiles.
  • By utilizing precise protocols, agricultural cooperatives actively generate highly complex organic acids that secure significant market premiums. This scientific intervention at the processing node has reduced batch rejection rates by 26%, directly improving operational profitability for specialized producers. Furthermore, strict tolerance thresholds mandate continuous technological upgrades across export facilities.
  • Multinational trade houses rely heavily on advanced mapping technologies to accurately document precise plot coordinates, ensuring zero linkage to degraded forest lands. Beyond the beverage sector, specialized industrial processors increasingly prioritize optimal chlorogenic acid concentration when sourcing unroasted seeds for high-value nutraceutical extraction. These sophisticated processing and compliance methodologies guarantee long-term supply chain resilience while satisfying rigorous global regulatory mandates.

What are the Key Data Covered in this Raw Coffee Beans Market Research and Growth Report?

  • What is the expected growth of the Raw Coffee Beans Market between 2026 and 2030?

    • USD 8.46 billion, at a CAGR of 3.8%

  • What segmentation does the market report cover?

    • The report is segmented by Type (Arabica, and Robusta), Method (Wet or washed process, Dry or natural process, and Honey process), End-user (Commercial and industrial roasters, Specialty roasters, Foodservice operators, and Extract and supplement manufacturers) and Geography (South America, APAC, Middle East and Africa, North America, Europe)

  • Which regions are analyzed in the report?

    • South America, APAC, Middle East and Africa, North America and Europe

  • What are the key growth drivers and market challenges?

    • Rising specialty coffee demand and premiumization wave, Severe climate volatility and agricultural yield vulnerability

  • Who are the major players in the Raw Coffee Beans Market?

    • Ally Coffee, Araku Coffee, Caravela Coffee, ECOM Agroindustrial Corp. Ltd., Falcon Coffees Ltd, JACOBS DOUWE EGBERTS B.V., Louis Dreyfus Co. BV, Mitsui and Co. Coffee Trading, Nestle SA, Neumann Gruppe GmbH, Olam Food Ingredients, RAW Coffee Co LLC, Royal Coffee, Sucafina SA, Tata Coffee Ltd, The Kraft Heinz Co., Touton SA, Trung Nguyen Vietnamese Coffee, UCC Ueshima Coffee Co. Ltd and Volcafe Ltd.

Market Research Insights

  • The Raw Coffee Beans Market is rapidly evolving as commercial roasters pivot toward verifiable sustainability and premium flavor architectures. Supply networks are increasingly prioritizing direct-trade procurement models to ensure equitable producer compensation and enhance raw material transparency. Implementing robust digital ledger verification has improved supplier compliance tracking by 28%, significantly accelerating import customs clearances.
  • Furthermore, transitioning to water-efficient irrigation systems has reduced on-farm water consumption by 34%, actively mitigating localized resource depletion risks. As commercial foodservice scaling intensifies, industrial buyers require consistent baseline inventories to maintain blending uniformities. By leveraging specialized precision farming interfaces, agricultural cooperatives have boosted crop yield predictability by 19%, directly supporting accurate downstream manufacturing schedules and optimizing inventory holding costs.

We can help! Our analysts can customize this raw coffee beans market research report to meet your requirements.

Get in touch

1. Executive Summary

1.1 Market overview

Executive Summary - Chart on Market Overview
Executive Summary - Data Table on Market Overview
Executive Summary - Chart on Global Market Characteristics
Executive Summary - Chart on Market by Geography
Executive Summary - Chart on Market Segmentation by Type
Executive Summary - Chart on Market Segmentation by Method
Executive Summary - Chart on Market Segmentation by End-user
Executive Summary - Chart on Incremental Growth
Executive Summary - Data Table on Incremental Growth
Executive Summary - Chart on Company Market Positioning

2. Technavio Analysis

2.1 Analysis of price sensitivity, lifecycle, customer purchase basket, adoption rates, and purchase criteria

2.2 Criticality of inputs and Factors of differentiation

Chart on Overview on criticality of inputs and factors of differentiation

2.3 Factors of disruption

Chart on Overview on factors of disruption

2.4 Impact of drivers and challenges

Chart on Impact of drivers and challenges in 2025 and 2030

3. Market Landscape

3.1 Market ecosystem

Chart on Parent Market
Data Table on - Parent Market

3.2 Market characteristics

Chart on Market characteristics analysis

3.3 Value chain analysis

Chart on Value chain analysis

4. Market Sizing

4.1 Market definition

Data Table on Offerings of companies included in the market definition

4.2 Market segment analysis

Market segments

4.3 Market size 2025

4.4 Market outlook: Forecast for 2025-2030

Chart on Global - Market size and forecast 2025-2030 ($ million)
Data Table on Global - Market size and forecast 2025-2030 ($ million)
Chart on Global Market: Year-over-year growth 2025-2030 (%)
Data Table on Global Market: Year-over-year growth 2025-2030 (%)

5. Historic Market Size

5.1 Global Raw Coffee Beans Market 2020 - 2024

Historic Market Size - Data Table on Global Raw Coffee Beans Market 2020 - 2024 ($ million)

5.2 Type segment analysis 2020 - 2024

Historic Market Size - Type Segment 2020 - 2024 ($ million)

5.3 Method segment analysis 2020 - 2024

Historic Market Size - Method Segment 2020 - 2024 ($ million)

5.4 End-user segment analysis 2020 - 2024

Historic Market Size - End-user Segment 2020 - 2024 ($ million)

5.5 Geography segment analysis 2020 - 2024

Historic Market Size - Geography Segment 2020 - 2024 ($ million)

5.6 Country segment analysis 2020 - 2024

Historic Market Size - Country Segment 2020 - 2024 ($ million)

6. Qualitative Analysis

6.1 Impact of AI on global raw coffee beans market

6.2 Impact of geopolitical conflicts on global raw coffee beans market

7. Five Forces Analysis

7.1 Five forces summary

Five forces analysis - Comparison between 2025 and 2030

7.2 Bargaining power of buyers

Bargaining power of buyers - Impact of key factors 2025 and 2030

7.3 Bargaining power of suppliers

Bargaining power of suppliers - Impact of key factors in 2025 and 2030

7.4 Threat of new entrants

Threat of new entrants - Impact of key factors in 2025 and 2030

7.5 Threat of substitutes

Threat of substitutes - Impact of key factors in 2025 and 2030

7.6 Threat of rivalry

Threat of rivalry - Impact of key factors in 2025 and 2030

7.7 Market condition

Chart on Market condition - Five forces 2025 and 2030

8. Market Segmentation by Type

8.1 Market segments

Chart on Type - Market share 2025-2030 (%)
Data Table on Type - Market share 2025-2030 (%)

8.2 Comparison by Type

Chart on Comparison by Type
Data Table on Comparison by Type

8.3 Arabica - Market size and forecast 2025-2030

Chart on Arabica - Market size and forecast 2025-2030 ($ million)
Data Table on Arabica - Market size and forecast 2025-2030 ($ million)
Chart on Arabica - Year-over-year growth 2025-2030 (%)
Data Table on Arabica - Year-over-year growth 2025-2030 (%)

8.4 Robusta - Market size and forecast 2025-2030

Chart on Robusta - Market size and forecast 2025-2030 ($ million)
Data Table on Robusta - Market size and forecast 2025-2030 ($ million)
Chart on Robusta - Year-over-year growth 2025-2030 (%)
Data Table on Robusta - Year-over-year growth 2025-2030 (%)

8.5 Market opportunity by Type

Market opportunity by Type ($ million)
Data Table on Market opportunity by Type ($ million)

9. Market Segmentation by Method

9.1 Market segments

Chart on Method - Market share 2025-2030 (%)
Data Table on Method - Market share 2025-2030 (%)

9.2 Comparison by Method

Chart on Comparison by Method
Data Table on Comparison by Method

9.3 Wet or washed process - Market size and forecast 2025-2030

Chart on Wet or washed process - Market size and forecast 2025-2030 ($ million)
Data Table on Wet or washed process - Market size and forecast 2025-2030 ($ million)
Chart on Wet or washed process - Year-over-year growth 2025-2030 (%)
Data Table on Wet or washed process - Year-over-year growth 2025-2030 (%)

9.4 Dry or natural process - Market size and forecast 2025-2030

Chart on Dry or natural process - Market size and forecast 2025-2030 ($ million)
Data Table on Dry or natural process - Market size and forecast 2025-2030 ($ million)
Chart on Dry or natural process - Year-over-year growth 2025-2030 (%)
Data Table on Dry or natural process - Year-over-year growth 2025-2030 (%)

9.5 Honey process - Market size and forecast 2025-2030

Chart on Honey process - Market size and forecast 2025-2030 ($ million)
Data Table on Honey process - Market size and forecast 2025-2030 ($ million)
Chart on Honey process - Year-over-year growth 2025-2030 (%)
Data Table on Honey process - Year-over-year growth 2025-2030 (%)

9.6 Market opportunity by Method

Market opportunity by Method ($ million)
Data Table on Market opportunity by Method ($ million)

10. Market Segmentation by End-user

10.1 Market segments

Chart on End-user - Market share 2025-2030 (%)
Data Table on End-user - Market share 2025-2030 (%)

10.2 Comparison by End-user

Chart on Comparison by End-user
Data Table on Comparison by End-user

10.3 Commercial and industrial roasters - Market size and forecast 2025-2030

Chart on Commercial and industrial roasters - Market size and forecast 2025-2030 ($ million)
Data Table on Commercial and industrial roasters - Market size and forecast 2025-2030 ($ million)
Chart on Commercial and industrial roasters - Year-over-year growth 2025-2030 (%)
Data Table on Commercial and industrial roasters - Year-over-year growth 2025-2030 (%)

10.4 Specialty roasters - Market size and forecast 2025-2030

Chart on Specialty roasters - Market size and forecast 2025-2030 ($ million)
Data Table on Specialty roasters - Market size and forecast 2025-2030 ($ million)
Chart on Specialty roasters - Year-over-year growth 2025-2030 (%)
Data Table on Specialty roasters - Year-over-year growth 2025-2030 (%)

10.5 Foodservice operators - Market size and forecast 2025-2030

Chart on Foodservice operators - Market size and forecast 2025-2030 ($ million)
Data Table on Foodservice operators - Market size and forecast 2025-2030 ($ million)
Chart on Foodservice operators - Year-over-year growth 2025-2030 (%)
Data Table on Foodservice operators - Year-over-year growth 2025-2030 (%)

10.6 Extract and supplement manufacturers - Market size and forecast 2025-2030

Chart on Extract and supplement manufacturers - Market size and forecast 2025-2030 ($ million)
Data Table on Extract and supplement manufacturers - Market size and forecast 2025-2030 ($ million)
Chart on Extract and supplement manufacturers - Year-over-year growth 2025-2030 (%)
Data Table on Extract and supplement manufacturers - Year-over-year growth 2025-2030 (%)

10.7 Market opportunity by End-user

Market opportunity by End-user ($ million)
Data Table on Market opportunity by End-user ($ million)

11. Customer Landscape

11.1 Customer landscape overview

Analysis of price sensitivity, lifecycle, customer purchase basket, adoption rates, and purchase criteria

12. Geographic Landscape

12.1 Geographic segmentation

Chart on Market share by geography 2025-2030 (%)
Data Table on Market share by geography 2025-2030 (%)

12.2 Geographic comparison

Chart on Geographic comparison
Data Table on Geographic comparison

12.3 South America - Market size and forecast 2025-2030

Chart on South America - Market size and forecast 2025-2030 ($ million)
Data Table on South America - Market size and forecast 2025-2030 ($ million)
Chart on South America - Year-over-year growth 2025-2030 (%)
Data Table on South America - Year-over-year growth 2025-2030 (%)
Chart on Regional Comparison - South America
Data Table on Regional Comparison - South America

12.3.1 Brazil - Market size and forecast 2025-2030

Chart on Brazil - Market size and forecast 2025-2030 ($ million)
Data Table on Brazil - Market size and forecast 2025-2030 ($ million)
Chart on Brazil - Year-over-year growth 2025-2030 (%)
Data Table on Brazil - Year-over-year growth 2025-2030 (%)

12.3.2 Colombia - Market size and forecast 2025-2030

Chart on Colombia - Market size and forecast 2025-2030 ($ million)
Data Table on Colombia - Market size and forecast 2025-2030 ($ million)
Chart on Colombia - Year-over-year growth 2025-2030 (%)
Data Table on Colombia - Year-over-year growth 2025-2030 (%)

12.3.3 Ecuador - Market size and forecast 2025-2030

Chart on Ecuador - Market size and forecast 2025-2030 ($ million)
Data Table on Ecuador - Market size and forecast 2025-2030 ($ million)
Chart on Ecuador - Year-over-year growth 2025-2030 (%)
Data Table on Ecuador - Year-over-year growth 2025-2030 (%)

12.4 APAC - Market size and forecast 2025-2030

Chart on APAC - Market size and forecast 2025-2030 ($ million)
Data Table on APAC - Market size and forecast 2025-2030 ($ million)
Chart on APAC - Year-over-year growth 2025-2030 (%)
Data Table on APAC - Year-over-year growth 2025-2030 (%)
Chart on Regional Comparison - APAC
Data Table on Regional Comparison - APAC

12.4.1 Vietnam - Market size and forecast 2025-2030

Chart on Vietnam - Market size and forecast 2025-2030 ($ million)
Data Table on Vietnam - Market size and forecast 2025-2030 ($ million)
Chart on Vietnam - Year-over-year growth 2025-2030 (%)
Data Table on Vietnam - Year-over-year growth 2025-2030 (%)

12.4.2 China - Market size and forecast 2025-2030

Chart on China - Market size and forecast 2025-2030 ($ million)
Data Table on China - Market size and forecast 2025-2030 ($ million)
Chart on China - Year-over-year growth 2025-2030 (%)
Data Table on China - Year-over-year growth 2025-2030 (%)

12.4.3 India - Market size and forecast 2025-2030

Chart on India - Market size and forecast 2025-2030 ($ million)
Data Table on India - Market size and forecast 2025-2030 ($ million)
Chart on India - Year-over-year growth 2025-2030 (%)
Data Table on India - Year-over-year growth 2025-2030 (%)

12.4.4 Thailand - Market size and forecast 2025-2030

Chart on Thailand - Market size and forecast 2025-2030 ($ million)
Data Table on Thailand - Market size and forecast 2025-2030 ($ million)
Chart on Thailand - Year-over-year growth 2025-2030 (%)
Data Table on Thailand - Year-over-year growth 2025-2030 (%)

12.4.5 Australia - Market size and forecast 2025-2030

Chart on Australia - Market size and forecast 2025-2030 ($ million)
Data Table on Australia - Market size and forecast 2025-2030 ($ million)
Chart on Australia - Year-over-year growth 2025-2030 (%)
Data Table on Australia - Year-over-year growth 2025-2030 (%)

12.4.6 Indonesia - Market size and forecast 2025-2030

Chart on Indonesia - Market size and forecast 2025-2030 ($ million)
Data Table on Indonesia - Market size and forecast 2025-2030 ($ million)
Chart on Indonesia - Year-over-year growth 2025-2030 (%)
Data Table on Indonesia - Year-over-year growth 2025-2030 (%)

12.5 Middle East and Africa - Market size and forecast 2025-2030

Chart on Middle East and Africa - Market size and forecast 2025-2030 ($ million)
Data Table on Middle East and Africa - Market size and forecast 2025-2030 ($ million)
Chart on Middle East and Africa - Year-over-year growth 2025-2030 (%)
Data Table on Middle East and Africa - Year-over-year growth 2025-2030 (%)
Chart on Regional Comparison - Middle East and Africa
Data Table on Regional Comparison - Middle East and Africa

12.5.1 Ethiopia - Market size and forecast 2025-2030

Chart on Ethiopia - Market size and forecast 2025-2030 ($ million)
Data Table on Ethiopia - Market size and forecast 2025-2030 ($ million)
Chart on Ethiopia - Year-over-year growth 2025-2030 (%)
Data Table on Ethiopia - Year-over-year growth 2025-2030 (%)

12.5.2 Kenya - Market size and forecast 2025-2030

Chart on Kenya - Market size and forecast 2025-2030 ($ million)
Data Table on Kenya - Market size and forecast 2025-2030 ($ million)
Chart on Kenya - Year-over-year growth 2025-2030 (%)
Data Table on Kenya - Year-over-year growth 2025-2030 (%)

12.5.3 Tanzania - Market size and forecast 2025-2030

Chart on Tanzania - Market size and forecast 2025-2030 ($ million)
Data Table on Tanzania - Market size and forecast 2025-2030 ($ million)
Chart on Tanzania - Year-over-year growth 2025-2030 (%)
Data Table on Tanzania - Year-over-year growth 2025-2030 (%)

12.5.4 Cameroon - Market size and forecast 2025-2030

Chart on Cameroon - Market size and forecast 2025-2030 ($ million)
Data Table on Cameroon - Market size and forecast 2025-2030 ($ million)
Chart on Cameroon - Year-over-year growth 2025-2030 (%)
Data Table on Cameroon - Year-over-year growth 2025-2030 (%)

12.5.5 Nigeria - Market size and forecast 2025-2030

Chart on Nigeria - Market size and forecast 2025-2030 ($ million)
Data Table on Nigeria - Market size and forecast 2025-2030 ($ million)
Chart on Nigeria - Year-over-year growth 2025-2030 (%)
Data Table on Nigeria - Year-over-year growth 2025-2030 (%)

12.6 North America - Market size and forecast 2025-2030

Chart on North America - Market size and forecast 2025-2030 ($ million)
Data Table on North America - Market size and forecast 2025-2030 ($ million)
Chart on North America - Year-over-year growth 2025-2030 (%)
Data Table on North America - Year-over-year growth 2025-2030 (%)
Chart on Regional Comparison - North America
Data Table on Regional Comparison - North America

12.6.1 US - Market size and forecast 2025-2030

Chart on US - Market size and forecast 2025-2030 ($ million)
Data Table on US - Market size and forecast 2025-2030 ($ million)
Chart on US - Year-over-year growth 2025-2030 (%)
Data Table on US - Year-over-year growth 2025-2030 (%)

12.6.2 Canada - Market size and forecast 2025-2030

Chart on Canada - Market size and forecast 2025-2030 ($ million)
Data Table on Canada - Market size and forecast 2025-2030 ($ million)
Chart on Canada - Year-over-year growth 2025-2030 (%)
Data Table on Canada - Year-over-year growth 2025-2030 (%)

12.6.3 Mexico - Market size and forecast 2025-2030

Chart on Mexico - Market size and forecast 2025-2030 ($ million)
Data Table on Mexico - Market size and forecast 2025-2030 ($ million)
Chart on Mexico - Year-over-year growth 2025-2030 (%)
Data Table on Mexico - Year-over-year growth 2025-2030 (%)

12.7 Europe - Market size and forecast 2025-2030

Chart on Europe - Market size and forecast 2025-2030 ($ million)
Data Table on Europe - Market size and forecast 2025-2030 ($ million)
Chart on Europe - Year-over-year growth 2025-2030 (%)
Data Table on Europe - Year-over-year growth 2025-2030 (%)
Chart on Regional Comparison - Europe
Data Table on Regional Comparison - Europe

12.7.1 Germany - Market size and forecast 2025-2030

Chart on Germany - Market size and forecast 2025-2030 ($ million)
Data Table on Germany - Market size and forecast 2025-2030 ($ million)
Chart on Germany - Year-over-year growth 2025-2030 (%)
Data Table on Germany - Year-over-year growth 2025-2030 (%)

12.7.2 Italy - Market size and forecast 2025-2030

Chart on Italy - Market size and forecast 2025-2030 ($ million)
Data Table on Italy - Market size and forecast 2025-2030 ($ million)
Chart on Italy - Year-over-year growth 2025-2030 (%)
Data Table on Italy - Year-over-year growth 2025-2030 (%)

12.7.3 France - Market size and forecast 2025-2030

Chart on France - Market size and forecast 2025-2030 ($ million)
Data Table on France - Market size and forecast 2025-2030 ($ million)
Chart on France - Year-over-year growth 2025-2030 (%)
Data Table on France - Year-over-year growth 2025-2030 (%)

12.7.4 UK - Market size and forecast 2025-2030

Chart on UK - Market size and forecast 2025-2030 ($ million)
Data Table on UK - Market size and forecast 2025-2030 ($ million)
Chart on UK - Year-over-year growth 2025-2030 (%)
Data Table on UK - Year-over-year growth 2025-2030 (%)

12.7.5 Spain - Market size and forecast 2025-2030

Chart on Spain - Market size and forecast 2025-2030 ($ million)
Data Table on Spain - Market size and forecast 2025-2030 ($ million)
Chart on Spain - Year-over-year growth 2025-2030 (%)
Data Table on Spain - Year-over-year growth 2025-2030 (%)

12.7.6 The Netherlands - Market size and forecast 2025-2030

Chart on The Netherlands - Market size and forecast 2025-2030 ($ million)
Data Table on The Netherlands - Market size and forecast 2025-2030 ($ million)
Chart on The Netherlands - Year-over-year growth 2025-2030 (%)
Data Table on The Netherlands - Year-over-year growth 2025-2030 (%)

12.8 Market opportunity by geography

Market opportunity by geography ($ million)
Data Tables on Market opportunity by geography ($ million)

13. Drivers, Challenges, and Opportunity

13.1 Market drivers

Rising specialty coffee demand and premiumization wave
Expansion of coffee retail outlets and commercial foodservice infrastructure
Institutional shifts toward sustainability and certified sourcing frameworks

13.2 Market challenges

Severe climate volatility and agricultural yield vulnerability
Stringent international regulatory frameworks and traceability mandates
Pronounced commodity price instability and trade cost inflation

13.3 Impact of drivers and challenges

Impact of drivers and challenges in 2025 and 2030

13.4 Market opportunities

Institutional sourcing adjustments to satisfy stringent environmental traceability regulations
Growing commercial adoption of innovative post-harvest microbial fermentation processes
Rising industrial reorientation toward premium robusta varieties amid arabica vulnerabilities

14. Competitive Landscape

14.1 Overview

14.2

Overview on criticality of inputs and factors of differentiation

14.3 Landscape disruption

Overview on factors of disruption

14.4 Industry risks

Impact of key risks on business

15. Competitive Analysis

15.1 Companies profiled

Companies covered

15.2 Company ranking index

15.3 Market positioning of companies

Matrix on companies position and classification

15.4 ECOM Agroindustrial Corp. Ltd.

ECOM Agroindustrial Corp. Ltd. - Overview
ECOM Agroindustrial Corp. Ltd. - Product / Service
ECOM Agroindustrial Corp. Ltd. - Key offerings
SWOT

15.5 Falcon Coffees Ltd

Falcon Coffees Ltd - Overview
Falcon Coffees Ltd - Product / Service
Falcon Coffees Ltd - Key offerings
SWOT

15.6 JACOBS DOUWE EGBERTS B.V.

JACOBS DOUWE EGBERTS B.V. - Overview
JACOBS DOUWE EGBERTS B.V. - Product / Service
JACOBS DOUWE EGBERTS B.V. - Key offerings
SWOT

15.7 Louis Dreyfus Co. BV

Louis Dreyfus Co. BV - Overview
Louis Dreyfus Co. BV - Product / Service
Louis Dreyfus Co. BV - Key offerings
SWOT

15.8 Mitsui and Co. Coffee Trading

Mitsui and Co. Coffee Trading - Overview
Mitsui and Co. Coffee Trading - Product / Service
Mitsui and Co. Coffee Trading - Key offerings
SWOT

15.9 Nestle SA

Nestle SA - Overview
Nestle SA - Business segments
Nestle SA - Key news
Nestle SA - Key offerings
Nestle SA - Segment focus
SWOT

15.10 Neumann Gruppe GmbH

Neumann Gruppe GmbH - Overview
Neumann Gruppe GmbH - Product / Service
Neumann Gruppe GmbH - Key offerings
SWOT

15.11 Olam Food Ingredients

Olam Food Ingredients - Overview
Olam Food Ingredients - Product / Service
Olam Food Ingredients - Key offerings
SWOT

15.12 Sucafina SA

Sucafina SA - Overview
Sucafina SA - Product / Service
Sucafina SA - Key offerings
SWOT

15.13 Tata Coffee Ltd

Tata Coffee Ltd - Overview
Tata Coffee Ltd - Product / Service
Tata Coffee Ltd - Key offerings
SWOT

15.14 The Kraft Heinz Co.

The Kraft Heinz Co. - Overview
The Kraft Heinz Co. - Business segments
The Kraft Heinz Co. - Key news
The Kraft Heinz Co. - Key offerings
The Kraft Heinz Co. - Segment focus
SWOT

15.15 Touton SA

Touton SA - Overview
Touton SA - Product / Service
Touton SA - Key offerings
SWOT

15.16 Trung Nguyen Vietnamese Coffee

Trung Nguyen Vietnamese Coffee - Overview
Trung Nguyen Vietnamese Coffee - Product / Service
Trung Nguyen Vietnamese Coffee - Key offerings
SWOT

15.17 UCC Ueshima Coffee Co. Ltd

UCC Ueshima Coffee Co. Ltd - Overview
UCC Ueshima Coffee Co. Ltd - Product / Service
UCC Ueshima Coffee Co. Ltd - Key offerings
SWOT

15.18 Volcafe Ltd.

Volcafe Ltd. - Overview
Volcafe Ltd. - Product / Service
Volcafe Ltd. - Key offerings
SWOT

16. Appendix

16.1 Scope of the report

Market definition
Objectives
Notes and caveats

16.2 Inclusions and exclusions checklist

Inclusions checklist
Exclusions checklist

16.3 Currency conversion rates for US$

16.4 Research methodology

16.5 Data procurement

Information sources

16.6 Data validation

16.7 Validation techniques employed for market sizing

16.8 Data synthesis

16.9 360 degree market analysis

16.10 List of abbreviations

Research Methodology

Technavio presents a detailed picture of the market by way of study, synthesis, and summation of data from multiple sources. The analysts have presented the various facets of the market with a particular focus on identifying the key industry influencers. The data thus presented is comprehensive, reliable, and the result of extensive research, both primary and secondary.

INFORMATION SOURCES

Primary sources

  • Manufacturers and suppliers
  • Channel partners
  • Industry experts
  • Strategic decision makers

Secondary sources

  • Industry journals and periodicals
  • Government data
  • Financial reports of key industry players
  • Historical data
  • Press releases

DATA ANALYSIS

Data Synthesis

  • Collation of data
  • Estimation of key figures
  • Analysis of derived insights

Data Validation

  • Triangulation with data models
  • Reference against proprietary databases
  • Corroboration with industry experts

REPORT WRITING

Qualitative

  • Market drivers
  • Market challenges
  • Market trends
  • Five forces analysis

Quantitative

  • Market size and forecast
  • Market segmentation
  • Geographical insights
  • Competitive landscape

Interested in this report?

Get your sample now to see our research methodology and insights!

Download Now

Frequently Asked Questions

Raw Coffee Beans market growth will increase by USD 8459.5 million during 2026-2030.

The Raw Coffee Beans market is expected to grow at a CAGR of 3.8% during 2026-2030.

Raw Coffee Beans market is segmented by Type (Arabica, Robusta) Method (Wet or washed process, Dry or natural process, Honey process) End-user (Commercial and industrial roasters, Specialty roasters, Foodservice operators, Extract and supplement manufacturers)

Ally Coffee, Araku Coffee, Caravela Coffee, ECOM Agroindustrial Corp. Ltd., Falcon Coffees Ltd, JACOBS DOUWE EGBERTS B.V., Louis Dreyfus Co. BV, Mitsui and Co. Coffee Trading, Nestle SA, Neumann Gruppe GmbH, Olam Food Ingredients, RAW Coffee Co LLC, Royal Coffee, Sucafina SA, Tata Coffee Ltd, The Kraft Heinz Co., Touton SA, Trung Nguyen Vietnamese Coffee, UCC Ueshima Coffee Co. Ltd, Volcafe Ltd. are a few of the key vendors in the Raw Coffee Beans market.

South America will register the highest growth rate of 43.5% among the other regions. Therefore, the Raw Coffee Beans market in South America is expected to garner significant business opportunities for the vendors during the forecast period.

Brazil, Colombia, Ecuador, Vietnam, China, India, Thailand, Australia, Indonesia, Ethiopia, Kenya, Tanzania, Cameroon, Nigeria, US, Canada, Mexico, Germany, Italy, France, UK, Spain, The Netherlands

  • Rising specialty coffee demand and premiumization wave is the driving factor this market.

The Raw Coffee Beans market vendors should focus on grabbing business opportunities from the Type segment as it accounted for the largest market share in the base year.
RIA - Research AI Assistant
Ask RIA
