Ready Mix Concrete Batching Plant Market Analysis, Size, and Forecast 2026-2030: APAC (China, India, and Japan), Middle East and Africa (Saudi Arabia, UAE, and South Africa), Europe (Germany, UK, and France), South America (Brazil, Argentina, and Chile), North America (US, Canada, and Mexico), and Rest of World (ROW)

Ready Mix Concrete Batching Plant Market Analysis, Size, and Forecast 2026-2030:
APAC (China, India, and Japan), Middle East and Africa (Saudi Arabia, UAE, and South Africa), Europe (Germany, UK, and France), South America (Brazil, Argentina, and Chile), North America (US, Canada, and Mexico), and Rest of World (ROW)

Published: May 2026 309 Pages SKU: IRTNTR40704

Market Overview at a Glance

$158.6 Mn
Market Opportunity
4.7%
CAGR 2025 - 2030
55.1%
APAC Growth
$326.1 Mn
Residential construction segment 2024

Ready Mix Concrete Batching Plant Market Size 2026-2030

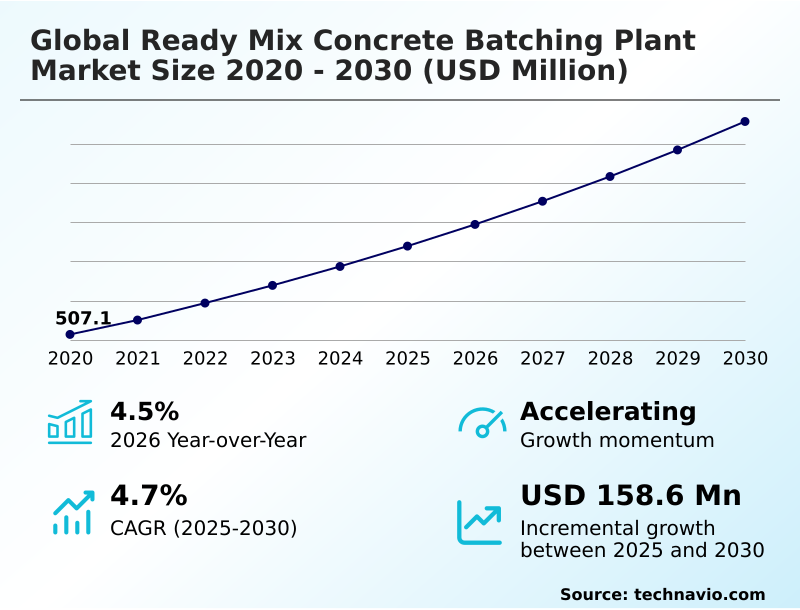
The ready mix concrete batching plant market size is valued to increase by USD 158.6 million, at a CAGR of 4.7% from 2025 to 2030. Accelerating global public expenditure on large-scale infrastructure projects will drive the ready mix concrete batching plant market.

Major Market Trends & Insights

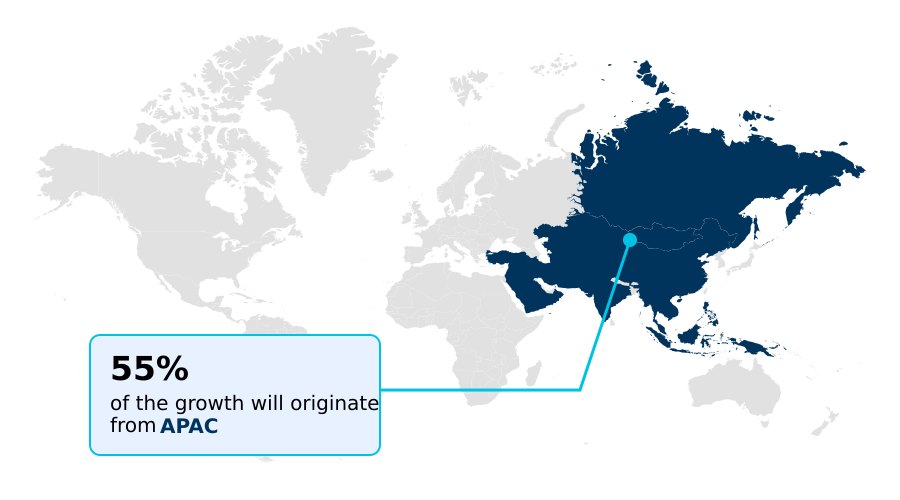
  • APAC dominated the market and accounted for a 55.1% growth during the forecast period.
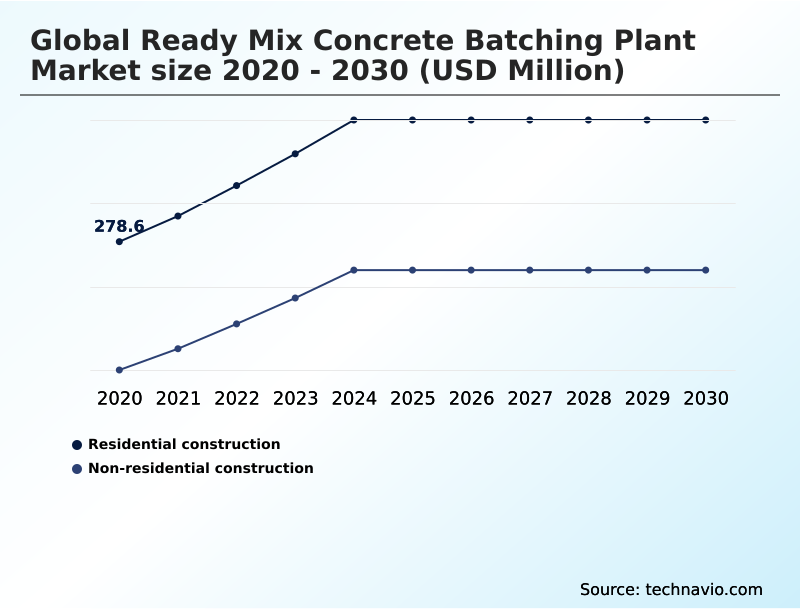
  • By End-user - Residential construction segment was valued at USD 326.1 million in 2024
  • By Type - Dry batch concrete plant segment accounted for the largest market revenue share in 2024

Market Size & Forecast

  • Market Opportunities: USD 271 million
  • Market Future Opportunities: USD 158.6 million
  • CAGR from 2025 to 2030 : 4.7%

Market Summary

  • The Ready Mix Concrete Batching Plant sector exhibits robust operational momentum driven by rapid urbanization and the industrialization of building processes. Centralized production facilities are replacing fragmented manual mixing to ensure absolute material uniformity across massive infrastructure initiatives.
  • A major driver for this market is the surge in public expenditure on transportation networks, which necessitates high-throughput automated machinery to meet continuous pouring schedules. Conversely, strict environmental mandates limiting industrial particulate emissions create a substantial challenge, forcing operators to install complex filtration and water recycling systems.
  • In a practical business scenario, modern fleet operators are integrating predictive maintenance tracking within their mixing plants to monitor mechanical wear and predict motor failures before catastrophic breakdowns occur. This proactive digital management strategy has led to a 20% improvement in overall equipment effectiveness by minimizing unplanned downtime.
  • Consequently, the reliance on intelligent sensors and enclosed eco-friendly designs continues to shape procurement decisions, ensuring that concrete production meets rigorous structural engineering benchmarks while aligning with mandatory decarbonization goals.

What will be the Size of the Ready Mix Concrete Batching Plant Market during the forecast period?

Get Key Insights on Market Forecast (PDF) Get Free Sample

How is the Ready Mix Concrete Batching Plant Market Segmented?

The ready mix concrete batching plant industry research report provides comprehensive data (region-wise segment analysis), with forecasts and estimates in "USD million" for the period 2026-2030, as well as historical data from 2020-2024 for the following segments.

  • End-user
    • Residential construction
    • Non-residential construction
  • Type
    • Dry batch concrete plant
    • Wet batch concrete plant
  • Product type
    • Crushed stone
    • River gravel
    • Slag
  • Application
    • Infrastructure
    • Mining
    • Others
  • Geography
    • APAC
      • China
      • India
      • Japan
      • South Korea
      • Australia
      • Indonesia
    • Middle East and Africa
      • Saudi Arabia
      • UAE
      • South Africa
      • Egypt
      • Turkey
    • Europe
      • Germany
      • UK
      • France
      • Italy
      • Spain
    • South America
      • Brazil
      • Argentina
      • Chile
    • North America
      • US
      • Canada
      • Mexico

By End-user Insights

The residential construction segment is estimated to witness significant growth during the forecast period.

The residential construction segment within the Ready Mix Concrete Batching Plant domain demonstrates robust structural evolution driven by accelerated urbanization and prefabricated building methods.

Homebuilders increasingly rely on automated centralized facilities to achieve the uniform self-compacting concrete consistency required for massive housing estates. The deployment of a modular batching unit enables a compact site deployment, significantly optimizing material flow for suburban real estate corridors.

A transition toward a dry-batch configuration, paired with specialized delivery vehicles, facilitates extended delivery ranges without compromising the concrete slump. Integration of cloud-based dispatch software has improved logistical coordination, resulting in a 15% reduction in delivery delays.

Advanced admixture dosing systems and thermal process controls ensure precise formulation, allowing developers to utilize ultra-high-performance concrete and high-load bearing concrete for critical load-bearing foundations while seamlessly managing wet-mix integration directly from the aggregate hopper.

Get Free Sample

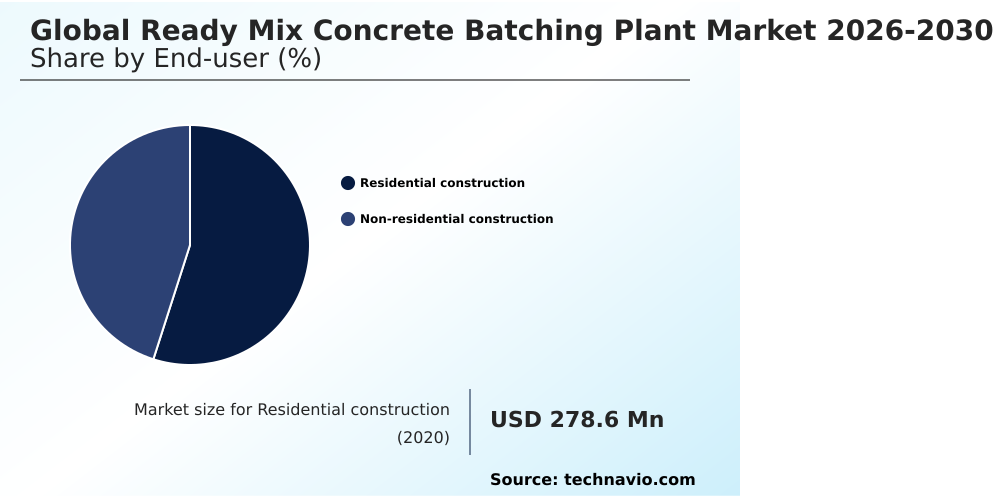
The Residential construction segment was valued at USD 326.1 million in 2024 and showed a gradual increase during the forecast period.

Get Free Sample

Regional Analysis

APAC is estimated to contribute 55.1% to the growth of the global market during the forecast period.Technavio’s analysts have elaborately explained the regional trends and drivers that shape the market during the forecast period.

See How Ready Mix Concrete Batching Plant Market Demand is Rising in APAC Get Free Sample

The geographic distribution of the Ready Mix Concrete Batching Plant domain highlights distinct operational priorities between APAC and Europe.

APAC demonstrates aggressive volume scaling, utilizing a high-capacity stationary plant footprint equipped with robust electronic weighing sensors to support massive smart city expansions. This intense production focus has improved material precision by 14% across high-density urban corridors.

Conversely, Europe prioritizes strict ecological compliance, accelerating the adoption of low-carbon concrete formulations and advanced localized particulate mitigation technologies.

European facilities have achieved a 22% improvement in energy efficiency compared to their Asian counterparts by embedding digital material tracking to strictly monitor embodied carbon.

Furthermore, regional climatic differences force APAC operators to invest heavily in concrete workability optimization to manage tropical heat, whereas European manufacturers install complex advanced air filtration and wastewater reclamation systems to navigate dense, environmentally regulated metropolitan zones seamlessly.

Market Dynamics

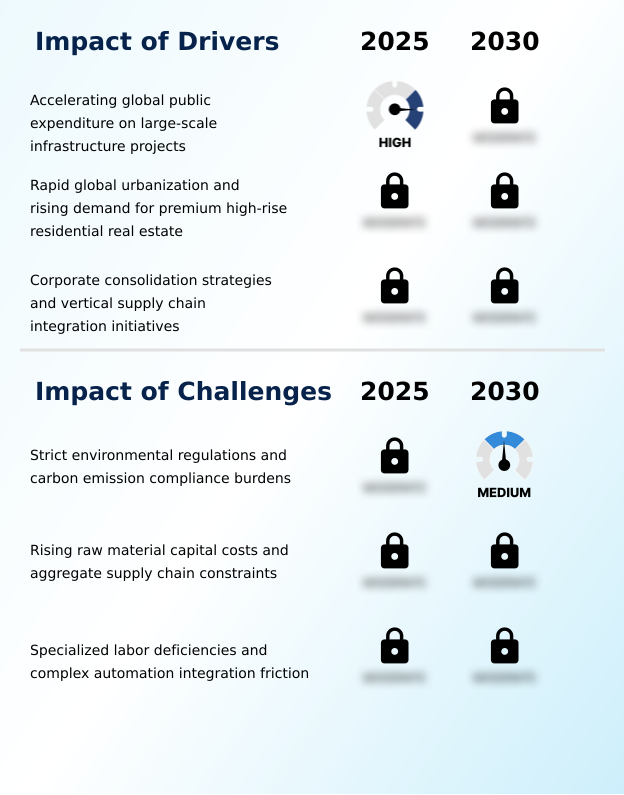
Our researchers analyzed the data with 2025 as the base year, along with the key drivers, trends, and challenges. A holistic analysis of drivers will help companies refine their marketing strategies to gain a competitive advantage.

  • The operational framework of the Ready Mix Concrete Batching Plant landscape is undergoing a critical digital transformation as construction stakeholders demand heightened structural consistency and resource efficiency. Modern infrastructure projects rely heavily on automated twin-shaft concrete mixer integration, which provides superior homogenization and significantly shortens the mixing cycle compared to legacy equipment.
  • To combat the variability of raw material quality, operators are widely adopting a real-time aggregate moisture tracking system. This technology allows for dynamic adjustments to the water-to-cement ratio, resulting in a 15% improvement in structural yield consistency and a noticeable reduction in rejected deliveries.
  • As sustainability protocols become mandatory, the capability for low-carbon supplementary cementitious material blending has transitioned from an optional feature to an absolute operational necessity. Incorporating industrial byproducts requires precise dosing mechanisms to ensure that green building certifications are seamlessly met.
  • Concurrently, agile logistics strategies are fueling a rise in modular dry batch plant deployment, particularly for remote highway expansions and decentralized renewable energy infrastructure where permanent installations are not viable. To safeguard these continuous production cycles, fleet managers are leveraging predictive maintenance in batching software, allowing them to anticipate mechanical wear and schedule interventions without disrupting massive concrete pouring phases.
  • This holistic integration of advanced sensors and flexible plant architecture ensures that manufacturers can navigate fluctuating raw material constraints while maintaining absolute adherence to rigorous engineering benchmarks.

What are the key market drivers leading to the rise in the adoption of Ready Mix Concrete Batching Plant Industry?

  • Accelerating global public expenditure on large-scale infrastructure projects serves as a primary driver for the expansion of the market.

  • A massive surge in highly complex, government-funded urban infrastructure serves as the primary catalyst accelerating the Ready Mix Concrete Batching Plant environment.
  • Structural engineering requirements now demand precise inclusion of advanced binders, such as ground granulated blast furnace slag, to guarantee long-term asset durability.
  • The ability to maintain an optimal dynamic water-to-cement ratio through digital oversight enables concrete producers to successfully secure lucrative certified ecological footprint reports.
  • By adopting these sophisticated systems, operators have enhanced their operational resource efficiency, lowering freshwater consumption by 35% through the implementation of closed-loop water recycling mechanisms.
  • Furthermore, automated tracking empowers facilities to generate exact sustainability documentation, improving audit compliance speeds by over 20%. This technological dependency continuously drives heavy capital investment into agile, high-precision mixing machinery.

What are the market trends shaping the Ready Mix Concrete Batching Plant Industry?

  • The systemic proliferation of artificial intelligence and internet of things plant monitoring represents a transformative market trend. This digital integration enables dynamic operational adjustments and real-time equipment diagnostics to enhance production efficiency.

  • The accelerated transition toward intelligent automation represents a defining trend within the Ready Mix Concrete Batching Plant ecosystem, fundamentally altering how industrial materials are processed. Centralized facilities are actively migrating toward clean energy manufacturing to comply with stringent metropolitan environmental ordinances.
  • This shift is accompanied by the deployment of real-time aggregate monitoring, which continuously evaluates input humidity to dynamically alter mixing parameters. Consequently, operators utilizing these advanced diagnostics have improved batch precision by 16%, virtually eliminating the incidence of sub-standard concrete rejection. Furthermore, the integration of automated raw material replenishment seamlessly coordinates silo inventory with incoming supply logistics, mitigating disruptive bottlenecks.
  • By relying on high-intensity mixing logic and predictive maintenance scheduling, plant managers have successfully reduced unexpected mechanical downtime by 28%.

What challenges does the Ready Mix Concrete Batching Plant Industry face during its growth?

  • Strict environmental regulations and carbon emission compliance burdens present significant operational challenges that constrain industry growth.

  • Escalating regulatory frameworks and severe raw material volatility present formidable barriers within the Ready Mix Concrete Batching Plant operational landscape. Fluctuating availability of high-quality fine aggregates and essential industrial byproducts like fly ash directly compromises the consistency of daily batch outputs.
  • Modifying legacy equipment to accommodate complex chemical additive integration requires significant capital expenditure, often straining the margins of independent concrete suppliers. Moreover, ensuring exact formulation tolerances requires the constant recalibration of delicate load cells and the continuous upkeep of every aggregate moisture sensor.
  • When operating in extreme climates, the mandatory integration of chilled water injection adds substantial energy overhead, increasing baseline production costs by up to 14%. Equipment malfunctions within a pressurized cement silo can abruptly halt production, resulting in a 25% drop in daily dispatch efficiency.

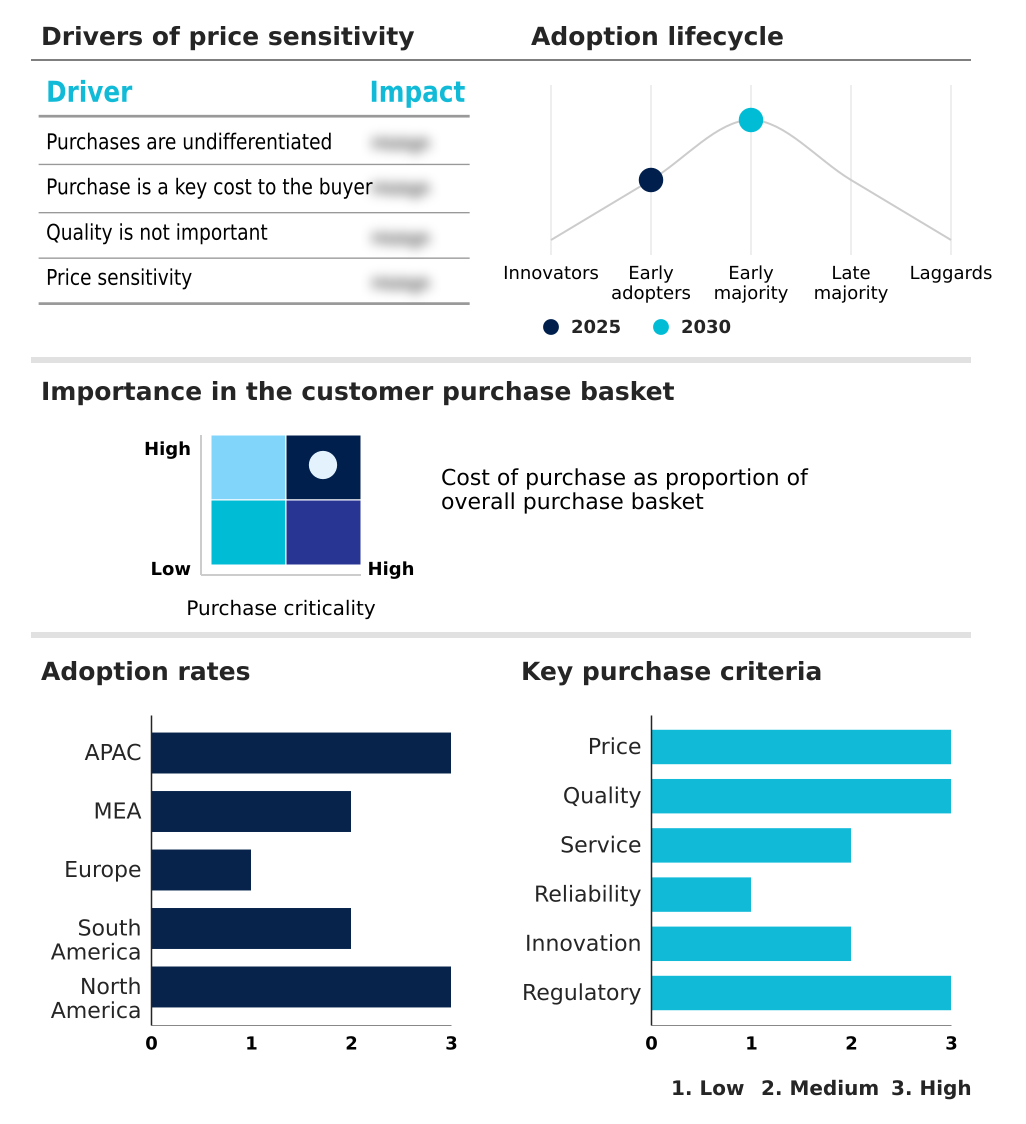
Exclusive Technavio Analysis on Customer Landscape

The ready mix concrete batching plant market forecasting report includes the adoption lifecycle of the market, covering from the innovator’s stage to the laggard’s stage. It focuses on adoption rates in different regions based on penetration. Furthermore, the ready mix concrete batching plant market report also includes key purchase criteria and drivers of price sensitivity to help companies evaluate and develop their market growth analysis strategies.

Customer Landscape of Ready Mix Concrete Batching Plant Industry

Competitive Landscape

Companies are implementing various strategies, such as strategic alliances, ready mix concrete batching plant market forecast, partnerships, mergers and acquisitions, geographical expansion, and product/service launches, to enhance their presence in the industry.

AIMIX Group - The unified product portfolio delivers highly automated ready mix concrete batching plant solutions, integrating advanced mixing equipment and precise dosing technologies to maximize operational efficiency and structural material consistency.

The industry research and growth report includes detailed analyses of the competitive landscape of the market and information about key companies, including:

  • AIMIX Group
  • Ammann Group
  • Astec Industries Inc.
  • BHS-Sonthofen GmbH
  • Camelway Machinery
  • CEMEX SAB de CV
  • CIFA S.p.A.
  • CONSTMACH
  • Liebherr International AG
  • Lintec and Linnhoff
  • MEKA
  • Nisbau GmbH
  • Polygonmach
  • Sany Heavy Industry Co. Ltd.
  • SCHWING GmbH
  • Shantui Construction Machinery
  • SIMEM S.p.A.
  • Stephens MFG. Co.
  • Terex Corp.
  • The Vince Hagan Co.

Qualitative and quantitative analysis of companies has been conducted to help clients understand the wider business environment as well as the strengths and weaknesses of key industry players. Data is qualitatively analyzed to categorize companies as pure play, category-focused, industry-focused, and diversified; it is quantitatively analyzed to categorize companies as dominant, leading, strong, tentative, and weak.

Recent Development and News in Ready mix concrete batching plant market

  • In the Construction and Engineering industry, the aggressive shift toward stringent municipal green building codes and sustainable infrastructure policies has accelerated the adoption of a zero-emission production line, directly impacting Ready Mix Concrete Batching Plant demand by forcing suppliers to secure eco-conscious construction tenders through verified environmental product declarations.
  • The widespread implementation of strict urban particulate emission regulations and noise dampening mandates has necessitated the integration of bag-house filtration and greywater recycling, driving the Ready Mix Concrete Batching Plant market toward enclosed operational layouts that enhance industrial dust suppression and lower localized pollution by over 40%.
  • The transition toward decentralized urban infrastructure development and remote wind farm installations has expanded the requirement for mobile mixing infrastructure, boosting the procurement of a transit mixer truck and modular building technologies that optimize a rapid mobilization footprint to prevent premature material hydration.
  • The rising structural complexity of deep-earth mining operations and high-speed rail corridors has established a technical imperative for specialized binder formulations, compelling the Ready Mix Concrete Batching Plant sector to adopt multi-component binder blending and carbon-captured cement to ensure structural grade concrete delivers enhanced compressive strength.

Dive into Technavio’s robust research methodology, blending expert interviews, extensive data synthesis, and validated models for unparalleled Ready Mix Concrete Batching Plant Market insights. See full methodology.

Market Scope
Page number 309
Base year 2025
Historic period 2020-2024
Forecast period 2026-2030
Growth momentum & CAGR Accelerate at a CAGR of 4.7%
Market growth 2026-2030 USD 158.6 million
Market structure Fragmented
YoY growth 2025-2026(%) 4.5%
Key countries China, India, Japan, South Korea, Australia, Indonesia, Saudi Arabia, UAE, South Africa, Egypt, Turkey, Germany, UK, France, Italy, Russia, Spain, Brazil, Argentina, Chile, US, Canada and Mexico
Competitive landscape Leading Companies, Market Positioning of Companies, Competitive Strategies, and Industry Risks

Request Free Sample

Research Analyst Overview

  • The continuous evolution of the Ready Mix Concrete Batching Plant sector is fundamentally reshaping how contractors approach material consistency and supply chain risk. Strategic boardroom decisions now prioritize heavy investments in intelligent production infrastructure to mitigate labor shortages and regulatory penalties. The deployment of advanced automated batching software allows centralized facilities to dynamically adjust formulations, drastically reducing human error.
  • High-performance facilities increasingly utilize a planetary mixer or an intensive twin-shaft mixer to process complex, low-viscosity mixtures, ensuring superior homogenization for demanding architectural projects. A critical shift toward sustainable building has mandated the precise integration of supplementary cementitious materials, including reactive calcined clay, directly into the primary mixing logic.
  • To support these eco-friendly mixtures, modern plants employ highly efficient pneumatic conveying mechanisms that handle fine powders without excessive particulate loss. By utilizing an integrated telemetry system, plant managers gain absolute visibility over fleet dispatch and material consumption, achieving a 25% reduction in overall cement waste.

What are the Key Data Covered in this Ready Mix Concrete Batching Plant Market Research and Growth Report?

  • What is the expected growth of the Ready Mix Concrete Batching Plant Market between 2026 and 2030?

    • USD 158.6 million, at a CAGR of 4.7%

  • What segmentation does the market report cover?

    • The report is segmented by End-user (Residential construction, and Non-residential construction), Type (Dry batch concrete plant, and Wet batch concrete plant), Product Type (Crushed stone, River gravel, and Slag), Application (Infrastructure, Mining, and Others) and Geography (APAC, Middle East and Africa, Europe, South America, North America)

  • Which regions are analyzed in the report?

    • APAC, Middle East and Africa, Europe, South America and North America

  • What are the key growth drivers and market challenges?

    • Accelerating global public expenditure on large-scale infrastructure projects, Strict environmental regulations and carbon emission compliance burdens

  • Who are the major players in the Ready Mix Concrete Batching Plant Market?

    • AIMIX Group, Ammann Group, Astec Industries Inc., BHS-Sonthofen GmbH, Camelway Machinery, CEMEX SAB de CV, CIFA S.p.A., CONSTMACH, Liebherr International AG, Lintec and Linnhoff, MEKA, Nisbau GmbH, Polygonmach, Sany Heavy Industry Co. Ltd., SCHWING GmbH, Shantui Construction Machinery, SIMEM S.p.A., Stephens MFG. Co., Terex Corp. and The Vince Hagan Co.

Market Research Insights

  • The Ready Mix Concrete Batching Plant landscape is rapidly evolving to prioritize precision engineering and ecological compliance. Operators are actively substituting traditional binders with green alternative binders to successfully bid on sustainability-focused project contracts. The implementation of automated inventory management has streamlined material supply chains, yielding a 12% reduction in aggregate waste.
  • Simultaneously, transitioning from reactive repairs to sensor-driven oversight has reduced heavy mechanical maintenance costs by 18%, significantly improving margin retention. These structural improvements empower concrete manufacturers to maintain continuous, high-volume production cycles while mitigating the operational risks associated with raw material volatility and strict environmental enforcement.

We can help! Our analysts can customize this ready mix concrete batching plant market research report to meet your requirements.

Get in touch

1. Executive Summary

1.1 Market overview

Executive Summary - Chart on Market Overview
Executive Summary - Data Table on Market Overview
Executive Summary - Chart on Global Market Characteristics
Executive Summary - Chart on Market by Geography
Executive Summary - Chart on Market Segmentation by End-user
Executive Summary - Chart on Market Segmentation by Type
Executive Summary - Chart on Market Segmentation by Product Type
Executive Summary - Chart on Market Segmentation by Application
Executive Summary - Chart on Incremental Growth
Executive Summary - Data Table on Incremental Growth
Executive Summary - Chart on Company Market Positioning

2. Technavio Analysis

2.1 Analysis of price sensitivity, lifecycle, customer purchase basket, adoption rates, and purchase criteria

2.2 Criticality of inputs and Factors of differentiation

Chart on Overview on criticality of inputs and factors of differentiation

2.3 Factors of disruption

Chart on Overview on factors of disruption

2.4 Impact of drivers and challenges

Chart on Impact of drivers and challenges in 2025 and 2030

3. Market Landscape

3.1 Market ecosystem

Chart on Parent Market
Data Table on - Parent Market

3.2 Market characteristics

Chart on Market characteristics analysis

3.3 Value chain analysis

Chart on Value chain analysis

4. Market Sizing

4.1 Market definition

Data Table on Offerings of companies included in the market definition

4.2 Market segment analysis

Market segments

4.3 Market size 2025

4.4 Market outlook: Forecast for 2025-2030

Chart on Global - Market size and forecast 2025-2030 ($ million)
Data Table on Global - Market size and forecast 2025-2030 ($ million)
Chart on Global Market: Year-over-year growth 2025-2030 (%)
Data Table on Global Market: Year-over-year growth 2025-2030 (%)

5. Historic Market Size

5.1 Global Ready Mix Concrete Batching Plant Market 2020 - 2024

Historic Market Size - Data Table on Global Ready Mix Concrete Batching Plant Market 2020 - 2024 ($ million)

5.2 End-user segment analysis 2020 - 2024

Historic Market Size - End-user Segment 2020 - 2024 ($ million)

5.3 Type segment analysis 2020 - 2024

Historic Market Size - Type Segment 2020 - 2024 ($ million)

5.4 Product Type segment analysis 2020 - 2024

Historic Market Size - Product Type Segment 2020 - 2024 ($ million)

5.5 Application segment analysis 2020 - 2024

Historic Market Size - Application Segment 2020 - 2024 ($ million)

5.6 Geography segment analysis 2020 - 2024

Historic Market Size - Geography Segment 2020 - 2024 ($ million)

5.7 Country segment analysis 2020 - 2024

Historic Market Size - Country Segment 2020 - 2024 ($ million)

6. Qualitative Analysis

6.1 Impact of AI on global ready mix concrete batching plant market

6.2 Impact of geopolitical conflict on global ready mix concrete batching plant market

7. Five Forces Analysis

7.1 Five forces summary

Five forces analysis - Comparison between 2025 and 2030

7.2 Bargaining power of buyers

Bargaining power of buyers - Impact of key factors 2025 and 2030

7.3 Bargaining power of suppliers

Bargaining power of suppliers - Impact of key factors in 2025 and 2030

7.4 Threat of new entrants

Threat of new entrants - Impact of key factors in 2025 and 2030

7.5 Threat of substitutes

Threat of substitutes - Impact of key factors in 2025 and 2030

7.6 Threat of rivalry

Threat of rivalry - Impact of key factors in 2025 and 2030

7.7 Market condition

Chart on Market condition - Five forces 2025 and 2030

8. Market Segmentation by End-user

8.1 Market segments

Chart on End-user - Market share 2025-2030 (%)
Data Table on End-user - Market share 2025-2030 (%)

8.2 Comparison by End-user

Chart on Comparison by End-user
Data Table on Comparison by End-user

8.3 Residential construction - Market size and forecast 2025-2030

Chart on Residential construction - Market size and forecast 2025-2030 ($ million)
Data Table on Residential construction - Market size and forecast 2025-2030 ($ million)
Chart on Residential construction - Year-over-year growth 2025-2030 (%)
Data Table on Residential construction - Year-over-year growth 2025-2030 (%)

8.4 Non-residential construction - Market size and forecast 2025-2030

Chart on Non-residential construction - Market size and forecast 2025-2030 ($ million)
Data Table on Non-residential construction - Market size and forecast 2025-2030 ($ million)
Chart on Non-residential construction - Year-over-year growth 2025-2030 (%)
Data Table on Non-residential construction - Year-over-year growth 2025-2030 (%)

8.5 Market opportunity by End-user

Market opportunity by End-user ($ million)
Data Table on Market opportunity by End-user ($ million)

9. Market Segmentation by Type

9.1 Market segments

Chart on Type - Market share 2025-2030 (%)
Data Table on Type - Market share 2025-2030 (%)

9.2 Comparison by Type

Chart on Comparison by Type
Data Table on Comparison by Type

9.3 Dry batch concrete plant - Market size and forecast 2025-2030

Chart on Dry batch concrete plant - Market size and forecast 2025-2030 ($ million)
Data Table on Dry batch concrete plant - Market size and forecast 2025-2030 ($ million)
Chart on Dry batch concrete plant - Year-over-year growth 2025-2030 (%)
Data Table on Dry batch concrete plant - Year-over-year growth 2025-2030 (%)

9.4 Wet batch concrete plant - Market size and forecast 2025-2030

Chart on Wet batch concrete plant - Market size and forecast 2025-2030 ($ million)
Data Table on Wet batch concrete plant - Market size and forecast 2025-2030 ($ million)
Chart on Wet batch concrete plant - Year-over-year growth 2025-2030 (%)
Data Table on Wet batch concrete plant - Year-over-year growth 2025-2030 (%)

9.5 Market opportunity by Type

Market opportunity by Type ($ million)
Data Table on Market opportunity by Type ($ million)

10. Market Segmentation by Product Type

10.1 Market segments

Chart on Product Type - Market share 2025-2030 (%)
Data Table on Product Type - Market share 2025-2030 (%)

10.2 Comparison by Product Type

Chart on Comparison by Product Type
Data Table on Comparison by Product Type

10.3 Crushed stone - Market size and forecast 2025-2030

Chart on Crushed stone - Market size and forecast 2025-2030 ($ million)
Data Table on Crushed stone - Market size and forecast 2025-2030 ($ million)
Chart on Crushed stone - Year-over-year growth 2025-2030 (%)
Data Table on Crushed stone - Year-over-year growth 2025-2030 (%)

10.4 River gravel - Market size and forecast 2025-2030

Chart on River gravel - Market size and forecast 2025-2030 ($ million)
Data Table on River gravel - Market size and forecast 2025-2030 ($ million)
Chart on River gravel - Year-over-year growth 2025-2030 (%)
Data Table on River gravel - Year-over-year growth 2025-2030 (%)

10.5 Slag - Market size and forecast 2025-2030

Chart on Slag - Market size and forecast 2025-2030 ($ million)
Data Table on Slag - Market size and forecast 2025-2030 ($ million)
Chart on Slag - Year-over-year growth 2025-2030 (%)
Data Table on Slag - Year-over-year growth 2025-2030 (%)

10.6 Market opportunity by Product Type

Market opportunity by Product Type ($ million)
Data Table on Market opportunity by Product Type ($ million)

11. Market Segmentation by Application

11.1 Market segments

Chart on Application - Market share 2025-2030 (%)
Data Table on Application - Market share 2025-2030 (%)

11.2 Comparison by Application

Chart on Comparison by Application
Data Table on Comparison by Application

11.3 Infrastructure - Market size and forecast 2025-2030

Chart on Infrastructure - Market size and forecast 2025-2030 ($ million)
Data Table on Infrastructure - Market size and forecast 2025-2030 ($ million)
Chart on Infrastructure - Year-over-year growth 2025-2030 (%)
Data Table on Infrastructure - Year-over-year growth 2025-2030 (%)

11.4 Mining - Market size and forecast 2025-2030

Chart on Mining - Market size and forecast 2025-2030 ($ million)
Data Table on Mining - Market size and forecast 2025-2030 ($ million)
Chart on Mining - Year-over-year growth 2025-2030 (%)
Data Table on Mining - Year-over-year growth 2025-2030 (%)

11.5 Others - Market size and forecast 2025-2030

Chart on Others - Market size and forecast 2025-2030 ($ million)
Data Table on Others - Market size and forecast 2025-2030 ($ million)
Chart on Others - Year-over-year growth 2025-2030 (%)
Data Table on Others - Year-over-year growth 2025-2030 (%)

11.6 Market opportunity by Application

Market opportunity by Application ($ million)
Data Table on Market opportunity by Application ($ million)

12. Customer Landscape

12.1 Customer landscape overview

Analysis of price sensitivity, lifecycle, customer purchase basket, adoption rates, and purchase criteria

13. Geographic Landscape

13.1 Geographic segmentation

Chart on Market share by geography 2025-2030 (%)
Data Table on Market share by geography 2025-2030 (%)

13.2 Geographic comparison

Chart on Geographic comparison
Data Table on Geographic comparison

13.3 APAC - Market size and forecast 2025-2030

Chart on APAC - Market size and forecast 2025-2030 ($ million)
Data Table on APAC - Market size and forecast 2025-2030 ($ million)
Chart on APAC - Year-over-year growth 2025-2030 (%)
Data Table on APAC - Year-over-year growth 2025-2030 (%)
Chart on Regional Comparison - APAC
Data Table on Regional Comparison - APAC

13.3.1 China - Market size and forecast 2025-2030

Chart on China - Market size and forecast 2025-2030 ($ million)
Data Table on China - Market size and forecast 2025-2030 ($ million)
Chart on China - Year-over-year growth 2025-2030 (%)
Data Table on China - Year-over-year growth 2025-2030 (%)

13.3.2 India - Market size and forecast 2025-2030

Chart on India - Market size and forecast 2025-2030 ($ million)
Data Table on India - Market size and forecast 2025-2030 ($ million)
Chart on India - Year-over-year growth 2025-2030 (%)
Data Table on India - Year-over-year growth 2025-2030 (%)

13.3.3 Japan - Market size and forecast 2025-2030

Chart on Japan - Market size and forecast 2025-2030 ($ million)
Data Table on Japan - Market size and forecast 2025-2030 ($ million)
Chart on Japan - Year-over-year growth 2025-2030 (%)
Data Table on Japan - Year-over-year growth 2025-2030 (%)

13.3.4 South Korea - Market size and forecast 2025-2030

Chart on South Korea - Market size and forecast 2025-2030 ($ million)
Data Table on South Korea - Market size and forecast 2025-2030 ($ million)
Chart on South Korea - Year-over-year growth 2025-2030 (%)
Data Table on South Korea - Year-over-year growth 2025-2030 (%)

13.3.5 Australia - Market size and forecast 2025-2030

Chart on Australia - Market size and forecast 2025-2030 ($ million)
Data Table on Australia - Market size and forecast 2025-2030 ($ million)
Chart on Australia - Year-over-year growth 2025-2030 (%)
Data Table on Australia - Year-over-year growth 2025-2030 (%)

13.3.6 Indonesia - Market size and forecast 2025-2030

Chart on Indonesia - Market size and forecast 2025-2030 ($ million)
Data Table on Indonesia - Market size and forecast 2025-2030 ($ million)
Chart on Indonesia - Year-over-year growth 2025-2030 (%)
Data Table on Indonesia - Year-over-year growth 2025-2030 (%)

13.4 Middle East and Africa - Market size and forecast 2025-2030

Chart on Middle East and Africa - Market size and forecast 2025-2030 ($ million)
Data Table on Middle East and Africa - Market size and forecast 2025-2030 ($ million)
Chart on Middle East and Africa - Year-over-year growth 2025-2030 (%)
Data Table on Middle East and Africa - Year-over-year growth 2025-2030 (%)
Chart on Regional Comparison - Middle East and Africa
Data Table on Regional Comparison - Middle East and Africa

13.4.1 Saudi Arabia - Market size and forecast 2025-2030

Chart on Saudi Arabia - Market size and forecast 2025-2030 ($ million)
Data Table on Saudi Arabia - Market size and forecast 2025-2030 ($ million)
Chart on Saudi Arabia - Year-over-year growth 2025-2030 (%)
Data Table on Saudi Arabia - Year-over-year growth 2025-2030 (%)

13.4.2 UAE - Market size and forecast 2025-2030

Chart on UAE - Market size and forecast 2025-2030 ($ million)
Data Table on UAE - Market size and forecast 2025-2030 ($ million)
Chart on UAE - Year-over-year growth 2025-2030 (%)
Data Table on UAE - Year-over-year growth 2025-2030 (%)

13.4.3 South Africa - Market size and forecast 2025-2030

Chart on South Africa - Market size and forecast 2025-2030 ($ million)
Data Table on South Africa - Market size and forecast 2025-2030 ($ million)
Chart on South Africa - Year-over-year growth 2025-2030 (%)
Data Table on South Africa - Year-over-year growth 2025-2030 (%)

13.4.4 Egypt - Market size and forecast 2025-2030

Chart on Egypt - Market size and forecast 2025-2030 ($ million)
Data Table on Egypt - Market size and forecast 2025-2030 ($ million)
Chart on Egypt - Year-over-year growth 2025-2030 (%)
Data Table on Egypt - Year-over-year growth 2025-2030 (%)

13.4.5 Turkey - Market size and forecast 2025-2030

Chart on Turkey - Market size and forecast 2025-2030 ($ million)
Data Table on Turkey - Market size and forecast 2025-2030 ($ million)
Chart on Turkey - Year-over-year growth 2025-2030 (%)
Data Table on Turkey - Year-over-year growth 2025-2030 (%)

13.5 Europe - Market size and forecast 2025-2030

Chart on Europe - Market size and forecast 2025-2030 ($ million)
Data Table on Europe - Market size and forecast 2025-2030 ($ million)
Chart on Europe - Year-over-year growth 2025-2030 (%)
Data Table on Europe - Year-over-year growth 2025-2030 (%)
Chart on Regional Comparison - Europe
Data Table on Regional Comparison - Europe

13.5.1 Germany - Market size and forecast 2025-2030

Chart on Germany - Market size and forecast 2025-2030 ($ million)
Data Table on Germany - Market size and forecast 2025-2030 ($ million)
Chart on Germany - Year-over-year growth 2025-2030 (%)
Data Table on Germany - Year-over-year growth 2025-2030 (%)

13.5.2 UK - Market size and forecast 2025-2030

Chart on UK - Market size and forecast 2025-2030 ($ million)
Data Table on UK - Market size and forecast 2025-2030 ($ million)
Chart on UK - Year-over-year growth 2025-2030 (%)
Data Table on UK - Year-over-year growth 2025-2030 (%)

13.5.3 France - Market size and forecast 2025-2030

Chart on France - Market size and forecast 2025-2030 ($ million)
Data Table on France - Market size and forecast 2025-2030 ($ million)
Chart on France - Year-over-year growth 2025-2030 (%)
Data Table on France - Year-over-year growth 2025-2030 (%)

13.5.4 Italy - Market size and forecast 2025-2030

Chart on Italy - Market size and forecast 2025-2030 ($ million)
Data Table on Italy - Market size and forecast 2025-2030 ($ million)
Chart on Italy - Year-over-year growth 2025-2030 (%)
Data Table on Italy - Year-over-year growth 2025-2030 (%)

13.5.5 Russia - Market size and forecast 2025-2030

Chart on Russia - Market size and forecast 2025-2030 ($ million)
Data Table on Russia - Market size and forecast 2025-2030 ($ million)
Chart on Russia - Year-over-year growth 2025-2030 (%)
Data Table on Russia - Year-over-year growth 2025-2030 (%)

13.5.6 Spain - Market size and forecast 2025-2030

Chart on Spain - Market size and forecast 2025-2030 ($ million)
Data Table on Spain - Market size and forecast 2025-2030 ($ million)
Chart on Spain - Year-over-year growth 2025-2030 (%)
Data Table on Spain - Year-over-year growth 2025-2030 (%)

13.6 South America - Market size and forecast 2025-2030

Chart on South America - Market size and forecast 2025-2030 ($ million)
Data Table on South America - Market size and forecast 2025-2030 ($ million)
Chart on South America - Year-over-year growth 2025-2030 (%)
Data Table on South America - Year-over-year growth 2025-2030 (%)
Chart on Regional Comparison - South America
Data Table on Regional Comparison - South America

13.6.1 Brazil - Market size and forecast 2025-2030

Chart on Brazil - Market size and forecast 2025-2030 ($ million)
Data Table on Brazil - Market size and forecast 2025-2030 ($ million)
Chart on Brazil - Year-over-year growth 2025-2030 (%)
Data Table on Brazil - Year-over-year growth 2025-2030 (%)

13.6.2 Argentina - Market size and forecast 2025-2030

Chart on Argentina - Market size and forecast 2025-2030 ($ million)
Data Table on Argentina - Market size and forecast 2025-2030 ($ million)
Chart on Argentina - Year-over-year growth 2025-2030 (%)
Data Table on Argentina - Year-over-year growth 2025-2030 (%)

13.6.3 Chile - Market size and forecast 2025-2030

Chart on Chile - Market size and forecast 2025-2030 ($ million)
Data Table on Chile - Market size and forecast 2025-2030 ($ million)
Chart on Chile - Year-over-year growth 2025-2030 (%)
Data Table on Chile - Year-over-year growth 2025-2030 (%)

13.7 North America - Market size and forecast 2025-2030

Chart on North America - Market size and forecast 2025-2030 ($ million)
Data Table on North America - Market size and forecast 2025-2030 ($ million)
Chart on North America - Year-over-year growth 2025-2030 (%)
Data Table on North America - Year-over-year growth 2025-2030 (%)
Chart on Regional Comparison - North America
Data Table on Regional Comparison - North America

13.7.1 US - Market size and forecast 2025-2030

Chart on US - Market size and forecast 2025-2030 ($ million)
Data Table on US - Market size and forecast 2025-2030 ($ million)
Chart on US - Year-over-year growth 2025-2030 (%)
Data Table on US - Year-over-year growth 2025-2030 (%)

13.7.2 Canada - Market size and forecast 2025-2030

Chart on Canada - Market size and forecast 2025-2030 ($ million)
Data Table on Canada - Market size and forecast 2025-2030 ($ million)
Chart on Canada - Year-over-year growth 2025-2030 (%)
Data Table on Canada - Year-over-year growth 2025-2030 (%)

13.7.3 Mexico - Market size and forecast 2025-2030

Chart on Mexico - Market size and forecast 2025-2030 ($ million)
Data Table on Mexico - Market size and forecast 2025-2030 ($ million)
Chart on Mexico - Year-over-year growth 2025-2030 (%)
Data Table on Mexico - Year-over-year growth 2025-2030 (%)

13.8 Market opportunity by geography

Market opportunity by geography ($ million)
Data Tables on Market opportunity by geography ($ million)

14. Drivers, Challenges, and Opportunity

14.1 Market drivers

Accelerating global public expenditure on large-scale infrastructure projects
Rapid global urbanization and rising demand for premium high-rise residential real estate
Corporate consolidation strategies and vertical supply chain integration initiatives

14.2 Market challenges

Strict environmental regulations and carbon emission compliance burdens
Rising raw material capital costs and aggregate supply chain constraints
Specialized labor deficiencies and complex automation integration friction

14.3 Impact of drivers and challenges

Impact of drivers and challenges in 2025 and 2030

14.4 Market opportunities

Systemic proliferation of AI and IOT plant monitoring
Widespread adoption of low-carbon formulations and supplementary cementitious binders
Geographical portfolio rebalancing and strategic divestment of non-core assets

15. Competitive Landscape

15.1 Overview

15.2

Overview on criticality of inputs and factors of differentiation

15.3 Landscape disruption

Overview on factors of disruption

15.4 Industry risks

Impact of key risks on business

16. Competitive Analysis

16.1 Companies profiled

Companies covered

16.2 Company ranking index

16.3 Market positioning of companies

Matrix on companies position and classification

16.4 AIMIX Group

AIMIX Group - Overview
AIMIX Group - Product / Service
AIMIX Group - Key offerings
SWOT

16.5 Ammann Group

Ammann Group - Overview
Ammann Group - Product / Service
Ammann Group - Key offerings
SWOT

16.6 Astec Industries Inc.

Astec Industries Inc. - Overview
Astec Industries Inc. - Business segments
Astec Industries Inc. - Key news
Astec Industries Inc. - Key offerings
Astec Industries Inc. - Segment focus
SWOT

16.7 BHS-Sonthofen GmbH

BHS-Sonthofen GmbH - Overview
BHS-Sonthofen GmbH - Product / Service
BHS-Sonthofen GmbH - Key offerings
SWOT

16.8 Camelway Machinery

Camelway Machinery - Overview
Camelway Machinery - Product / Service
Camelway Machinery - Key offerings
SWOT

16.9 CEMEX SAB de CV

CEMEX SAB de CV - Overview
CEMEX SAB de CV - Business segments
CEMEX SAB de CV - Key news
CEMEX SAB de CV - Key offerings
CEMEX SAB de CV - Segment focus
SWOT

16.10 CIFA S.p.A.

CIFA S.p.A. - Overview
CIFA S.p.A. - Product / Service
CIFA S.p.A. - Key offerings
SWOT

16.11 CONSTMACH

CONSTMACH - Overview
CONSTMACH - Product / Service
CONSTMACH - Key offerings
SWOT

16.12 Liebherr International AG

Liebherr International AG - Overview
Liebherr International AG - Product / Service
Liebherr International AG - Key offerings
SWOT

16.13 Lintec and Linnhoff

Lintec and Linnhoff - Overview
Lintec and Linnhoff - Product / Service
Lintec and Linnhoff - Key offerings
SWOT

16.14 MEKA

MEKA - Overview
MEKA - Product / Service
MEKA - Key offerings
SWOT

16.15 Sany Heavy Industry Co. Ltd.

Sany Heavy Industry Co. Ltd. - Overview
Sany Heavy Industry Co. Ltd. - Business segments
Sany Heavy Industry Co. Ltd. - Key offerings
Sany Heavy Industry Co. Ltd. - Segment focus
SWOT

16.16 SCHWING GmbH

SCHWING GmbH - Overview
SCHWING GmbH - Product / Service
SCHWING GmbH - Key offerings
SWOT

16.17 Shantui Construction Machinery

Shantui Construction Machinery - Overview
Shantui Construction Machinery - Product / Service
Shantui Construction Machinery - Key offerings
SWOT

16.18 Terex Corp.

Terex Corp. - Overview
Terex Corp. - Business segments
Terex Corp. - Key offerings
Terex Corp. - Segment focus
SWOT

17. Appendix

17.1 Scope of the report

Market definition
Objectives
Notes and caveats

17.2 Inclusions and exclusions checklist

Inclusions checklist
Exclusions checklist

17.3 Currency conversion rates for US$

17.4 Research methodology

17.5 Data procurement

Information sources

17.6 Data validation

17.7 Validation techniques employed for market sizing

17.8 Data synthesis

17.9 360 degree market analysis

17.10 List of abbreviations

Research Methodology

Technavio presents a detailed picture of the market by way of study, synthesis, and summation of data from multiple sources. The analysts have presented the various facets of the market with a particular focus on identifying the key industry influencers. The data thus presented is comprehensive, reliable, and the result of extensive research, both primary and secondary.

INFORMATION SOURCES

Primary sources

  • Manufacturers and suppliers
  • Channel partners
  • Industry experts
  • Strategic decision makers

Secondary sources

  • Industry journals and periodicals
  • Government data
  • Financial reports of key industry players
  • Historical data
  • Press releases

DATA ANALYSIS

Data Synthesis

  • Collation of data
  • Estimation of key figures
  • Analysis of derived insights

Data Validation

  • Triangulation with data models
  • Reference against proprietary databases
  • Corroboration with industry experts

REPORT WRITING

Qualitative

  • Market drivers
  • Market challenges
  • Market trends
  • Five forces analysis

Quantitative

  • Market size and forecast
  • Market segmentation
  • Geographical insights
  • Competitive landscape

Interested in this report?

Get your sample now to see our research methodology and insights!

Download Now

Frequently Asked Questions

Ready Mix Concrete Batching Plant market growth will increase by USD 158.6 million during 2026-2030.

The Ready Mix Concrete Batching Plant market is expected to grow at a CAGR of 4.7% during 2026-2030.

Ready Mix Concrete Batching Plant market is segmented by End-user (Residential construction, Non-residential construction) Type (Dry batch concrete plant, Wet batch concrete plant) Product type (Crushed stone, River gravel, Slag) Application (Infrastructure, Mining, Others)

AIMIX Group, Ammann Group, Astec Industries Inc., BHS-Sonthofen GmbH, Camelway Machinery, CEMEX SAB de CV, CIFA S.p.A., CONSTMACH, Liebherr International AG, Lintec and Linnhoff, MEKA, Nisbau GmbH, Polygonmach, Sany Heavy Industry Co. Ltd., SCHWING GmbH, Shantui Construction Machinery, SIMEM S.p.A., Stephens MFG. Co., Terex Corp., The Vince Hagan Co. are a few of the key vendors in the Ready Mix Concrete Batching Plant market.

APAC will register the highest growth rate of 55.1% among the other regions. Therefore, the Ready Mix Concrete Batching Plant market in APAC is expected to garner significant business opportunities for the vendors during the forecast period.

China, India, Japan, South Korea, Australia, Indonesia, Saudi Arabia, UAE, South Africa, Egypt, Turkey, Germany, UK, France, Italy, Russia, Spain, Brazil, Argentina, Chile, US, Canada, Mexico

  • Accelerating global public expenditure on large-scale infrastructure projects is the driving factor this market.

The Ready Mix Concrete Batching Plant market vendors should focus on grabbing business opportunities from the End-user segment as it accounted for the largest market share in the base year.
RIA - Research AI Assistant
Ask RIA