Europe Ready To Assemble (RTA) Furniture Market Size 2025-2029
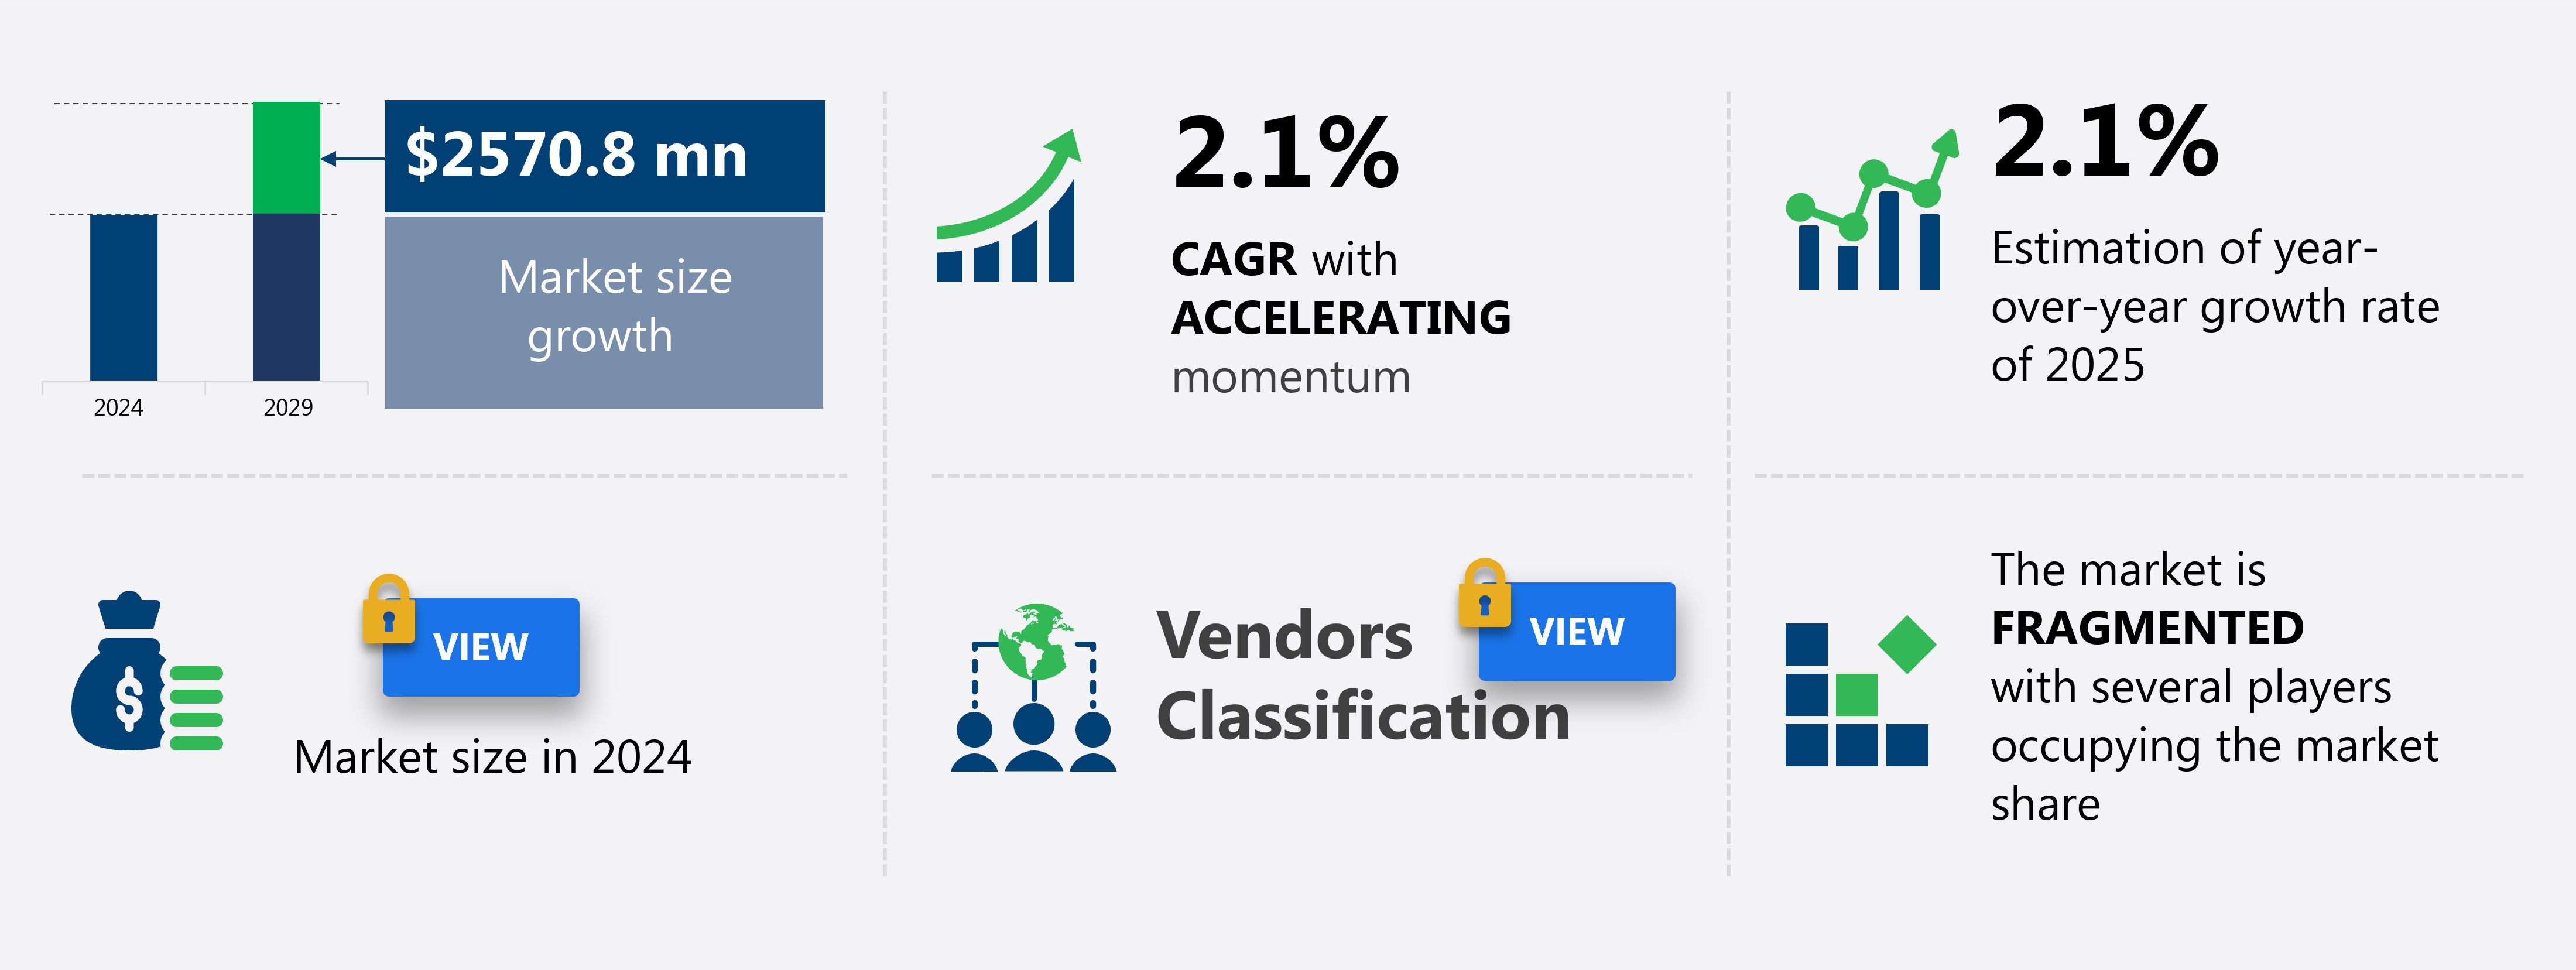
The Europe ready to assemble (RTA) furniture market size is forecast to increase by USD 2.57 billion at a CAGR of 2.1% between 2024 and 2029.
- The European Ready To Assemble (RTA) Furniture Market is experiencing significant shifts, driven by the reduction in average urban living space and the robust growth of online sales. With space at a premium in European cities, RTA furniture's modular design and ease of assembly have made it an attractive option for consumers. This trend is further amplified by the convenience of purchasing online furniture, allowing consumers to save time and space in their homes. However, the market faces challenges, including a shortage of high-quality raw materials related to RTA furniture production. This scarcity can lead to increased production costs and potential supply chain disruptions.
- Companies in the RTA furniture industry must navigate these challenges by implementing efficient sourcing strategies and exploring alternative materials to maintain competitiveness and meet consumer demand. By capitalizing on the market's growth drivers and addressing the challenges, RTA furniture manufacturers can effectively cater to the evolving needs of European consumers and thrive in this dynamic market.
What will be the size of the Europe Ready To Assemble (RTA) Furniture Market during the forecast period?
Explore in-depth regional segment analysis with market size data - historical 2019-2023 and forecasts 2025-2029 - in the full report.
Request Free Sample
- The European RTA furniture market exhibits dynamic trends, with industrial design playing a pivotal role in shaping contemporary furniture styles. Circular economy principles are increasingly influencing the industry, as consumers demand more sustainable solutions. Assembly difficulty varies among furniture types, with some opting for simpler designs and others prioritizing durability and weight. Fabric types, furniture upholstery, and furniture colors are key considerations for buyers, reflecting personal preferences and design aesthetics. Furniture trends lean towards sustainability, with a focus on furniture upcycling, recycling, and lifecycle management. Space optimization, functionality, and multifunctional furniture are essential aspects of modern design, with furniture dimensions tailored to urban living.
- Furniture materials, including wood products, metal, plastic, and leather, offer diverse aesthetics and functionalities. Mid-century modern, rustic, and Scandinavian designs remain popular, while glass furniture adds a touch of elegance and minimalism. Furniture finishes, from matte to high-gloss, cater to various tastes and preferences. Assembly time and furniture trends continue to evolve, with an emphasis on space-saving, easy-to-assemble designs. Furniture sustainability and furniture storage solutions are also gaining traction, as consumers seek eco-friendly and efficient options.
How is this market segmented?
The market research report provides comprehensive data (region-wise segment analysis), with forecasts and estimates in "USD million" for the period 2025-2029, as well as historical data from 2019-2023 for the following segments.
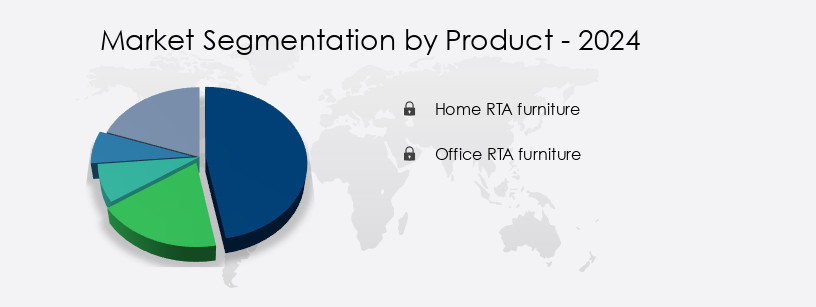
- Product
- Home RTA furniture
- Office RTA furniture
- Distribution Channel
- Offline
- Online
- Price Range
- Economy
- Mid-range
- Premium
- Geography
- Europe
- France
- Germany
- Sweden
- UK
- Europe
By Product Insights
The home RTA furniture segment is estimated to witness significant growth during the forecast period.
The European RTA furniture market encompasses various segments, including living room, bedroom, kitchen, dining room, kids room, and garden furniture. Living room furniture, which consists of sofa sets, tables, chairs, entertainment units, decorative side tables, and shelves, is experiencing significant growth due to the increasing preference for luxury RTA options. Bedroom furniture, comprising beds, sofa sets, dressing tables, wardrobes, and study tables, is witnessing innovation and design trends that are driving its expansion. DIY furniture, smart furniture, and modular furniture are also gaining popularity, necessitating efficient supply chain management for furniture wholesalers. Furniture certifications ensure safety and durability, while furniture maintenance, cleaning, and repair services cater to the needs of customers.
Assembly tools and instructions facilitate the self-assembly process, and hardware kits are essential components of RTA furniture production. Furniture design, pricing, and technology are key factors influencing market trends. Sustainable furniture, recycling, and upcycling are increasingly important considerations for consumers. E-commerce platforms and online retail have transformed the industry, offering a wide range of options for furniture customization and personalization. Furniture fittings, ratings, and reviews are crucial for customers making informed purchasing decisions. Furniture manufacturers, retailers, and suppliers must focus on ensuring furniture quality, value, and affordability to meet the evolving demands of the market. Shipping logistics and warranty services are essential for maintaining customer satisfaction.
The RTA furniture market is characterized by its adaptability, with pre-cut components and flat-pack designs enabling easy transportation and assembly. Knockdown furniture and home assembly have become common practices, with assembly instructions and tools playing a vital role in the customer experience. Furniture disposal and reupholstery are also essential services in the market. Overall, the European RTA furniture market is dynamic and evolving, with a focus on innovation, affordability, and sustainability.
The Home RTA furniture segment was valued at USD million in 2019 and showed a gradual increase during the forecast period.
Market Dynamics
Our researchers analyzed the data with 2024 as the base year, along with the key drivers, trends, and challenges. A holistic analysis of drivers will help companies refine their marketing strategies to gain a competitive advantage.
What are the Europe Ready To Assemble (RTA) Furniture Market drivers leading to the rise in adoption of the Industry?
- The decline in the average urban living space in Europe significantly contributes to the market's growth. This reduction in space is a pressing issue in European cities, leading to a heightened demand for efficient and space-saving solutions. Consequently, the market for innovative architectural designs, modular housing, and vertical living solutions is experiencing robust expansion.
- RTA furniture, or ready-to-assemble furniture, has gained significant traction in Europe due to the increasing need for space-efficient solutions in both residential and commercial sectors. With urbanization rates on the rise, countries like the UK and Sweden are experiencing a shortage of living space. In the UK, where the average home size is just 85 square meters, a large population resides in cramped conditions. Germany and Ireland have even smaller average home sizes of 46 square meters and 81 square meters, respectively. In response to this trend, RTA furniture has emerged as an attractive investment due to its travel-friendly and room-friendly design.
- This self-assembly furniture not only saves space during transportation but also during use, making it an ideal choice for those living in compact homes. Furthermore, RTA furniture offers flexibility in terms of customization, allowing consumers to tailor their furniture to their specific needs. The use of certified materials and adherence to furniture certifications ensures the durability and longevity of the products. Additionally, the availability of assembly tools and the rise of e-commerce platforms have made it easier for consumers to purchase and assemble RTA furniture themselves. The trend towards smart furniture is also influencing the RTA furniture market, with the integration of technology offering enhanced functionality and convenience.
- Proper furniture maintenance is essential to ensure the longevity of RTA furniture, and the availability of restoration services further adds to its value proposition. Effective supply chain management is crucial for furniture wholesalers to meet the growing demand for RTA furniture, making it a lucrative business opportunity.
What are the Europe Ready To Assemble (RTA) Furniture Market trends shaping the Industry?
- The robust growth of online sales represents a significant market trend in today's business landscape. Online shopping continues to gain popularity, with an increasing number of consumers opting for the convenience and accessibility it offers.
- The European RTA furniture market is experiencing notable growth due to several market dynamics. With the expansion of internet penetration, shipping services have become more accessible, broadening the market reach for online RTA furniture sales. Furthermore, the fragmentation of consumer choices has led numerous furniture manufacturers, including FABRYKI MEBLI FORTE SA, BoConcept, and Inter IKEA Holding BV, to sell their products online. The market's growth is also driven by the decline in inventory and reduced rental space, making e-commerce platforms an attractive option for RTA furniture purchases. The increasing number of individual dwellings and internet users in Europe is expected to fuel the market's growth during the forecast period.
- Furniture sustainability is a significant trend in the European RTA furniture market, with consumers focusing on furniture durability and eco-friendly manufacturing processes. Furniture upcycling, reupholstery, cleaning, and safety are essential aspects of this trend. Additionally, furniture manufacturers prioritize hardware kits' quality to ensure a seamless home assembly experience for consumers. The market's growth is further supported by furniture imports and exports, which enable a diverse range of choices and competitive pricing. Despite the market's positive outlook, furniture returns remain a challenge due to the complexity of home assembly and the need for accurate hardware kit instructions.
- To address this issue, manufacturers are investing in improving their hardware kits and providing clearer instructions to minimize returns and enhance the customer experience. Overall, the European RTA furniture market's growth is influenced by these trends, ensuring a promising future for manufacturers and consumers alike.
How does Europe Ready To Assemble (RTA) Furniture Market faces challenges face during its growth?
- The RTA furniture industry faces significant growth constraints due to the scarcity of premium-grade raw materials.
- The European ready to assemble (RTA) furniture market is experiencing significant shifts due to various factors. Approximately half of all RTA furniture in Europe is made from wood, making timber a crucial raw material. However, the increasing demand for sustainable furniture and environmental concerns have led to a timber supply shortage. NGOs and other organizations are advocating against excessive deforestation, causing an increase in raw material acquisition costs for manufacturers. To address these issues, regulations such as the EU Timber Regulation (EUTR) have been implemented. This regulation imposes obligations on traders and operators selling timber and timber products in the European market, ensuring the legal origin of the timber.
- Innovations in furniture technology, such as online retail, furniture ratings, and assembly instructions, have transformed the RTA furniture market. Furniture pricing remains competitive, with shipping logistics and furniture care being essential considerations. Furniture suppliers are focusing on providing comprehensive warranties and repair services to enhance customer satisfaction. Furniture packaging is another area of innovation, with companies utilizing more sustainable and eco-friendly materials. Knockdown furniture continues to be popular due to its affordability and ease of assembly. Furniture technology and innovation will continue to shape the RTA furniture market in Europe, ensuring it remains a dynamic and evolving industry.
Exclusive Europe Ready To Assemble (RTA) Furniture Market Customer Landscape
The market forecasting report includes the adoption lifecycle of the market, covering from the innovator's stage to the laggard's stage. It focuses on adoption rates in different regions based on penetration. Furthermore, the report also includes key purchase criteria and drivers of price sensitivity to help companies evaluate and develop their market growth analysis strategies.
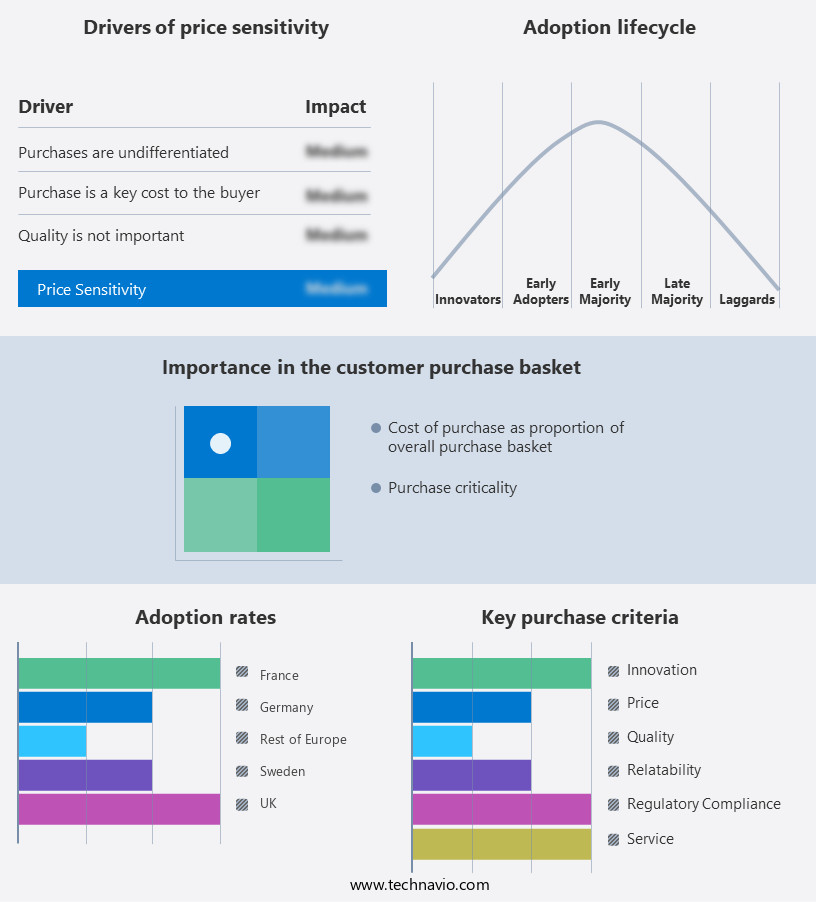
Customer Landscape
Key Companies & Market Insights
Companies are implementing various strategies, such as strategic alliances, market forecast partnerships, mergers and acquisitions, geographical expansion, and product/service launches, to enhance their presence in the market.
The market research and growth report includes detailed analyses of the competitive landscape of the market and information about key companies, including:
- Ashley Global Retail LLC
- BoConcept
- Decorative Panels Holdings Ltd.
- Dorel Industries Inc.
- FABRYKI MEBLI FORTE SA
- Flexa4Dreams AS
- Fritz Hansen
- Friul Intagli Industries Spa
- HAY
- Inter IKEA Holding BV
- Meubles Demeyere SA
- POLIPOL GROUP
- Saviola Holding srl
- Steelcase Inc.
- String Furniture AB
- Tojo Mobel GmbH
- Tvilum AS
Qualitative and quantitative analysis of companies has been conducted to help clients understand the wider business environment as well as the strengths and weaknesses of key market players. Data is qualitatively analyzed to categorize companies as pure play, category-focused, industry-focused, and diversified; it is quantitatively analyzed to categorize companies as dominant, leading, strong, tentative, and weak.
Recent Development and News in Ready To Assemble (RTA) Furniture Market In Europe
- In February 2023, Ikea, the global leader in RTA furniture, announced the launch of its new collection, Klang, designed to promote a more sustainable and circular living. The collection includes over 100 items, with a focus on recycled and renewable materials (Ikea Press Release, 2023).
- In April 2024, furniture manufacturers IKEA and Möbelhaus entered into a strategic partnership, allowing Möbelhaus to sell a selection of IKEA's RTA furniture in their stores across Europe. This collaboration aims to expand IKEA's reach and cater to customers seeking a more traditional shopping experience (Möbelhaus Press Release, 2024).
- In June 2024, the European Commission approved the Horizon 2020 project "FurniFab," which focuses on developing advanced manufacturing technologies for RTA furniture production. The project is expected to create new jobs and reduce the environmental impact of the industry through improved resource efficiency and waste reduction (European Commission Press Release, 2024).
- In November 2024, the RTA furniture market in Europe experienced a significant shift when the leading players, including IKEA, Möbelhaus, and Habitat, adopted a new business model: offering customers the option to rent RTA furniture instead of buying it. This innovative approach, driven by changing consumer preferences and the circular economy trend, is expected to reshape the market dynamics (BusinessWire, 2024).
Research Analyst Overview
The market continues to evolve, with dynamic market activities unfolding across various sectors. Furniture investment remains a significant focus, as consumers seek certified and sustainable options for their homes. Furniture maintenance, including upcycling, reupholstery, cleaning, and repair, gains popularity, while safety certifications ensure peace of mind. Imports and exports shape the market landscape, with hardware kits and assembly tools facilitating home assembly. Furniture manufacturers innovate, offering modular and customizable designs, smart furniture, and e-commerce platforms for seamless purchasing. Sustainability and durability are key trends, driving demand for pre-cut components and flat-pack furniture. Furniture fittings, pricing, and technology influence the supply chain, with retailers prioritizing customer service and affordability.
Furniture ratings and reviews provide valuable insights for consumers, while shipping logistics and packaging materials ensure efficient delivery. The RTA furniture market's continuous evolution reflects the industry's commitment to meeting diverse consumer needs and preferences, with ongoing innovation and adaptation shaping its future.
Dive into Technavio's robust research methodology, blending expert interviews, extensive data synthesis, and validated models for unparalleled Ready To Assemble (RTA) Furniture Market in Europe insights. See full methodology.
|
Market Scope |
|
|
Report Coverage |
Details |
|
Page number |
186 |
|
Base year |
2024 |
|
Historic period |
2019-2023 |
|
Forecast period |
2025-2029 |
|
Growth momentum & CAGR |
Accelerate at a CAGR of 2.1% |
|
Market growth 2025-2029 |
USD 2570.8 million |
|
Market structure |
Fragmented |
|
YoY growth 2024-2025(%) |
2.1 |
|
Competitive landscape |
Leading Companies, Market Positioning of Companies, Competitive Strategies, and Industry Risks |
What are the Key Data Covered in this Market Research Report?
- CAGR of the market during the forecast period
- Detailed information on factors that will drive the market growth and forecasting between 2025 and 2029
- Precise estimation of the size of the market and its contribution of the market in focus to the parent market
- Accurate predictions about upcoming market growth and trends and changes in consumer behaviour
- Growth of the market across Europe
- Thorough analysis of the market's competitive landscape and detailed information about companies
- Comprehensive analysis of factors that will challenge the growth of market companies
We can help! Our analysts can customize this market research report to meet your requirements Get in touch