Ready To Drink (RTD) Coffee Market Analysis, Size, and Forecast 2026-2030: North America (US, Canada, and Mexico), Europe (Germany, UK, and France), APAC (China, Japan, and India), South America (Brazil, Argentina, and Colombia), Middle East and Africa (Saudi Arabia, UAE, and South Africa), and Rest of World (ROW)

Ready To Drink (RTD) Coffee Market Analysis, Size, and Forecast 2026-2030:
North America (US, Canada, and Mexico), Europe (Germany, UK, and France), APAC (China, Japan, and India), South America (Brazil, Argentina, and Colombia), Middle East and Africa (Saudi Arabia, UAE, and South Africa), and Rest of World (ROW)

Published: Mar 2026 292 Pages SKU: IRTNTR75516

Market Overview at a Glance

$16.10 B
Market Opportunity
8.4%
CAGR 2025 - 2030
56.8%
North America Growth
$13.48 B
Glass bottled segment 2024

Ready To Drink (RTD) Coffee Market Size 2026-2030

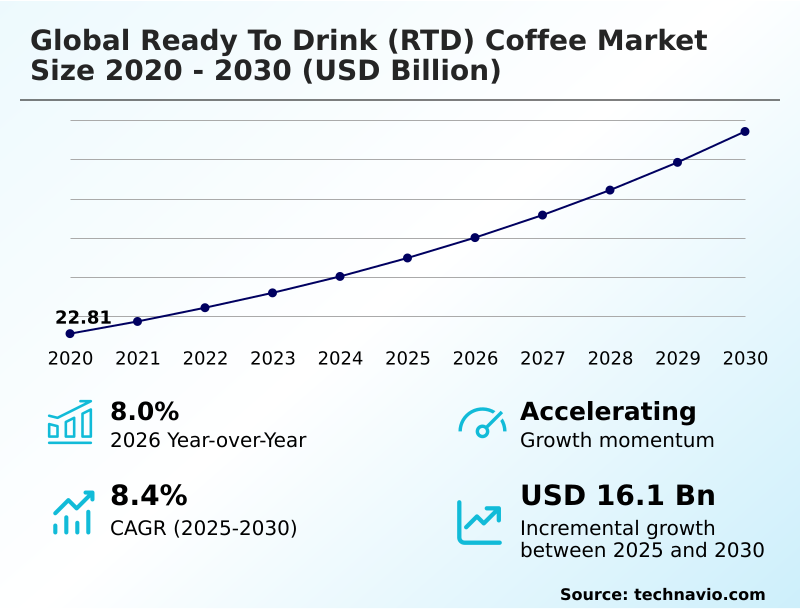
The ready to drink (rtd) coffee market size is valued to increase by USD 16.10 billion, at a CAGR of 8.4% from 2025 to 2030. Rising demand for on-the-go refreshments will drive the ready to drink (rtd) coffee market.

Major Market Trends & Insights

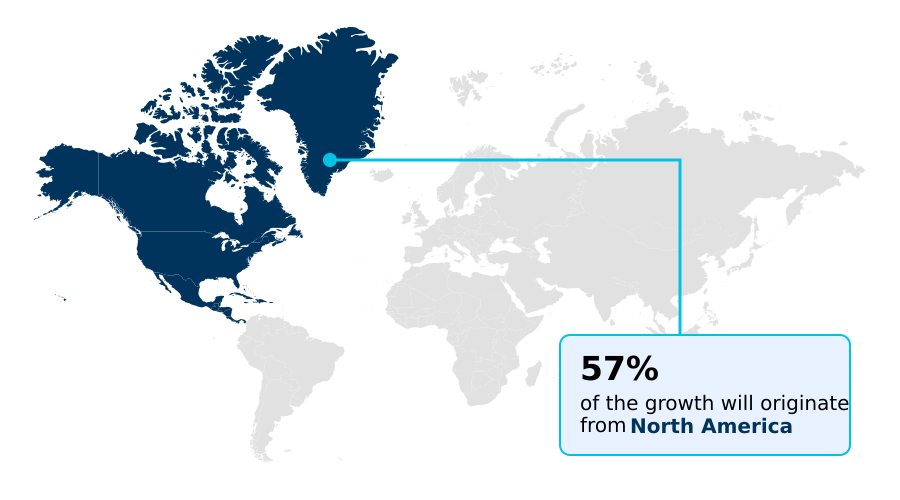
  • North America dominated the market and accounted for a 56.8% growth during the forecast period.
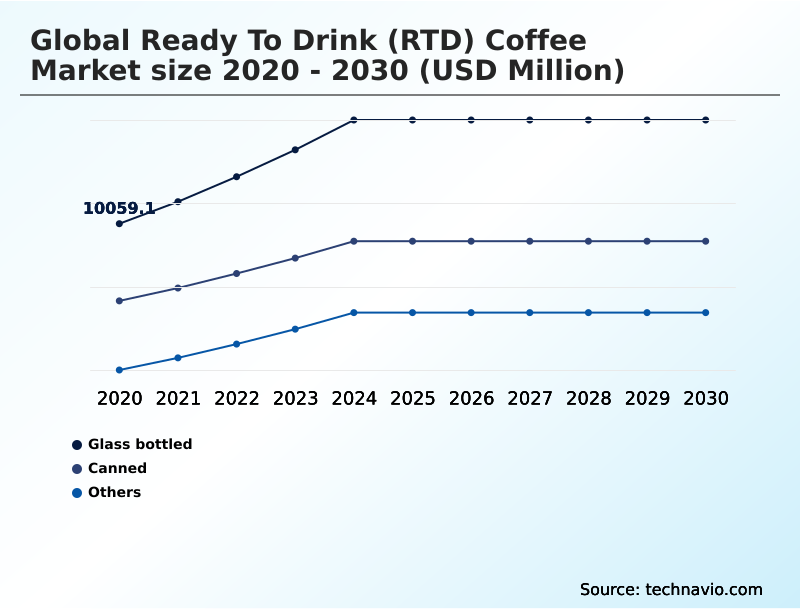
  • By Packaging - Glass bottled segment was valued at USD 13.48 billion in 2024
  • By Distribution Channel - Offline segment accounted for the largest market revenue share in 2024

Market Size & Forecast

  • Market Opportunities: USD 25.73 billion
  • Market Future Opportunities: USD 16.10 billion
  • CAGR from 2025 to 2030 : 8.4%

Market Summary

  • The ready to drink (RTD) coffee market is expanding based on convenience, product diversification, and a focus on wellness. The demand for on-the-go solutions has spurred innovation in shelf-stable formulation and aseptic packaging, allowing for wider distribution without compromising quality. Key trends include the integration of functional ingredients and a shift toward plant-based milk alternatives to cater to health-conscious consumers.
  • Innovations such as cold brew extraction and nitro infusion technology have elevated the sensory experience, offering smoother, low-acid coffee profiles. However, the industry faces challenges in maintaining flavor encapsulation and aroma preservation across long supply chains.
  • For instance, a beverage company must optimize its logistics to ensure a consistent product experience from production to retail, a critical factor for brand loyalty in the competitive ready to drink (RTD) coffee landscape. This involves stringent quality control over everything from arabica bean sourcing to final packaging, addressing both taste consistency and regulatory adherence.
  • The global ready to drink (RTD) coffee market 2026-2030 continues to evolve with consumer preferences.

What will be the Size of the Ready To Drink (RTD) Coffee Market during the forecast period?

Get Key Insights on Market Forecast (PDF) Request Free Sample

How is the Ready To Drink (RTD) Coffee Market Segmented?

The ready to drink (rtd) coffee industry research report provides comprehensive data (region-wise segment analysis), with forecasts and estimates in "USD million" for the period 2026-2030, as well as historical data from 2020-2024 for the following segments.

  • Packaging
    • Glass bottled
    • Canned
    • Others
  • Distribution channel
    • Offline
    • Online
  • Product type
    • Cold brew
    • Iced coffee
    • Others
  • Geography
    • North America
      • US
      • Canada
      • Mexico
    • Europe
      • Germany
      • UK
      • France
    • APAC
      • China
      • Japan
      • India
    • South America
      • Brazil
      • Argentina
      • Colombia
    • Middle East and Africa
      • Saudi Arabia
      • UAE
      • South Africa
    • Rest of World (ROW)

By Packaging Insights

The glass bottled segment is estimated to witness significant growth during the forecast period.

The glass bottled segment signifies the premium tier of the ready to drink (RTD) coffee market, where consumer perception of quality is intrinsically linked to packaging.

This format excels in aroma preservation, maintaining over 95% of the original aromatic integrity of single-origin coffee extract and complex flavor encapsulation. Glass is favored for clean label ingredients as it eliminates chemical leaching concerns, aligning with health-conscious consumerism.

The material's transparency offers a sophisticated presentation, crucial for showcasing the rich color and texture of specialty beverages. For manufacturers, ensuring bottle-sealing integrity is paramount to delivering a consistent, high-quality experience that justifies the premium positioning.

This segment's growth is tied to the rising demand for artisanal quality in a convenient, non-plastic format, leveraging the material's recyclability as a key differentiator.

Request Free Sample

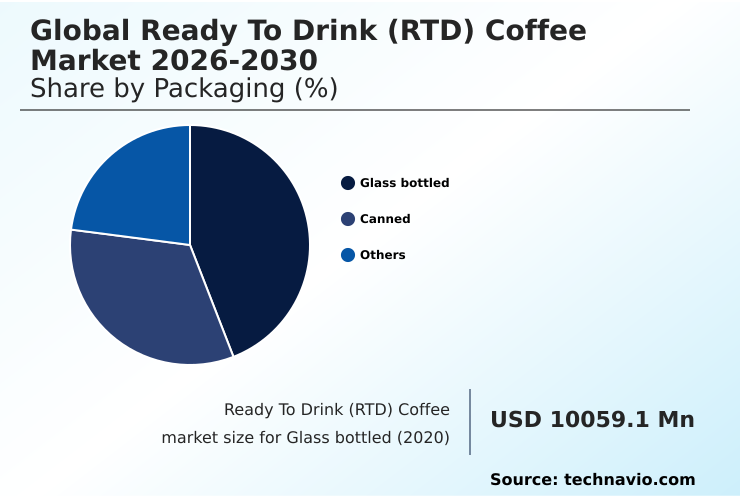
The Glass bottled segment was valued at USD 13.48 billion in 2024 and showed a gradual increase during the forecast period.

Request Free Sample

Regional Analysis

North America is estimated to contribute 56.8% to the growth of the global market during the forecast period.Technavio’s analysts have elaborately explained the regional trends and drivers that shape the market during the forecast period.

See How Ready To Drink (RTD) Coffee Market Demand is Rising in North America Request Free Sample

The geographic landscape of the market is characterized by distinct regional dynamics. North America, a mature market, exhibits strong demand for advanced products like protein-fortified beverages and keto-friendly coffee, contributing over 56% of the sector's incremental growth.

The region's focus is on premiumization and functional benefits, leveraging sophisticated distribution networks. In contrast, high-growth markets in APAC are driven by rising disposable incomes and the initial adoption of convenient beverage formats.

The expansion in this region, which outpaces Europe by a factor of 1.5, is largely centered on foundational products like canned coffee and soluble coffee powder.

European markets show steady growth, with increasing interest in sustainable sourcing certification and clean label ingredients. This global divergence requires flexible strategies, balancing the introduction of UHT processing in emerging regions with continuous innovation in established ones.
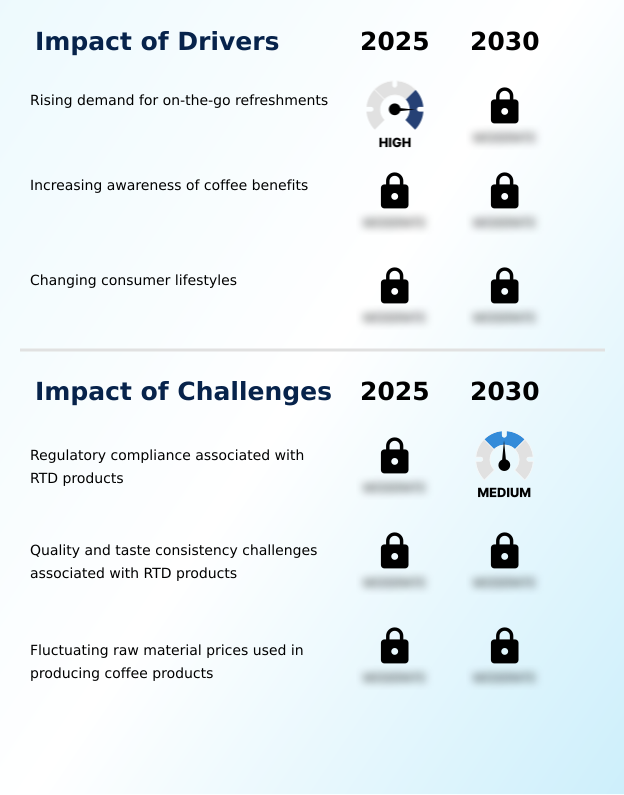
Market Dynamics

Our researchers analyzed the data with 2025 as the base year, along with the key drivers, trends, and challenges. A holistic analysis of drivers will help companies refine their marketing strategies to gain a competitive advantage.

  • Strategic decision-making in the market requires a deep understanding of interconnected technical and commercial factors. A critical consideration is the impact of brewing method on taste, where the consumer preference for cold brew vs iced coffee dictates investment in specific extraction technologies.
  • The formulation of low-sugar coffee drinks has become a primary focus, presenting challenges in maintaining flavor consistency while adhering to health trends. For dairy-free options, the successful integration of plant-based protein in coffee beverages hinges on advanced emulsifiers and flavor masking for protein additives.
  • Operationally, preventing sedimentation in bottled coffee and achieving the desired nitro coffee texture and mouthfeel are key quality benchmarks. The cost analysis of glass vs can packaging directly influences pricing strategies and sustainability in RTD coffee packaging initiatives.
  • Furthermore, navigating the complexities of the supply chain for single-origin RTD products and ensuring regulatory compliance for functional claims are essential for market access. Firms adopting advancements in aseptic filling technology have reduced line changeover times by 20% compared to traditional retort processing.
  • Ultimately, success depends on balancing innovations in resealable can technology with a robust framework for ethical sourcing and brand perception, all while considering the impact of water quality on brewing.

What are the key market drivers leading to the rise in the adoption of Ready To Drink (RTD) Coffee Industry?

  • The rising demand for on-the-go refreshments is a key driver propelling market growth, fueled by fast-paced consumer lifestyles.

  • The primary driver for the ready to drink (RTD) coffee market remains the consumer's need for convenience, which is reshaping product formulation and distribution.
  • The demand for portable, on-the-go options has propelled the adoption of shelf-stable formulation and advanced packaging solutions. For instance, implementing UHT processing enables distribution into new retail channels, expanding market reach by an estimated 15%.
  • This technology, combined with aseptic packaging, ensures a long shelf life without refrigeration, a critical factor for convenience stores and vending machines. Innovations in beverage carbonation and single-origin coffee extract are also making premium experiences more accessible.
  • As lifestyles become more hectic, products that offer both a caffeine boost and nutritional value, such as protein-fortified beverages, are gaining significant momentum in the market.

What are the market trends shaping the Ready To Drink (RTD) Coffee Industry?

  • The market is characterized by a significant upward trend in product innovations. This surge is driven by companies introducing novel formulations and formats to meet evolving consumer demands.

  • Innovation in the ready to drink (RTD) coffee market is accelerating, driven by evolving consumer palates and a demand for functional benefits. The adoption of the flash-brew method has improved throughput by 25% for some producers, enabling faster production of premium-tasting coffee.
  • A prominent trend is the rise of sophisticated oat milk latte formulation and other dairy-free creamers, catering to the plant-based movement. Nitro infusion technology continues to gain traction, creating beverages with a unique, creamy texture that commands a higher price point.
  • Furthermore, product lines incorporating prebiotic fiber infusion have demonstrated an 18% higher market penetration in their initial launch quarter, highlighting the appeal of value-added wellness attributes. The use of natural sweeteners and advanced sweetener systems is becoming standard practice to reduce sugar content while maintaining taste.

What challenges does the Ready To Drink (RTD) Coffee Industry face during its growth?

  • Navigating regulatory compliance associated with ready-to-drink products presents a key challenge that affects the industry's growth trajectory.

  • Navigating complex regulations and ensuring product consistency are significant challenges in the ready to drink (RTD) coffee market. Reformulating products to meet new sugar-reduction mandates can increase R&D costs by up to 20%, while caffeine content standardization requires stringent process controls. Achieving long-term emulsifier stability in dairy-free and protein-fortified beverages is a persistent technical hurdle.
  • Furthermore, obtaining and maintaining sustainable sourcing certification for fair trade coffee beans can increase supply chain compliance costs by over 5%. These pressures require a delicate balance between innovation and operational discipline.
  • Producers must manage a global supply of raw materials, from arabica bean sourcing to robusta bean blend, while guaranteeing that every unit meets both regulatory standards and consumer expectations for taste and quality.

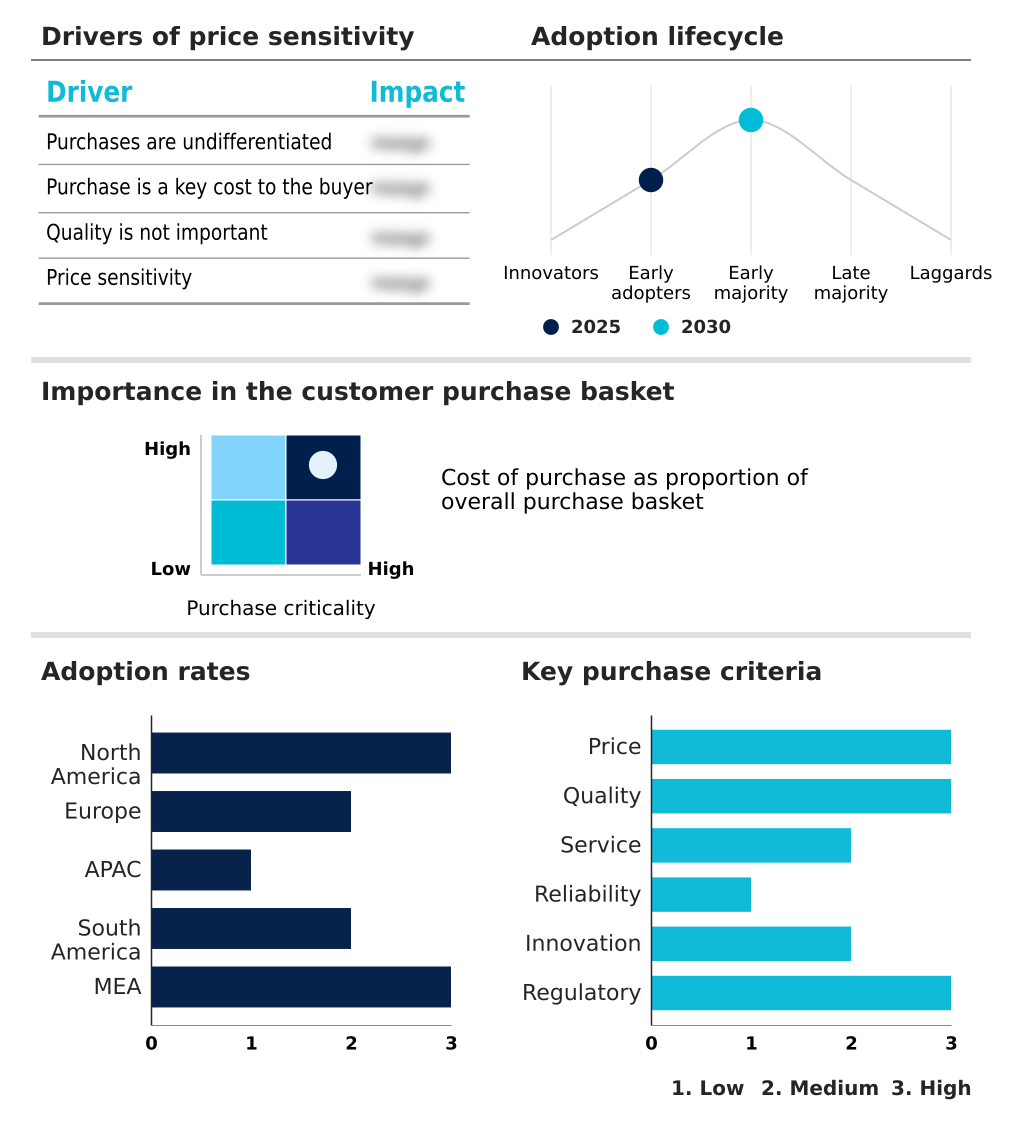
Exclusive Technavio Analysis on Customer Landscape

The ready to drink (rtd) coffee market forecasting report includes the adoption lifecycle of the market, covering from the innovator’s stage to the laggard’s stage. It focuses on adoption rates in different regions based on penetration. Furthermore, the ready to drink (rtd) coffee market report also includes key purchase criteria and drivers of price sensitivity to help companies evaluate and develop their market growth analysis strategies.

Customer Landscape of Ready To Drink (RTD) Coffee Industry

Competitive Landscape

Companies are implementing various strategies, such as strategic alliances, ready to drink (rtd) coffee market forecast, partnerships, mergers and acquisitions, geographical expansion, and product/service launches, to enhance their presence in the industry.

Arla Foods Ingredients Group - Delivering premium, coffeehouse-inspired beverage experiences, with a focus on crafted cold brew and flavored ready-to-drink options for discerning consumers.

The industry research and growth report includes detailed analyses of the competitive landscape of the market and information about key companies, including:

  • Arla Foods Ingredients Group
  • Bolthouse Farms Inc.
  • Bulletproof 360 Inc.
  • Califia Farms LLC
  • Caribou Coffee Operating Co. Inc.
  • Danone SA
  • Heartland Food Products Group
  • illycaffe SpA
  • Inspire Brands Inc.
  • Keurig Dr Pepper Inc.
  • Lotte Chilsung Beverage Co. Ltd.
  • McDonald Corp.
  • Nestle SA
  • PepsiCo Inc.
  • Restaurant Brands Inc.
  • Starbucks Corp.
  • Suntory Beverage and Food Ltd.
  • Tan Do Beverage
  • The Coca Cola Co.
  • The J.M. Smucker Co.

Qualitative and quantitative analysis of companies has been conducted to help clients understand the wider business environment as well as the strengths and weaknesses of key industry players. Data is qualitatively analyzed to categorize companies as pure play, category-focused, industry-focused, and diversified; it is quantitatively analyzed to categorize companies as dominant, leading, strong, tentative, and weak.

Recent Development and News in Ready to drink (rtd) coffee market

  • In September 2024, Nestle SA launched its first ready-to-drink coffee under the Nespresso brand in the United States, targeting the premium segment with glass-bottled offerings.
  • In January 2025, the Food Safety and Standards Authority of India (FSSAI) notified new regulations for beverages, introducing specific standards for soluble coffee and chicory mixtures, impacting product formulation and labeling.
  • In April 2025, Nestle SA announced the launch of its Nescafe Ready-to-Drink cold coffee range, aiming to leverage its soluble coffee expertise in the growing portable beverage market.
  • In May 2025, Pop and Bottle expanded its portfolio by launching its RTD Double Cold Brew Oat Milk Latte, a clean-label product featuring coffee cherry antioxidants and natural sweeteners.

Dive into Technavio’s robust research methodology, blending expert interviews, extensive data synthesis, and validated models for unparalleled Ready To Drink (RTD) Coffee Market insights. See full methodology.

Market Scope
Page number 292
Base year 2025
Historic period 2020-2024
Forecast period 2026-2030
Growth momentum & CAGR Accelerate at a CAGR of 8.4%
Market growth 2026-2030 USD 16104.7 million
Market structure Fragmented
YoY growth 2025-2026(%) 8.0%
Key countries US, Canada, Mexico, Germany, UK, France, Italy, Spain, The Netherlands, China, Japan, India, South Korea, Australia, Indonesia, Brazil, Argentina, Colombia, Saudi Arabia, UAE, South Africa, Egypt and Kenya
Competitive landscape Leading Companies, Market Positioning of Companies, Competitive Strategies, and Industry Risks

Request Free Sample

Research Analyst Overview

  • The ready to drink (RTD) coffee market is driven by the convergence of convenience and wellness, compelling a strategic realignment in product development. The focus has shifted toward shelf-stable formulation and aseptic packaging, ensuring product integrity across extensive supply chains. The integration of functional ingredients and plant-based milk alternatives is no longer a niche but a core expectation.
  • Boardroom decisions increasingly center on allocating R&D for innovations like cold brew extraction, flash-brew method, and nitro infusion technology to capture a younger demographic. Adherence to non-GMO verification and clean label ingredients is now a baseline for market entry, with firms that have adopted these standards seeing up to a 5% higher repeat purchase rate.
  • The technical challenges of ensuring emulsifier stability and caffeine content standardization are significant. Success hinges on mastering UHT processing and retort processing while managing a complex supply chain that includes everything from arabica bean sourcing and robusta bean blend to fair trade coffee beans and sustainable sourcing certification.
  • This requires a balanced approach to innovation, covering soluble coffee powder, micro-ground coffee, and beverage carbonation, alongside packaging like canned coffee lining and bottle-sealing integrity.

What are the Key Data Covered in this Ready To Drink (RTD) Coffee Market Research and Growth Report?

  • What is the expected growth of the Ready To Drink (RTD) Coffee Market between 2026 and 2030?

    • USD 16.10 billion, at a CAGR of 8.4%

  • What segmentation does the market report cover?

    • The report is segmented by Packaging (Glass bottled, Canned, and Others), Distribution Channel (Offline, and Online), Product Type (Cold brew, Iced coffee, and Others) and Geography (North America, Europe, APAC, South America, Middle East and Africa)

  • Which regions are analyzed in the report?

    • North America, Europe, APAC, South America and Middle East and Africa

  • What are the key growth drivers and market challenges?

    • Rising demand for on-the-go refreshments, Regulatory compliance associated with RTD products

  • Who are the major players in the Ready To Drink (RTD) Coffee Market?

    • Arla Foods Ingredients Group, Bolthouse Farms Inc., Bulletproof 360 Inc., Califia Farms LLC, Caribou Coffee Operating Co. Inc., Danone SA, Heartland Food Products Group, illycaffe SpA, Inspire Brands Inc., Keurig Dr Pepper Inc., Lotte Chilsung Beverage Co. Ltd., McDonald Corp., Nestle SA, PepsiCo Inc., Restaurant Brands Inc., Starbucks Corp., Suntory Beverage and Food Ltd., Tan Do Beverage, The Coca Cola Co. and The J.M. Smucker Co.

Market Research Insights

  • The market dynamics are shaped by a confluence of consumer demand for convenience and a growing emphasis on health, driving rapid innovation. The adoption of advanced UHT processing has enabled manufacturers to extend shelf life, reducing spoilage rates by over 15% and expanding distribution reach.
  • Concurrently, the popularity of formats utilizing nitro-infusion technology continues to rise, with brands reporting up to a 10% increase in consumer loyalty for these texturally enhanced beverages. This push for premiumization is balanced by the need for accessible price points. Firms are actively exploring sweetener system innovations and natural flavor additives to create differentiated products.
  • Strategic investment in beverage carbonation and sustainable sourcing certification is becoming critical for maintaining a competitive edge in an increasingly crowded field.

We can help! Our analysts can customize this ready to drink (rtd) coffee market research report to meet your requirements.

Get in touch

1. Executive Summary

1.1 Market overview

Executive Summary - Chart on Market Overview
Executive Summary - Data Table on Market Overview
Executive Summary - Chart on Global Market Characteristics
Executive Summary - Chart on Market by Geography
Executive Summary - Chart on Market Segmentation by Packaging
Executive Summary - Chart on Market Segmentation by Distribution Channel
Executive Summary - Chart on Market Segmentation by Product Type
Executive Summary - Chart on Incremental Growth
Executive Summary - Data Table on Incremental Growth
Executive Summary - Chart on Company Market Positioning

2. Technavio Analysis

2.1 Analysis of price sensitivity, lifecycle, customer purchase basket, adoption rates, and purchase criteria

2.2 Criticality of inputs and Factors of differentiation

Chart on Overview on criticality of inputs and factors of differentiation

2.3 Factors of disruption

Chart on Overview on factors of disruption

2.4 Impact of drivers and challenges

Chart on Impact of drivers and challenges in 2025 and 2030

3. Market Landscape

3.1 Market ecosystem

Chart on Parent Market
Data Table on - Parent Market

3.2 Market characteristics

Chart on Market characteristics analysis

3.3 Value chain analysis

Chart on Value chain analysis

4. Market Sizing

4.1 Market definition

Data Table on Offerings of companies included in the market definition

4.2 Market segment analysis

Market segments

4.3 Market size 2025

4.4 Market outlook: Forecast for 2025-2030

Chart on Global - Market size and forecast 2025-2030 ($ million)
Data Table on Global - Market size and forecast 2025-2030 ($ million)
Chart on Global Market: Year-over-year growth 2025-2030 (%)
Data Table on Global Market: Year-over-year growth 2025-2030 (%)

5. Historic Market Size

5.1 Global Ready To Drink (RTD) Coffee Market 2020 - 2024

Historic Market Size - Data Table on Global Ready To Drink (RTD) Coffee Market 2020 - 2024 ($ million)

5.2 Packaging segment analysis 2020 - 2024

Historic Market Size - Packaging Segment 2020 - 2024 ($ million)

5.3 Distribution Channel segment analysis 2020 - 2024

Historic Market Size - Distribution Channel Segment 2020 - 2024 ($ million)

5.4 Product Type segment analysis 2020 - 2024

Historic Market Size - Product Type Segment 2020 - 2024 ($ million)

5.5 Geography segment analysis 2020 - 2024

Historic Market Size - Geography Segment 2020 - 2024 ($ million)

5.6 Country segment analysis 2020 - 2024

Historic Market Size - Country Segment 2020 - 2024 ($ million)

6. Qualitative Analysis

6.1 Impact of AI on Global Ready to Drink (RTD) Coffee Market

7. Five Forces Analysis

7.1 Five forces summary

Five forces analysis - Comparison between 2025 and 2030

7.2 Bargaining power of buyers

Bargaining power of buyers - Impact of key factors 2025 and 2030

7.3 Bargaining power of suppliers

Bargaining power of suppliers - Impact of key factors in 2025 and 2030

7.4 Threat of new entrants

Threat of new entrants - Impact of key factors in 2025 and 2030

7.5 Threat of substitutes

Threat of substitutes - Impact of key factors in 2025 and 2030

7.6 Threat of rivalry

Threat of rivalry - Impact of key factors in 2025 and 2030

7.7 Market condition

Chart on Market condition - Five forces 2025 and 2030

8. Market Segmentation by Packaging

8.1 Market segments

Chart on Packaging - Market share 2025-2030 (%)
Data Table on Packaging - Market share 2025-2030 (%)

8.2 Comparison by Packaging

Chart on Comparison by Packaging
Data Table on Comparison by Packaging

8.3 Glass bottled - Market size and forecast 2025-2030

Chart on Glass bottled - Market size and forecast 2025-2030 ($ million)
Data Table on Glass bottled - Market size and forecast 2025-2030 ($ million)
Chart on Glass bottled - Year-over-year growth 2025-2030 (%)
Data Table on Glass bottled - Year-over-year growth 2025-2030 (%)

8.4 Canned - Market size and forecast 2025-2030

Chart on Canned - Market size and forecast 2025-2030 ($ million)
Data Table on Canned - Market size and forecast 2025-2030 ($ million)
Chart on Canned - Year-over-year growth 2025-2030 (%)
Data Table on Canned - Year-over-year growth 2025-2030 (%)

8.5 Others - Market size and forecast 2025-2030

Chart on Others - Market size and forecast 2025-2030 ($ million)
Data Table on Others - Market size and forecast 2025-2030 ($ million)
Chart on Others - Year-over-year growth 2025-2030 (%)
Data Table on Others - Year-over-year growth 2025-2030 (%)

8.6 Market opportunity by Packaging

Market opportunity by Packaging ($ million)
Data Table on Market opportunity by Packaging ($ million)

9. Market Segmentation by Distribution Channel

9.1 Market segments

Chart on Distribution Channel - Market share 2025-2030 (%)
Data Table on Distribution Channel - Market share 2025-2030 (%)

9.2 Comparison by Distribution Channel

Chart on Comparison by Distribution Channel
Data Table on Comparison by Distribution Channel

9.3 Offline - Market size and forecast 2025-2030

Chart on Offline - Market size and forecast 2025-2030 ($ million)
Data Table on Offline - Market size and forecast 2025-2030 ($ million)
Chart on Offline - Year-over-year growth 2025-2030 (%)
Data Table on Offline - Year-over-year growth 2025-2030 (%)

9.4 Online - Market size and forecast 2025-2030

Chart on Online - Market size and forecast 2025-2030 ($ million)
Data Table on Online - Market size and forecast 2025-2030 ($ million)
Chart on Online - Year-over-year growth 2025-2030 (%)
Data Table on Online - Year-over-year growth 2025-2030 (%)

9.5 Market opportunity by Distribution Channel

Market opportunity by Distribution Channel ($ million)
Data Table on Market opportunity by Distribution Channel ($ million)

10. Market Segmentation by Product Type

10.1 Market segments

Chart on Product Type - Market share 2025-2030 (%)
Data Table on Product Type - Market share 2025-2030 (%)

10.2 Comparison by Product Type

Chart on Comparison by Product Type
Data Table on Comparison by Product Type

10.3 Cold brew - Market size and forecast 2025-2030

Chart on Cold brew - Market size and forecast 2025-2030 ($ million)
Data Table on Cold brew - Market size and forecast 2025-2030 ($ million)
Chart on Cold brew - Year-over-year growth 2025-2030 (%)
Data Table on Cold brew - Year-over-year growth 2025-2030 (%)

10.4 Iced coffee - Market size and forecast 2025-2030

Chart on Iced coffee - Market size and forecast 2025-2030 ($ million)
Data Table on Iced coffee - Market size and forecast 2025-2030 ($ million)
Chart on Iced coffee - Year-over-year growth 2025-2030 (%)
Data Table on Iced coffee - Year-over-year growth 2025-2030 (%)

10.5 Others - Market size and forecast 2025-2030

Chart on Others - Market size and forecast 2025-2030 ($ million)
Data Table on Others - Market size and forecast 2025-2030 ($ million)
Chart on Others - Year-over-year growth 2025-2030 (%)
Data Table on Others - Year-over-year growth 2025-2030 (%)

10.6 Market opportunity by Product Type

Market opportunity by Product Type ($ million)
Data Table on Market opportunity by Product Type ($ million)

11. Customer Landscape

11.1 Customer landscape overview

Analysis of price sensitivity, lifecycle, customer purchase basket, adoption rates, and purchase criteria

12. Geographic Landscape

12.1 Geographic segmentation

Chart on Market share by geography 2025-2030 (%)
Data Table on Market share by geography 2025-2030 (%)

12.2 Geographic comparison

Chart on Geographic comparison
Data Table on Geographic comparison

12.3 North America - Market size and forecast 2025-2030

Chart on North America - Market size and forecast 2025-2030 ($ million)
Data Table on North America - Market size and forecast 2025-2030 ($ million)
Chart on North America - Year-over-year growth 2025-2030 (%)
Data Table on North America - Year-over-year growth 2025-2030 (%)
Chart on Regional Comparison - North America
Data Table on Regional Comparison - North America

12.3.1 US - Market size and forecast 2025-2030

Chart on US - Market size and forecast 2025-2030 ($ million)
Data Table on US - Market size and forecast 2025-2030 ($ million)
Chart on US - Year-over-year growth 2025-2030 (%)
Data Table on US - Year-over-year growth 2025-2030 (%)

12.3.2 Canada - Market size and forecast 2025-2030

Chart on Canada - Market size and forecast 2025-2030 ($ million)
Data Table on Canada - Market size and forecast 2025-2030 ($ million)
Chart on Canada - Year-over-year growth 2025-2030 (%)
Data Table on Canada - Year-over-year growth 2025-2030 (%)

12.3.3 Mexico - Market size and forecast 2025-2030

Chart on Mexico - Market size and forecast 2025-2030 ($ million)
Data Table on Mexico - Market size and forecast 2025-2030 ($ million)
Chart on Mexico - Year-over-year growth 2025-2030 (%)
Data Table on Mexico - Year-over-year growth 2025-2030 (%)

12.4 Europe - Market size and forecast 2025-2030

Chart on Europe - Market size and forecast 2025-2030 ($ million)
Data Table on Europe - Market size and forecast 2025-2030 ($ million)
Chart on Europe - Year-over-year growth 2025-2030 (%)
Data Table on Europe - Year-over-year growth 2025-2030 (%)
Chart on Regional Comparison - Europe
Data Table on Regional Comparison - Europe

12.4.1 Germany - Market size and forecast 2025-2030

Chart on Germany - Market size and forecast 2025-2030 ($ million)
Data Table on Germany - Market size and forecast 2025-2030 ($ million)
Chart on Germany - Year-over-year growth 2025-2030 (%)
Data Table on Germany - Year-over-year growth 2025-2030 (%)

12.4.2 UK - Market size and forecast 2025-2030

Chart on UK - Market size and forecast 2025-2030 ($ million)
Data Table on UK - Market size and forecast 2025-2030 ($ million)
Chart on UK - Year-over-year growth 2025-2030 (%)
Data Table on UK - Year-over-year growth 2025-2030 (%)

12.4.3 France - Market size and forecast 2025-2030

Chart on France - Market size and forecast 2025-2030 ($ million)
Data Table on France - Market size and forecast 2025-2030 ($ million)
Chart on France - Year-over-year growth 2025-2030 (%)
Data Table on France - Year-over-year growth 2025-2030 (%)

12.4.4 Italy - Market size and forecast 2025-2030

Chart on Italy - Market size and forecast 2025-2030 ($ million)
Data Table on Italy - Market size and forecast 2025-2030 ($ million)
Chart on Italy - Year-over-year growth 2025-2030 (%)
Data Table on Italy - Year-over-year growth 2025-2030 (%)

12.4.5 Spain - Market size and forecast 2025-2030

Chart on Spain - Market size and forecast 2025-2030 ($ million)
Data Table on Spain - Market size and forecast 2025-2030 ($ million)
Chart on Spain - Year-over-year growth 2025-2030 (%)
Data Table on Spain - Year-over-year growth 2025-2030 (%)

12.4.6 The Netherlands - Market size and forecast 2025-2030

Chart on The Netherlands - Market size and forecast 2025-2030 ($ million)
Data Table on The Netherlands - Market size and forecast 2025-2030 ($ million)
Chart on The Netherlands - Year-over-year growth 2025-2030 (%)
Data Table on The Netherlands - Year-over-year growth 2025-2030 (%)

12.5 APAC - Market size and forecast 2025-2030

Chart on APAC - Market size and forecast 2025-2030 ($ million)
Data Table on APAC - Market size and forecast 2025-2030 ($ million)
Chart on APAC - Year-over-year growth 2025-2030 (%)
Data Table on APAC - Year-over-year growth 2025-2030 (%)
Chart on Regional Comparison - APAC
Data Table on Regional Comparison - APAC

12.5.1 China - Market size and forecast 2025-2030

Chart on China - Market size and forecast 2025-2030 ($ million)
Data Table on China - Market size and forecast 2025-2030 ($ million)
Chart on China - Year-over-year growth 2025-2030 (%)
Data Table on China - Year-over-year growth 2025-2030 (%)

12.5.2 Japan - Market size and forecast 2025-2030

Chart on Japan - Market size and forecast 2025-2030 ($ million)
Data Table on Japan - Market size and forecast 2025-2030 ($ million)
Chart on Japan - Year-over-year growth 2025-2030 (%)
Data Table on Japan - Year-over-year growth 2025-2030 (%)

12.5.3 India - Market size and forecast 2025-2030

Chart on India - Market size and forecast 2025-2030 ($ million)
Data Table on India - Market size and forecast 2025-2030 ($ million)
Chart on India - Year-over-year growth 2025-2030 (%)
Data Table on India - Year-over-year growth 2025-2030 (%)

12.5.4 South Korea - Market size and forecast 2025-2030

Chart on South Korea - Market size and forecast 2025-2030 ($ million)
Data Table on South Korea - Market size and forecast 2025-2030 ($ million)
Chart on South Korea - Year-over-year growth 2025-2030 (%)
Data Table on South Korea - Year-over-year growth 2025-2030 (%)

12.5.5 Australia - Market size and forecast 2025-2030

Chart on Australia - Market size and forecast 2025-2030 ($ million)
Data Table on Australia - Market size and forecast 2025-2030 ($ million)
Chart on Australia - Year-over-year growth 2025-2030 (%)
Data Table on Australia - Year-over-year growth 2025-2030 (%)

12.5.6 Indonesia - Market size and forecast 2025-2030

Chart on Indonesia - Market size and forecast 2025-2030 ($ million)
Data Table on Indonesia - Market size and forecast 2025-2030 ($ million)
Chart on Indonesia - Year-over-year growth 2025-2030 (%)
Data Table on Indonesia - Year-over-year growth 2025-2030 (%)

12.6 South America - Market size and forecast 2025-2030

Chart on South America - Market size and forecast 2025-2030 ($ million)
Data Table on South America - Market size and forecast 2025-2030 ($ million)
Chart on South America - Year-over-year growth 2025-2030 (%)
Data Table on South America - Year-over-year growth 2025-2030 (%)
Chart on Regional Comparison - South America
Data Table on Regional Comparison - South America

12.6.1 Brazil - Market size and forecast 2025-2030

Chart on Brazil - Market size and forecast 2025-2030 ($ million)
Data Table on Brazil - Market size and forecast 2025-2030 ($ million)
Chart on Brazil - Year-over-year growth 2025-2030 (%)
Data Table on Brazil - Year-over-year growth 2025-2030 (%)

12.6.2 Argentina - Market size and forecast 2025-2030

Chart on Argentina - Market size and forecast 2025-2030 ($ million)
Data Table on Argentina - Market size and forecast 2025-2030 ($ million)
Chart on Argentina - Year-over-year growth 2025-2030 (%)
Data Table on Argentina - Year-over-year growth 2025-2030 (%)

12.6.3 Colombia - Market size and forecast 2025-2030

Chart on Colombia - Market size and forecast 2025-2030 ($ million)
Data Table on Colombia - Market size and forecast 2025-2030 ($ million)
Chart on Colombia - Year-over-year growth 2025-2030 (%)
Data Table on Colombia - Year-over-year growth 2025-2030 (%)

12.7 Middle East and Africa - Market size and forecast 2025-2030

Chart on Middle East and Africa - Market size and forecast 2025-2030 ($ million)
Data Table on Middle East and Africa - Market size and forecast 2025-2030 ($ million)
Chart on Middle East and Africa - Year-over-year growth 2025-2030 (%)
Data Table on Middle East and Africa - Year-over-year growth 2025-2030 (%)
Chart on Regional Comparison - Middle East and Africa
Data Table on Regional Comparison - Middle East and Africa

12.7.1 Saudi Arabia - Market size and forecast 2025-2030

Chart on Saudi Arabia - Market size and forecast 2025-2030 ($ million)
Data Table on Saudi Arabia - Market size and forecast 2025-2030 ($ million)
Chart on Saudi Arabia - Year-over-year growth 2025-2030 (%)
Data Table on Saudi Arabia - Year-over-year growth 2025-2030 (%)

12.7.2 UAE - Market size and forecast 2025-2030

Chart on UAE - Market size and forecast 2025-2030 ($ million)
Data Table on UAE - Market size and forecast 2025-2030 ($ million)
Chart on UAE - Year-over-year growth 2025-2030 (%)
Data Table on UAE - Year-over-year growth 2025-2030 (%)

12.7.3 South Africa - Market size and forecast 2025-2030

Chart on South Africa - Market size and forecast 2025-2030 ($ million)
Data Table on South Africa - Market size and forecast 2025-2030 ($ million)
Chart on South Africa - Year-over-year growth 2025-2030 (%)
Data Table on South Africa - Year-over-year growth 2025-2030 (%)

12.7.4 Egypt - Market size and forecast 2025-2030

Chart on Egypt - Market size and forecast 2025-2030 ($ million)
Data Table on Egypt - Market size and forecast 2025-2030 ($ million)
Chart on Egypt - Year-over-year growth 2025-2030 (%)
Data Table on Egypt - Year-over-year growth 2025-2030 (%)

12.7.5 Kenya - Market size and forecast 2025-2030

Chart on Kenya - Market size and forecast 2025-2030 ($ million)
Data Table on Kenya - Market size and forecast 2025-2030 ($ million)
Chart on Kenya - Year-over-year growth 2025-2030 (%)
Data Table on Kenya - Year-over-year growth 2025-2030 (%)

12.8 Market opportunity by geography

Market opportunity by geography ($ million)
Data Tables on Market opportunity by geography ($ million)

13. Drivers, Challenges, and Opportunity

13.1 Market drivers

Rising demand for on-the-go refreshments
Increasing awareness of coffee benefits
Changing consumer lifestyles

13.2 Market challenges

Regulatory compliance associated with RTD products
Quality and taste consistency challenges associated with RTD products
Fluctuating raw material prices used in producing coffee products

13.3 Impact of drivers and challenges

Impact of drivers and challenges in 2025 and 2030

13.4 Market opportunities

Growing number of product innovations
Growing popularity of e-commerce platforms
Focused product packaging and design formats

14. Competitive Landscape

14.1 Overview

14.2

Overview on criticality of inputs and factors of differentiation

14.3 Landscape disruption

Overview on factors of disruption

14.4 Industry risks

Impact of key risks on business

15. Competitive Analysis

15.1 Companies profiled

Companies covered

15.2 Company ranking index

15.3 Market positioning of companies

Matrix on companies position and classification

15.4 Caribou Coffee Operating Co. Inc.

Caribou Coffee Operating Co. Inc. - Overview
Caribou Coffee Operating Co. Inc. - Product / Service
Caribou Coffee Operating Co. Inc. - Key offerings
SWOT

15.5 Danone SA

Danone SA - Overview
Danone SA - Business segments
Danone SA - Key news
Danone SA - Key offerings
Danone SA - Segment focus
SWOT

15.6 Heartland Food Products Group

Heartland Food Products Group - Overview
Heartland Food Products Group - Product / Service
Heartland Food Products Group - Key offerings
SWOT

15.7 illycaffe SpA

illycaffe SpA - Overview
illycaffe SpA - Product / Service
illycaffe SpA - Key offerings
SWOT

15.8 Inspire Brands Inc.

Inspire Brands Inc. - Overview
Inspire Brands Inc. - Product / Service
Inspire Brands Inc. - Key offerings
SWOT

15.9 Keurig Dr Pepper Inc.

Keurig Dr Pepper Inc. - Overview
Keurig Dr Pepper Inc. - Business segments
Keurig Dr Pepper Inc. - Key offerings
Keurig Dr Pepper Inc. - Segment focus
SWOT

15.10 Lotte Chilsung Beverage Co. Ltd.

Lotte Chilsung Beverage Co. Ltd. - Overview
Lotte Chilsung Beverage Co. Ltd. - Product / Service
Lotte Chilsung Beverage Co. Ltd. - Key offerings
SWOT

15.11 McDonald Corp.

McDonald Corp. - Overview
McDonald Corp. - Business segments
McDonald Corp. - Key offerings
McDonald Corp. - Segment focus
SWOT

15.12 Nestle SA

Nestle SA - Overview
Nestle SA - Business segments
Nestle SA - Key news
Nestle SA - Key offerings
Nestle SA - Segment focus
SWOT

15.13 PepsiCo Inc.

PepsiCo Inc. - Overview
PepsiCo Inc. - Business segments
PepsiCo Inc. - Key news
PepsiCo Inc. - Key offerings
PepsiCo Inc. - Segment focus
SWOT

15.14 Restaurant Brands Inc.

Restaurant Brands Inc. - Overview
Restaurant Brands Inc. - Business segments
Restaurant Brands Inc. - Key news
Restaurant Brands Inc. - Key offerings
Restaurant Brands Inc. - Segment focus
SWOT

15.15 Starbucks Corp.

Starbucks Corp. - Overview
Starbucks Corp. - Business segments
Starbucks Corp. - Key news
Starbucks Corp. - Key offerings
Starbucks Corp. - Segment focus
SWOT

15.16 Suntory Beverage and Food Ltd.

Suntory Beverage and Food Ltd. - Overview
Suntory Beverage and Food Ltd. - Business segments
Suntory Beverage and Food Ltd. - Key news
Suntory Beverage and Food Ltd. - Key offerings
Suntory Beverage and Food Ltd. - Segment focus
SWOT

15.17 The Coca Cola Co.

The Coca Cola Co. - Overview
The Coca Cola Co. - Business segments
The Coca Cola Co. - Key news
The Coca Cola Co. - Key offerings
The Coca Cola Co. - Segment focus
SWOT

15.18 The J.M. Smucker Co.

The J.M. Smucker Co. - Overview
The J.M. Smucker Co. - Business segments
The J.M. Smucker Co. - Key news
The J.M. Smucker Co. - Key offerings
The J.M. Smucker Co. - Segment focus
SWOT

16. Appendix

16.1 Scope of the report

Market definition
Objectives
Notes and caveats

16.2 Inclusions and exclusions checklist

Inclusions checklist
Exclusions checklist

16.3 Currency conversion rates for US$

16.4 Research methodology

16.5 Data procurement

Information sources

16.6 Data validation

16.7 Validation techniques employed for market sizing

16.8 Data synthesis

16.9 360 degree market analysis

16.10 List of abbreviations

Research Methodology

Technavio presents a detailed picture of the market by way of study, synthesis, and summation of data from multiple sources. The analysts have presented the various facets of the market with a particular focus on identifying the key industry influencers. The data thus presented is comprehensive, reliable, and the result of extensive research, both primary and secondary.

INFORMATION SOURCES

Primary sources

  • Manufacturers and suppliers
  • Channel partners
  • Industry experts
  • Strategic decision makers

Secondary sources

  • Industry journals and periodicals
  • Government data
  • Financial reports of key industry players
  • Historical data
  • Press releases

DATA ANALYSIS

Data Synthesis

  • Collation of data
  • Estimation of key figures
  • Analysis of derived insights

Data Validation

  • Triangulation with data models
  • Reference against proprietary databases
  • Corroboration with industry experts

REPORT WRITING

Qualitative

  • Market drivers
  • Market challenges
  • Market trends
  • Five forces analysis

Quantitative

  • Market size and forecast
  • Market segmentation
  • Geographical insights
  • Competitive landscape

Interested in this report?

Get your sample now to see our research methodology and insights!

Download Now

Frequently Asked Questions

Ready To Drink (RTD) Coffee market growth will increase by USD 16104.7 million during 2026-2030.

The Ready To Drink (RTD) Coffee market is expected to grow at a CAGR of 8.4% during 2026-2030.

Ready To Drink (RTD) Coffee market is segmented by Packaging (Glass bottled, Canned, Others) Distribution channel (Offline, Online) Product type (Cold brew, Iced coffee, Others)

Arla Foods Ingredients Group, Bolthouse Farms Inc., Bulletproof 360 Inc., Califia Farms LLC, Caribou Coffee Operating Co. Inc., Danone SA, Heartland Food Products Group, illycaffe SpA, Inspire Brands Inc., Keurig Dr Pepper Inc., Lotte Chilsung Beverage Co. Ltd., McDonald Corp., Nestle SA, PepsiCo Inc., Restaurant Brands Inc., Starbucks Corp., Suntory Beverage and Food Ltd., Tan Do Beverage, The Coca Cola Co., The J.M. Smucker Co. are a few of the key vendors in the Ready To Drink (RTD) Coffee market.

North America will register the highest growth rate of 56.8% among the other regions. Therefore, the Ready To Drink (RTD) Coffee market in North America is expected to garner significant business opportunities for the vendors during the forecast period.

US, Canada, Mexico, Germany, UK, France, Italy, Spain, The Netherlands, China, Japan, India, South Korea, Australia, Indonesia, Brazil, Argentina, Colombia, Saudi Arabia, UAE, South Africa, Egypt, Kenya

  • Rising demand for on-the-go refreshments is the driving factor this market.

The Ready To Drink (RTD) Coffee market vendors should focus on grabbing business opportunities from the Packaging segment as it accounted for the largest market share in the base year.