Reclaimed Rubber Market Size 2024-2028
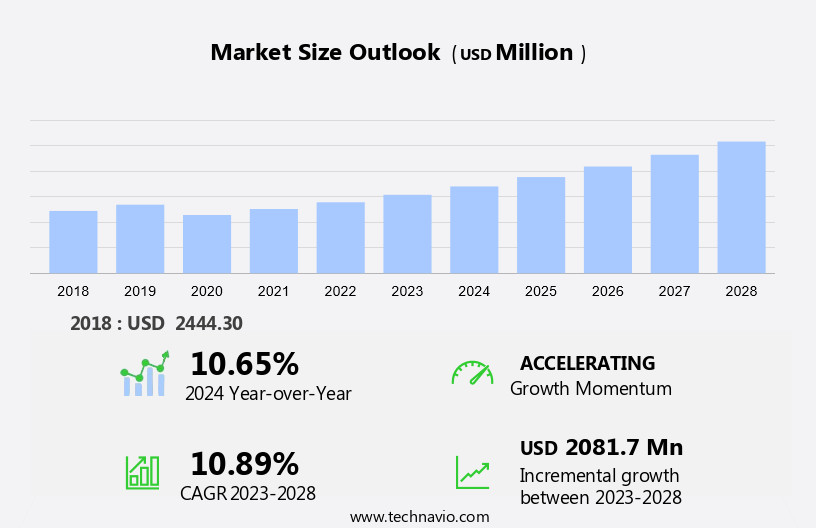
The reclaimed rubber market size is estimated to grow by USD 2.08 billion at a CAGR of 10.89% between 2023 and 2028. The market is experiencing significant growth, driven by the numerous benefits it offers over virgin rubber. Reclaimed rubber, also known as recycled rubber, is derived from the recycling of scrap rubber from various industries, including automotive and construction. One of the primary growth factors is the environmental sustainability of reclaimed rubber, as its production reduces the need for extracting new raw materials and lowers carbon emissions. Additionally, the increasing use of e-commerce sites to purchase reclaimed rubber has expanded its reach and accessibility to a broader consumer base. However, the market faces challenges from the availability of substitutes, such as synthetic rubber, which can offer similar performance at lower costs. To remain competitive, reclaimed rubber manufacturers must focus on improving product quality and offering competitive pricing to attract customers. In summary, the market is growing due to its environmental benefits and expanding accessibility, but faces challenges from substitutes and the need to maintain product quality and competitiveness.
What will be the Size of the Market During the Forecast Period?
For More Highlights About this Report, Request Free Sample
Market Dynamics and Customer Landscape
The market is witnessing significant growth due to the increasing focus on sustainability and the need to reduce waste in the rubber industry. Reclaimed rubber is derived from the process of tire retreading, where worn-out tires are recycled and their tread is removed to create new usable rubber. General Motors and Rubber-Cal are some of the major players in the market, utilizing reclaimed rubber in various applications such as bicycle tires, commercial vehicles, and pickup trucks. Reclaimed rubber comes in various forms including butyl reclaim rubber and EPDM rubber. It finds extensive use in industries like aircraft, footwear, building materials, pharmaceutical goods, safety gear, conveyor belts, aerospace, and consumer goods. Reclaimed rubber is often used as a substitute for virgin rubber and recycled materials like waste rubber in the production of new rubber products. The market is expected to continue its growth trajectory due to the increasing demand for sustainable and cost-effective solutions in various industries. Reclaimed rubber is available in different forms such as granules, crumb, and powder. These forms are widely used in the production of new rubber products, reducing the dependence on virgin rubber and promoting the circular economy. The market is expected to grow significantly in the coming years, driven by the increasing demand for sustainable and cost-effective solutions in various industries. Our researchers analyzed the data with 2023 as the base year, along with the key drivers, trends, and challenges. A holistic analysis of drivers will help companies refine their marketing strategies to gain a competitive advantage.
Key Market Driver
The benefits of reclaimed rubber is notably driving market growth. The market encompasses a wide range of applications, from automotive to aviation industries. General Motors and other commercial vehicle manufacturers utilize butyl reclaim rubber and EPDM rubber in tire retreading for pickup trucks and F-Series trucks. Reclaimed rubber derived from end-of-life tires is processed into various forms such as granules, crumb, and powder, which find applications in consumer goods like bicycle tires, footwear, building materials, and pharmaceutical goods. The aviation industry also benefits from recycled rubber in the form of conductive elastomer for aircraft tires. ReUz rubber tiles, made from tire scraps and tread peelings, are used in safety gear and conveyor belts. Technology transfer from virgin rubber to recycled materials has been a significant trend in the reclaimed rubber market. The aerospace and advertising industries are also potential markets for recycled rubber, offering opportunities for growth. Thus, such factors are driving the growth of the market during the forecast period.
Significant Market Trends
The growing use of e-commerce sites to purchase reclaimed rubber is the key trend in the market. The market encompasses a wide range of applications, from automotive to aviation industries. General Motors and other commercial vehicle manufacturers utilize reclaimed rubber, such as butyl reclaim rubber and EPDM rubber, in tire retreading for pickup trucks and F-Series trucks. In the aviation industry, recycled rubber forms, including tire scraps and tread peelings, are repurposed into components for aircraft tires and conductive elastomers. ReUz rubber tiles, derived from end-of-life tires, are used in footwear, building materials, pharmaceutical goods, safety gear, conveyor belts, and aerospace components. Recycled rubber comes in various forms, including granules, crumb, and powder, and is increasingly being adopted in consumer goods and advertising. Technology transfer from virgin rubber to recycled materials is a growing trend, as waste rubber is transformed into valuable resources for various industries. Thus, such trends will shape the growth of the market during the forecast period.
Major Market Challenge
The high availability of substitutes is the major challenge that affects the growth of the market. The market encompasses a diverse range of applications, from automotive to aviation industries. General Motors and other commercial vehicle manufacturers utilize reclaimed rubber in tire retreading, employing butyl reclaim rubber and EPDM rubber for enhancing tire durability in pickup trucks and F-Series trucks. Reclaimed rubber finds extensive use in bicycle tires as well. In the aerospace sector, conductive elastomer and recycled rubber forms, such as granules, crumb, and powder, are integral components in the production of aircraft tires. The aviation industry, alongside the middle-class population's growing demand for consumer goods, has fueled the technology transfer from virgin rubber to recycled materials. Waste rubber, including tire scraps and tread peelings, is transformed into end-of-life tires, which are then processed into synthetic rubber, copolymers, and diene components. These recycled rubber forms are employed in various industries, including footwear, building materials, pharmaceutical goods, safety gear, conveyor belts, and aerospace. The recycling of tires has gained significant traction, with TireRecycling being a key player in the market. The use of recycled rubber in advertising and marketing campaigns further highlights its versatility and importance in today's sustainable economy. Hence, the above factors will impede the growth of the market during the forecast period.
Exclusive Customer Landscape
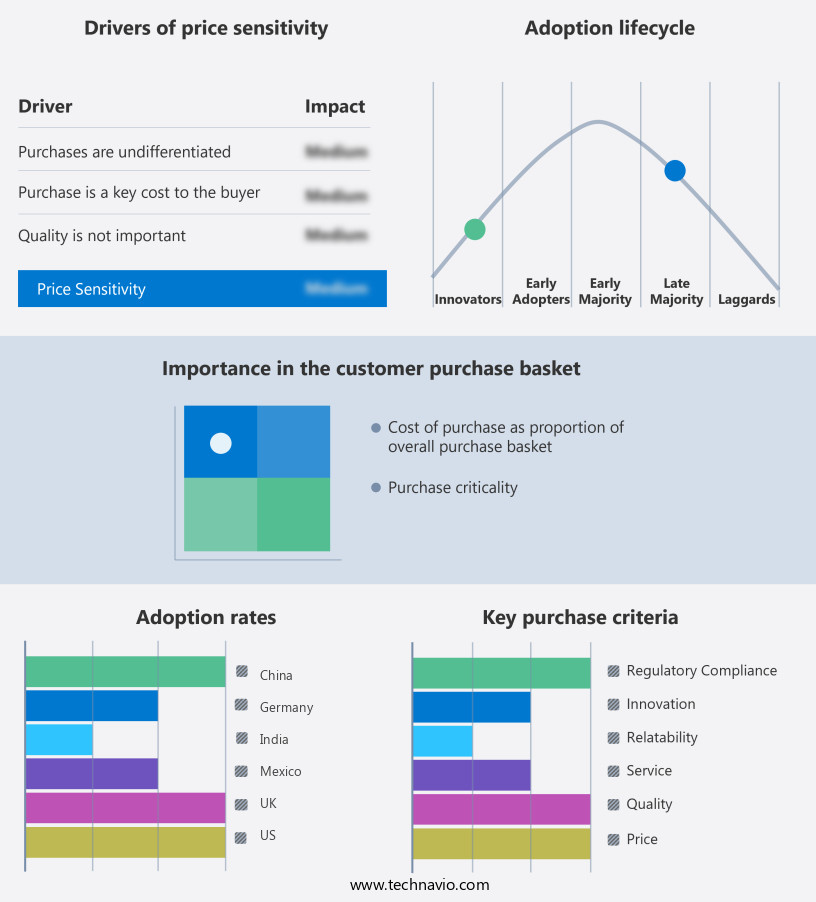
The market forecasting report includes the adoption lifecycle of the market, covering from the innovator’s stage to the laggard’s stage. It focuses on adoption rates in different regions based on penetration. Furthermore, the report also includes key purchase criteria and drivers of price sensitivity to help companies evaluate and develop their market growth analysis strategies.
Customer Landscape
Key Companies & Market Insights
Companies are implementing various strategies, such as strategic alliances, partnerships, mergers and acquisitions, geographical expansion, and product/service launches, to enhance their presence in the market.
Balaji Rubber Industries Pvt. Ltd. - The company offers reclaimed rubber such as Rolex whole tyre reclaim rubber and natural reclaim rubber.
The market research and growth report also includes detailed analyses of the competitive landscape of the market and information about key companies, including:
- Balaji Rubber Industries Pvt. Ltd.
- ELGI Rubber Co. Ltd.
- Fishfa Rubbers
- Gomo International
- GRP Ltd.
- High Tech Reclaim Pvt. Ltd.
- HUXAR
- J. Allcock and Sons Ltd.
- Lead Reclaim and Rubber Products Ltd.
- Minar Reclaimation Pvt. Ltd.
- Rolex Reclaim Pvt. Ltd.
- Samsara Rubber Reclaimers LLP
- Sapphire Reclaim Rubber Pvt. Ltd.
- Sarvoday Rubber Corp.
- Shanghai Fuyou International Trade Co. Ltd.
- SINO RUBBER
- Star Polymers Inc.
- Swani Rubber Industry
- VASUDEV RUBBER INDUSTRIES
- Zenish Reclamation
Qualitative and quantitative analysis of companies has been conducted to help clients understand the wider business environment as well as the strengths and weaknesses of key market players. Data is qualitatively analyzed to categorize companies as pure play, category-focused, industry-focused, and diversified; it is quantitatively analyzed to categorize companies as dominant, leading, strong, tentative, and weak.
Market Segmentation
By Type
The whole tire reclaim rubber segment is estimated to witness significant growth during the forecast period. Reclaimed rubber is a sustainable and cost-effective solution derived from the end-of-life tires, specifically the tread peelings. This recycled material is produced in various grades to cater to diverse applications, including automotive tires, conveyor belts, rubber sheets, rubber molded goods, and transmission belts. The use of reclaimed rubber in manufacturing contributes to environmental sustainability by promoting waste reduction and eco-conscious practices. Its superior elasticity and resilience make it an excellent choice for tire manufacturing and other applications requiring high durability and performance. Additionally, reclaimed rubber is sourced from recycled tire rubber, offering significant cost savings without compromising on quality.
Get a glance at the market share of various regions Download the PDF Sample
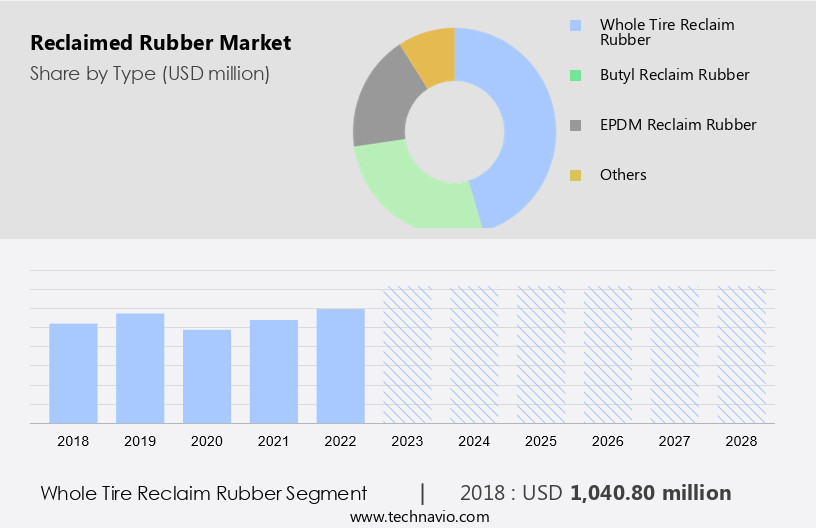
The whole tire reclaim rubber segment accounted for USD 1.04 billion in 2018. General Motors and Rubber-Cal are among the notable companies utilizing reclaimed rubber in their commercial vehicles and pickup trucks, such as the F-Series truck. In the aviation industry, reclaimed rubber, including butyl reclaim rubber and EPDM rubber, is used in aircraft tires and conductive elastomer. Furthermore, reclaimed rubber forms, such as granules, crumb, and powder, are employed in footwear, building materials, pharmaceutical goods, safety gear, and consumer goods. Technology transfer from tire retreading to recycling has led to the expansion of reclaimed rubber's applications in the aerospace and advertising industries. Overall, the versatility and benefits of reclaimed rubber make it an attractive option for sustainable manufacturing in various sectors.
Regional Analysis
For more insights on the market share of various regions Download PDF Sample now!
APAC is estimated to contribute 46% to the growth of the global market during the market forecast period. Technavio’s analysts have elaborately explained the regional trends and drivers that shape the market during the forecast period.
The market encompasses various types of reclaimed rubber products derived from the processing of OEM tires, including Butyl Reclaim and Whole Tire Reclaim. Butyl Reclaim is produced from the recovery of butyl rubber from inner liners and inner tubes, while Whole Tire Reclaim is derived from the pyrolysis of tire sidewalls, tire plies, and other non-tire components. These reclaimed rubber products find extensive applications in diverse industries. Molded goods, such as traffic cones, speed bumps, and protective padding, are significant consumers of reclaimed rubber. Additionally, reclaimed rubber is utilized in the production of adhesives, matting, profiles, and roofing materials. In the automotive sector, OEM tires are a primary source of reclaimed rubber, ensuring a consistent supply for various industries. Overall, the Reclaimed Rubber Market is a vital sector, providing sustainable solutions while reducing waste and promoting circular economy principles.
Segment Overview
The market report provides comprehensive data (region-wise segment analysis), with forecasts and estimates in "USD billion" for the period 2024-2028, as well as historical data from 2018-2022 for the following segments.
- Type Outlook
- Whole tire reclaim rubber
- Butyl reclaim rubber
- EPDM reclaim rubber
- Others
- Application Outlook
- Tire
- Non-tire
- Region Outlook
- North America
- The U.S.
- Canada
- Europe
- U.K.
- Germany
- France
- Rest of Europe
- APAC
- China
- India
- Middle East & Africa
- Saudi Arabia
- South Africa
- Rest of the Middle East & Africa
- South America
- Argentina
- Brazil
- Chile
- North America
You may also be interested in:
- Coal Tar Market Analysis APAC, Europe, North America, South America, Middle East and Africa - US, China, India, Japan, Germany - Size and Forecast
- Roofing Tiles Market Analysis APAC, North America, Europe, South America, Middle East and Africa - US, China, India, Germany, UK - Size and Forecast
- Reclaimed Lumber Market by End-user and Geography - Forecast and Analysis
Market Analyst Overview
Reclaimed rubber, derived from End-of-life tires, is gaining significant attention in various industries due to its sustainability and cost-effectiveness. Companies like General Motors and Rubber-Cal are increasingly incorporating reclaimed rubber in their manufacturing processes. Bicycle tires, commercial vehicles, and pickup trucks are some of the major consumers of reclaimed rubber. The F-Series truck, for instance, uses reclaimed rubber in its tire retreading process, reducing the need for virgin rubber. Reclaimed rubber comes in various forms such as butyl reclaim rubber, EPDM rubber, and conductive elastomer. It is also used in aircraft tires, ReUz rubber tiles, and safety gear. The aviation industry, in particular, is a significant consumer of reclaimed rubber due to its lightweight and high durability. The market is driven by the Middle-class population's increasing demand for consumer goods and the technology transfer from the aerospace industry. The market also includes recycled materials like tire scraps, tread peelings, and waste rubber. Synthetic rubber, copolymer, and diene component are some of the key raw materials used in the production of reclaimed rubber. Natural rubber is also used in some applications. Recycled rubber forms like granules, crumb, and powder are used in various industries such as footwear, building materials, pharmaceutical goods, conveyor belts, and aerospace. In conclusion, the reclaimed rubber market is a growing and dynamic industry that offers sustainable solutions for various industries while reducing waste and promoting circular economy. TireRecycling and Advertising are also potential areas for growth in the reclaimed rubber market.
|
Market Scope |
|
|
Report Coverage |
Details |
|
Page number |
191 |
|
Base year |
2023 |
|
Historic period |
2018-2022 |
|
Forecast period |
2024-2028 |
|
Growth momentum & CAGR |
Accelerate at a CAGR of 10.89% |
|
Market growth 2024-2028 |
USD 2.08 billion |
|
Market structure |
Fragmented |
|
YoY growth 2023-2024(%) |
10.65 |
|
Regional analysis |
APAC, North America, Europe, South America, and Middle East and Africa |
|
Performing market contribution |
APAC at 46% |
|
Key countries |
China, US, India, Mexico, UK, and Germany |
|
Competitive landscape |
Leading Companies, Market Positioning of Companies, Competitive Strategies, and Industry Risks |
|
Key companies profiled |
Balaji Rubber Industries Pvt. Ltd., ELGI Rubber Co. Ltd., Fishfa Rubbers, Gomo International, GRP Ltd., High Tech Reclaim Pvt. Ltd., HUXAR, J. Allcock and Sons Ltd., Lead Reclaim and Rubber Products Ltd., Minar Reclaimation Pvt. Ltd., Rolex Reclaim Pvt. Ltd., Samsara Rubber Reclaimers LLP, Sapphire Reclaim Rubber Pvt. Ltd., Sarvoday Rubber Corp., Shanghai Fuyou International Trade Co. Ltd., SINO RUBBER, Star Polymers Inc., Swani Rubber Industry, VASUDEV RUBBER INDUSTRIES, and Zenish Reclamation |
|
Market dynamics |
Parent market analysis, Market growth inducers and obstacles, Fast-growing and slow-growing segment analysis, COVID-19 impact and recovery analysis and future consumer dynamics, Market condition analysis for forecast period |
|
Customization purview |
If our report has not included the data that you are looking for, you can reach out to our analysts and get segments customized. |
What are the Key Data Covered in this Market Research Report?
- CAGR of the market during the forecast period
- Detailed information on factors that will drive the market growth and forecasting between 2024 and 2028
- Precise estimation of the size of the market and its contribution of the market in focus to the parent market
- Accurate predictions about upcoming market growth and trends and changes in consumer behaviour
- Growth of the market across APAC, North America, Europe, South America, and Middle East and Africa
- Thorough analysis of the market’s competitive landscape and detailed information about companies
- Comprehensive analysis of factors that will challenge the growth of market companies


