
Recombinant Proteins Market Size 2025-2029
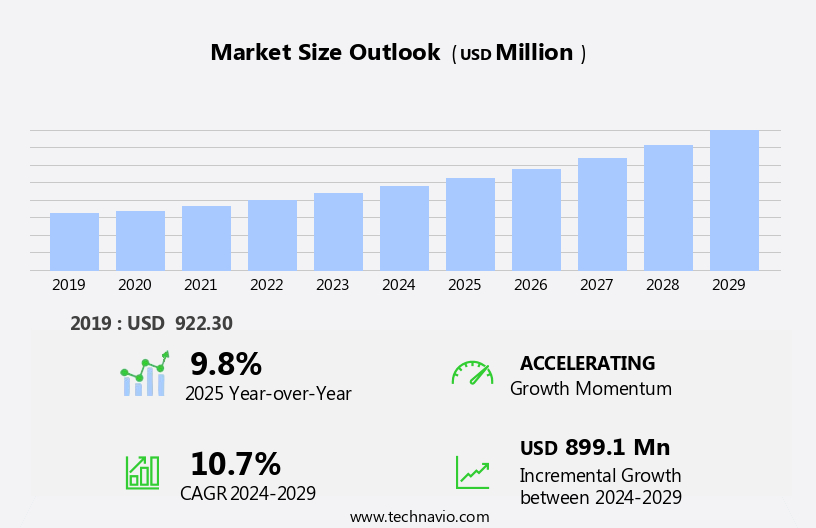
The recombinant proteins market size is forecast to increase by USD 899.1 million, at a CAGR of 10.7% between 2024 and 2029.
- The market is experiencing significant growth, driven primarily by the rising prevalence of chronic diseases worldwide. The increasing incidence of conditions such as cancer, diabetes, and neurological disorders necessitates the development and production of an extensive range of recombinant proteins for therapeutic applications. Furthermore, the market is witnessing an uptick in collaborations and strategic alliances among key players, aiming to expand their product portfolios and enhance their market presence. However, the market landscape is not without challenges. Complexities in manufacturing, storage conditions, and high costs pose significant obstacles for market participants. Ensuring the stability and consistency of recombinant proteins during production and storage is crucial to maintaining their therapeutic efficacy.
- Additionally, the high costs associated with research, development, and production limit the market's accessibility to some extent. Companies seeking to capitalize on market opportunities must focus on addressing these challenges through technological advancements, strategic partnerships, and cost optimization strategies.
What will be the Size of the Recombinant Proteins Market during the forecast period?
Explore in-depth regional segment analysis with market size data - historical 2019-2023 and forecasts 2025-2029 - in the full report.
Request Free Sample
The market continues to evolve, driven by advancements in protein expression systems, bioreactor design, and downstream processing techniques. Protein characterization through methods such as size exclusion chromatography, protein purification via affinity chromatography, and mass spectrometry play crucial roles in understanding protein structure-function relationships. Directed evolution and gene editing technologies enable the optimization of protein stability, folding, and post-translational modifications, expanding the applications of recombinant proteins in various sectors. Mammalian, yeast, and insect cell expression systems are employed for producing recombinant proteins, each offering unique advantages. Upstream processing involves the production of recombinant proteins within host cells, while downstream processing focuses on the purification and formulation development of these proteins for therapeutic applications.
Clinical trials are a significant aspect of the market, with recombinant proteins being utilized in targeted therapy, drug delivery, and gene therapy. Regulatory affairs and GMP compliance are essential considerations in the development and commercialization of these biologics. Protein interactions, stability, and folding are critical factors influencing the efficacy and safety of recombinant proteins. Protein engineering and protein design enable the modification of these properties to optimize therapeutic potential. The ongoing unfolding of market activities reveals an increasingly complex and dynamic landscape, with continuous innovation and collaboration shaping the future of recombinant protein production and application.
How is this Recombinant Proteins Industry segmented?
The recombinant proteins industry research report provides comprehensive data (region-wise segment analysis), with forecasts and estimates in "USD million" for the period 2025-2029, as well as historical data from 2019-2023 for the following segments.
- Application
- Biotechnology research
- Drug discovery and development
- Biopharmaceutical production
- Others
- End-user
- Pharma and biotechnology companies
- Academic and research institutes
- Others
- Geography
- North America
- US
- Canada
- Europe
- France
- Germany
- Italy
- UK
- APAC
- China
- India
- Japan
- South Korea
- Rest of World (ROW)
- North America
By Application Insights
The biotechnology research segment is estimated to witness significant growth during the forecast period.
The biotechnology industry's expansive realm encompasses the utilization of biological processes, animals, cells, or cellular components to generate innovative technologies. Recombinant proteins play a pivotal role in advancing biomedical biotechnology, with a growing number finding application in research laboratories. These proteins are produced for project-specific research and commercially, such as the enzymes commonly used in molecular biology labs. Recombinant lysosomal proteins, for instance, are often manufactured by mammalian cells, with FDA-approved glycosylated lysosomal protein drugs and additional candidates derived from plant cell culture. Microorganisms like Saccharomyces cerevisiae and Escherichia coli are also employed for their production.
Protein degradation, ion exchange chromatography, protein expression systems, bioreactor design, protein delivery, downstream processing, bacterial expression, and drug development are essential aspects of recombinant protein production. Protein interactions, protein design, size exclusion chromatography, protein characterization, directed evolution, affinity chromatography, clinical trials, mammalian cell expression, yeast expression, insect cell expression, formulation development, structure-function relationships, upstream processing, mass spectrometry, GMP compliance, drug delivery, research reagents, targeted therapy, Western blotting, protein stability, quality control, protein purification, protein folding, gene therapy, protein engineering, post-translational modifications, protein-protein interactions, therapeutic antibodies, contract manufacturing, and regulatory affairs are all integral components of this intricate process.
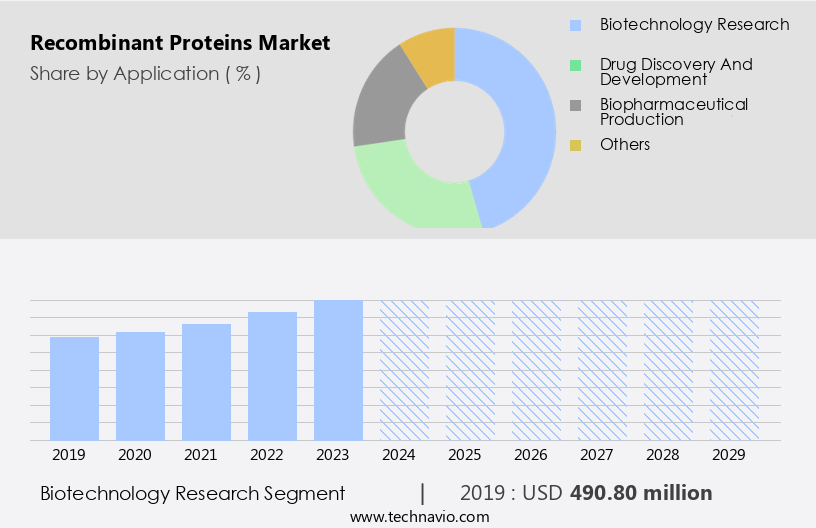
The Biotechnology research segment was valued at USD 490.80 million in 2019 and showed a gradual increase during the forecast period.
Regional Analysis
North America is estimated to contribute 36% to the growth of the global market during the forecast period. Technavio's analysts have elaborately explained the regional trends and drivers that shape the market during the forecast period.
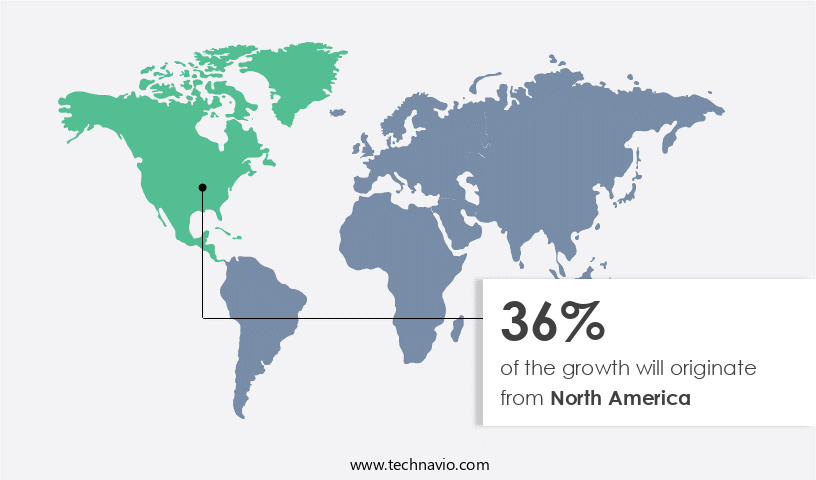
The market in North America is experiencing significant growth due to the increasing prevalence of various diseases, including cancer, autoimmune diseases, metabolic disorders, musculoskeletal disorders, central nervous system disorders, and blood disorders. The rising prevalence of cardiovascular and cancer disorders globally is further driving market growth. In the US, healthcare reforms are leading to increased medical care for both insured and uninsured populations, providing additional impetus to the market. Ion exchange chromatography and size exclusion chromatography are commonly used protein purification techniques in the production process. Upstream processing involves protein expression systems, such as bacterial, mammalian cell, yeast, and insect cell expression.
Downstream processing includes protein characterization using techniques like mass spectrometry and Western blotting, protein folding, quality control, and regulatory affairs. Recombinant proteins are used in various applications, including drug development, therapeutic antibodies, gene therapy, and targeted therapy. Contract manufacturing organizations offer contract services for recombinant protein production and formulation development. Protein interactions, post-translational modifications, and protein-protein interactions are crucial aspects of protein engineering and design. GMP compliance is essential for ensuring the safety and efficacy of recombinant proteins in clinical trials. Protein stability and protein delivery are also critical factors in the market. Overall, the growing demographics and economies in North America are expected to offer excellent opportunities for the market.
Market Dynamics
Our researchers analyzed the data with 2024 as the base year, along with the key drivers, trends, and challenges. A holistic analysis of drivers will help companies refine their marketing strategies to gain a competitive advantage.
The market is a dynamic and innovative sector, driven by advancements in biotechnology and molecular biology. This market encompasses the production, purification, and application of recombinant proteins derived from various sources, including bacteria, yeast, and mammalian cells. Recombinant proteins find extensive use in diverse industries, such as pharmaceuticals, agriculture, food and beverage, and diagnostics. Key players in this market include enzymes, antibodies, hormones, and therapeutic proteins. Recombinant protein technologies offer numerous advantages, including improved specificity, consistency, and yield, making them a preferred choice for various applications. Additionally, the market benefits from ongoing research and development efforts, aimed at expanding the applications and enhancing the efficiency of recombinant protein production processes. The market's growth is further fueled by increasing demand for biopharmaceuticals and the rising adoption of genetically modified organisms in agriculture. Overall, the market represents a significant and evolving sector, with immense potential for growth and innovation.
What are the key market drivers leading to the rise in the adoption of Recombinant Proteins Industry?
- Chronic diseases are the primary cause for the market's growth due to their increasing prevalence.
- Recombinant proteins play a crucial role in addressing major chronic diseases, such as cancer, cardiovascular diseases, endocrine disorders, and viral infections. According to the World Health Organization, cancer is the second-leading cause of global deaths, accounting for approximately one in six deaths. Cardiovascular diseases, caused by factors like high blood pressure, high cholesterol, obesity, unhealthy diets, physical inactivity, and tobacco use, also contribute significantly to morbidity and mortality. The prevalence of these diseases is on the rise, leading to an increased demand for recombinant proteins in drug development. Protein degradation is a significant challenge in the production of recombinant proteins.
- To mitigate this, advanced techniques like ion exchange chromatography and protein design are employed during downstream processing. Protein expression systems, such as bacterial expression, are utilized for the production of recombinant proteins in bioreactors designed for optimal protein yield. Protein interactions are also crucial in the development of effective therapeutics, necessitating a deep understanding of these complex molecular interactions. In conclusion, the increasing prevalence of chronic diseases, such as cancer and cardiovascular disorders, is driving the demand for recombinant proteins in drug development. Advanced techniques, including protein design, ion exchange chromatography, and protein expression systems, are employed to address challenges in the production and purification of recombinant proteins.
- Understanding these complex protein interactions is essential for the development of effective therapeutics.
What are the market trends shaping the Recombinant Proteins Industry?
- The trend in the business world is marked by an upward trajectory in collaborations and strategic alliances among companies. This growth is driven by the recognition of mutual benefits and the need for competitive advantage in the market.
- The market is witnessing significant growth due to the increasing demand for these proteins in various industries, including pharmaceuticals and biotechnology. Companies are investing heavily in research and development to produce these proteins using techniques such as size exclusion chromatography, protein characterization, and directed evolution. Mammalian cell expression, yeast expression, and insect cell expression are popular methods for producing recombinant proteins. These methods enable the production of high-purity proteins with specific functions. Affinity chromatography and formulation development are essential steps in the production process to ensure the proteins maintain their structure-function relationships. Clinical trials are a critical phase in the development of recombinant proteins for therapeutic applications.
- Successful completion of clinical trials can lead to regulatory approval and commercialization of these proteins. Strategic alliances and collaborations between companies are becoming increasingly common to enhance their operations and remain competitive in the market. For instance, in recent news, Core Biogenesis and Nucleus Biologics announced a strategic collaboration for the manufacturing and distribution of cost-effective and sustainable recombinant proteins. Such collaborations and strategic alliances would lead to more investments in the market, which would subsequently lead to the introduction of advanced products. In summary, the market is experiencing growth due to the increasing demand for these proteins and the advancements in production techniques.
- Companies are collaborating to remain competitive and introduce innovative products, leading to further investments in the market.
What challenges does the Recombinant Proteins Industry face during its growth?
- The intricacies of manufacturing processes, stringent storage conditions, and elevated costs pose a significant challenge to the industry's growth trajectory.
- Recombinant proteins are essential biopharmaceuticals produced from living organisms, necessitating a complex and intricate production process. Techniques such as fermentation, clarification, separation, and purification are employed to manufacture these proteins. The purification process is particularly challenging due to the minute variations between protein molecules and the potential for contamination in a biological medium. Analytical methods, including high-performance liquid chromatography (HPLC) and mass spectrometry, are utilized to separate, identify, and quantify each component in the mixture. Maintaining the correct temperature, pressure, and pH levels throughout the process is crucial to ensure product consistency. The variability in products produced by different companies underscores the difficulties in generating biopharmaceutical proteins to uniform standards.
- GMP compliance, protein stability, and quality control are critical aspects of the production process. Mass spectrometry and Western blotting are essential techniques for protein characterization and ensuring drug delivery systems function effectively. Targeted therapy, a significant application of recombinant proteins, relies on their precise identification and purification. Protein purification and quality control are essential for the success of research reagents and therapeutic applications.
Exclusive Customer Landscape
The recombinant proteins market forecasting report includes the adoption lifecycle of the market, covering from the innovator's stage to the laggard's stage. It focuses on adoption rates in different regions based on penetration. Furthermore, the recombinant proteins market report also includes key purchase criteria and drivers of price sensitivity to help companies evaluate and develop their market growth analysis strategies.

Customer Landscape
Key Companies & Market Insights
Companies are implementing various strategies, such as strategic alliances, recombinant proteins market forecast, partnerships, mergers and acquisitions, geographical expansion, and product/service launches, to enhance their presence in the industry.
Abcam plc - The company specializes in producing high-quality recombinant proteins, including bioactive grade and premium grade options.
The industry research and growth report includes detailed analyses of the competitive landscape of the market and information about key companies, including:
- Abcam plc
- Airway Therapeutics Inc.
- Amgen Inc.
- Aviva Systems Biology Corp.
- Bio Rad Laboratories Inc.
- Bio Techne Corp.
- BPS Bioscience Inc.
- Elabscience Biotechnology Inc.
- Enzo Biochem Inc.
- GenScript Biotech Corp.
- Grifols SA
- Merck KGaA
- Novartis AG
- Novo Nordisk AS
- OriGene Technologies Inc.
- Prospec Tany Technogene Ltd.
- Proteintech Group Inc.
- Sanofi SA
- Sino Biological Inc.
- Thermo Fisher Scientific Inc.
Qualitative and quantitative analysis of companies has been conducted to help clients understand the wider business environment as well as the strengths and weaknesses of key industry players. Data is qualitatively analyzed to categorize companies as pure play, category-focused, industry-focused, and diversified; it is quantitatively analyzed to categorize companies as dominant, leading, strong, tentative, and weak.
Recent Development and News in Recombinant Proteins Market
- In January 2024, Abcam, a leading global supplier of proteins for research, announced the launch of its new recombinant protein line, AbPep, which includes over 1,500 proteins. This expansion aimed to cater to the growing demand for high-quality research tools in the biotechnology sector (Abcam Press Release).
- In March 2024, Merck KGaA, a leading science and technology company, entered into a strategic collaboration with Insilico Biotechnology, a pioneer in the field of artificial intelligence for drug discovery. The partnership aimed to develop novel recombinant proteins using Insilico's AI-driven platform (Merck KGaA Press Release).
- In May 2024, Cytiva, a global life sciences leader, completed the acquisition of Repligen Corporation's Protein Production Platform business. This acquisition significantly expanded Cytiva's capabilities in large-scale recombinant protein production and enabled the company to offer end-to-end solutions for biopharmaceutical manufacturing (Cytiva Press Release).
- In April 2025, the European Medicines Agency (EMA) granted marketing authorization for Adalimumab biosimilar, IDP-1183, developed by Intas Pharmaceuticals. This approval marked the first regulatory approval for a recombinant protein biosimilar in Europe, paving the way for increased competition and affordability in the market (EMA Press Release).
Research Analyst Overview
- The market is witnessing significant activity and trends, driven by advancements in drug discovery and technology transfer. Intellectual property and patent litigation play a crucial role in shaping market dynamics, with pricing strategies and process optimization also influencing market access. Protein microarrays and high-throughput screening enable the analysis of protein-ligand interactions and enzymatic activity, while in vivo assays and animal models provide valuable insights into therapeutic index and clinical pharmacology. Peptide synthesis and process analytical technology contribute to process intensification and quality assurance, ensuring the production of safe and effective recombinant proteins. Product lifecycle management and supply chain management are essential for ensuring efficient market access and minimizing adverse events.
- Antibody engineering, including the development of single-domain antibodies and fusion proteins, expands the application scope of recombinant proteins. The circular economy and protein conjugation offer opportunities for sustainable production and enhanced therapeutic efficacy. In vitro assays and diagnostic imaging further expand the utility of recombinant proteins in various industries.
Dive into Technavio's robust research methodology, blending expert interviews, extensive data synthesis, and validated models for unparalleled Recombinant Proteins Market insights. See full methodology.
|
Market Scope |
|
|
Report Coverage |
Details |
|
Page number |
203 |
|
Base year |
2024 |
|
Historic period |
2019-2023 |
|
Forecast period |
2025-2029 |
|
Growth momentum & CAGR |
Accelerate at a CAGR of 10.7% |
|
Market growth 2025-2029 |
USD 899.1 million |
|
Market structure |
Fragmented |
|
YoY growth 2024-2025(%) |
9.8 |
|
Key countries |
US, Canada, Japan, Italy, Germany, France, India, China, South Korea, and UK |
|
Competitive landscape |
Leading Companies, Market Positioning of Companies, Competitive Strategies, and Industry Risks |
What are the Key Data Covered in this Recombinant Proteins Market Research and Growth Report?
- CAGR of the Recombinant Proteins industry during the forecast period
- Detailed information on factors that will drive the growth and forecasting between 2025 and 2029
- Precise estimation of the size of the market and its contribution of the industry in focus to the parent market
- Accurate predictions about upcoming growth and trends and changes in consumer behaviour
- Growth of the market across North America, Europe, Asia, and Rest of World (ROW)
- Thorough analysis of the market's competitive landscape and detailed information about companies
- Comprehensive analysis of factors that will challenge the recombinant proteins market growth of industry companies
We can help! Our analysts can customize this recombinant proteins market research report to meet your requirements.
 RIA -
RIA - 
