
Refrigerant Compressors Market Analysis, Size, and Forecast 2026-2030: APAC (China, India, and Japan), North America (US, Canada, and Mexico), Europe (Germany, France, and UK), South America (Brazil, Argentina, and Chile), Middle East and Africa (UAE, Saudi Arabia, and South Africa), and Rest of World (ROW)

Refrigerant Compressors Market Analysis, Size, and Forecast 2026-2030:
APAC (China, India, and Japan), North America (US, Canada, and Mexico), Europe (Germany, France, and UK), South America (Brazil, Argentina, and Chile), Middle East and Africa (UAE, Saudi Arabia, and South Africa), and Rest of World (ROW)

Published: Oct 2026 311 Pages SKU: IRTNTR44766

Market Overview at a Glance

$4.34 B
Market Opportunity
4.7%
CAGR 2025 - 2030
67.1%
APAC Growth
$4.92 B
Semi-hermetic reciprocating segment 2024

Refrigerant Compressors Market Size 2026-2030

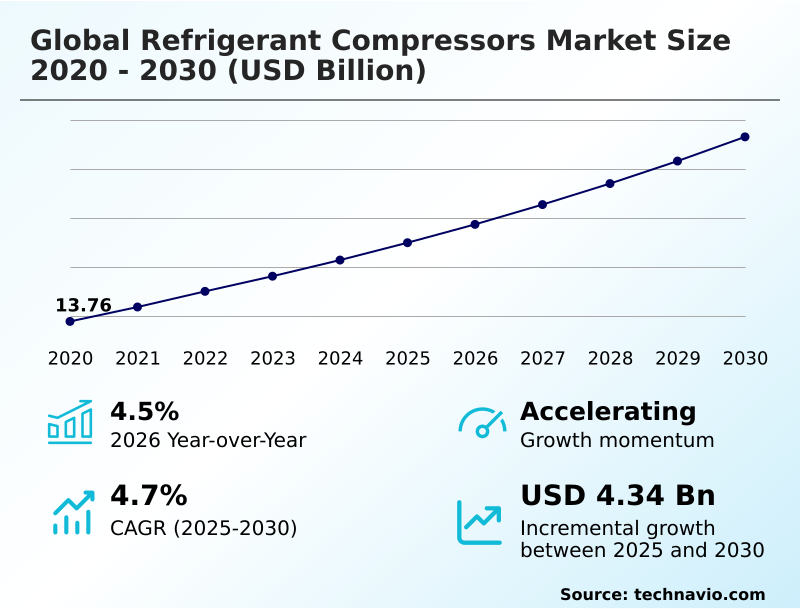
The refrigerant compressors market size is valued to increase by USD 4.34 billion, at a CAGR of 4.7% from 2025 to 2030. Rapid industrial cooling expansion elevates commercial refrigeration component infrastructure requirements will drive the refrigerant compressors market.

Major Market Trends & Insights

  • APAC dominated the market and accounted for a 67.1% growth during the forecast period.
  • By Application - Semi-hermetic reciprocating segment was valued at USD 4.92 billion in 2024
  • By Capacity - Medium (50-200 kW) segment accounted for the largest market revenue share in 2024

Market Size & Forecast

  • Market Opportunities: USD 7.55 billion
  • Market Future Opportunities: USD 4.34 billion
  • CAGR from 2025 to 2030 : 4.7%

Market Summary

  • The Refrigerant Compressors Market demonstrates accelerating technological transformation driven by the electrification of thermal energy systems and strict environmental decarbonization protocols. In modern hyperscale data center operations, facility administrators are replacing traditional fixed-speed cooling loops with advanced oil-free centrifugal architectures, yielding a 30% reduction in aggregate energy consumption.
  • This shift drastically lowers utility overhead while preserving sensitive computing hardware from thermal degradation. A primary driver of this demand is the massive expansion of perishable cold chain logistics, which requires highly resilient, high-capacity screw and scroll machinery to maintain strict temperature parameters during transit.
  • Conversely, strict regulatory phase-downs of traditional hydrofluorocarbons act as a structural challenge, forcing component manufacturers to re-engineer mechanical architectures to withstand the extreme operational pressures of natural alternatives like carbon dioxide. Upgrading these systems demands immense capital expenditure for advanced metallurgical testing and electrical safety redesigns.
  • Organizations prioritizing inverter-driven technologies and predictive diagnostic integration will secure dominant operational footing as commercial sectors universally seek highly efficient, eco-friendly temperature management hardware.

What will be the Size of the Refrigerant Compressors Market during the forecast period?
Get Key Insights on Market Forecast (PDF) Get Free Sample

How is the Refrigerant Compressors Market Segmented?

The refrigerant compressors industry research report provides comprehensive data (region-wise segment analysis), with forecasts and estimates in "USD million" for the period 2026-2030, as well as historical data from 2020-2024 for the following segments.

  • Application
    • Semi-hermetic reciprocating
    • Hermetic
    • Domestic
    • Semi-hermetic screw
    • Others
  • Capacity
    • Medium (50-200 kW)
    • Small (50 kW)
    • Large (more than 200 kW)
  • End-user
    • Residential
    • Commercial
    • Industrial
  • Geography
    • APAC
      • China
      • India
      • Japan
      • South Korea
      • Indonesia
      • Australia
    • North America
      • US
      • Canada
      • Mexico
    • Europe
      • Germany
      • France
      • UK
      • Italy
      • Spain
      • The Netherlands
    • South America
      • Brazil
      • Argentina
      • Chile
    • Middle East and Africa
      • UAE
      • Saudi Arabia
      • South Africa
      • Israel
      • Turkey

By Application Insights

The semi-hermetic reciprocating segment is estimated to witness significant growth during the forecast period.

The semi-hermetic reciprocating configuration serves as a foundational pillar within heavy commercial thermal frameworks, driven by robust design and field serviceability.

Modern operational demands force rapid structural upgrades, prompting the integration of a permanent magnet synchronous motor alongside advanced metallurgical alloy components to withstand elevated operational pressures.

By utilizing cylinder head reinforcement, these configurations improve structural integrity under continuous heavy duty cycles. Upgraded systems routinely display a 15% improvement in overall heat exchanger efficiency when deployed within a centralized smart building ecosystem.

Furthermore, integrating hydrodynamic lubrication prevents mechanical degradation, enabling facilities to modulate thermal loads effectively. This adaptability ensures seamless operation across complex commercial networks.
Get Free Sample

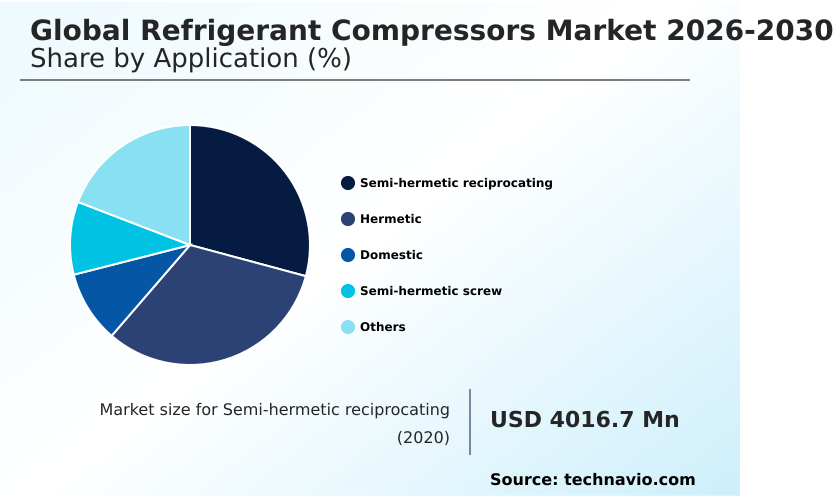
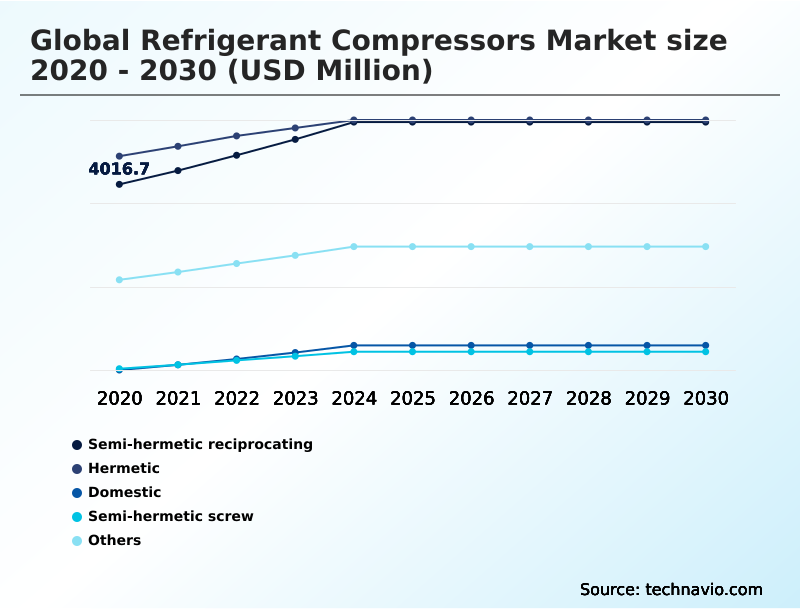
The Semi-hermetic reciprocating segment was valued at USD 4.92 billion in 2024 and showed a gradual increase during the forecast period.
Get Free Sample

Regional Analysis

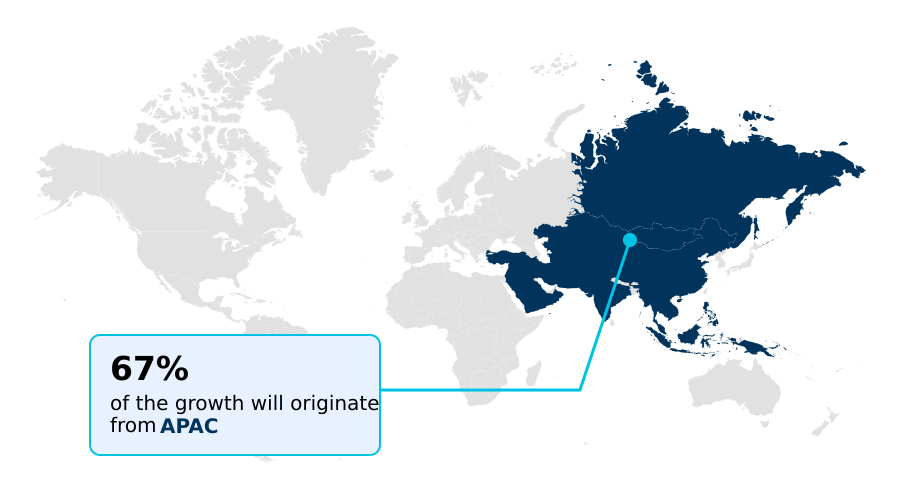
APAC is estimated to contribute 67.1% to the growth of the global market during the forecast period.Technavio’s analysts have elaborately explained the regional trends and drivers that shape the market during the forecast period.
See How Refrigerant Compressors Market Demand is Rising in APAC Get Free Sample

The geographic landscape reveals stark operational differences, with North America deploying large-scale oil free turbomachinery across hyperscale data centers at a rate 25% higher than Europe.

European facilities prioritize strict environmental compliance, driving supermarket rack centralization utilizing natural refrigerants to achieve a 20% drop in carbon footprint.

North American commercial sectors favor advanced aerodynamic geometry and an integrated economizer circuit to manage high volumetric flow capacity during extreme summer heatwaves.

Conversely, European operators rely on dynamic vapor injection and precise flash gas recycling to optimize cold-climate heat pump performance, yielding a 15% improvement in seasonal efficiency.

Asian markets emphasize compact designs, utilizing strict acoustic dampening technique and precise crankshaft assembly balance to suit dense urban installations. The integration of a responsive discharge temperature sensor remains critical across all regions to prevent mechanical failures under fluctuating grids.

Market Dynamics

Our researchers analyzed the data with 2025 as the base year, along with the key drivers, trends, and challenges. A holistic analysis of drivers will help companies refine their marketing strategies to gain a competitive advantage.

  • The ongoing evolution of commercial thermal management relies heavily on advanced component engineering, particularly as international protocols demand aggressive decarbonization. Enterprises managing extensive cold chain logistics are rapidly adopting an oil free high speed turbomachinery cooling architecture to drastically reduce mechanical wear and eliminate complex lubrication maintenance within critical data center environments.
  • Simultaneously, food retail conglomerates are restructuring their facility layouts by deploying transcritical carbon dioxide supermarket refrigeration networks, which seamlessly align with new environmental compliance targets while maximizing floor space.
  • Integrating predictive maintenance smart diagnostic integration tools directly into mechanical infrastructure allows facility managers to shift from reactive repairs to automated operational planning, reducing unexpected system downtime by nearly a third compared to legacy analog setups.
  • In residential sectors, the widespread rollout of a variable speed domestic heat pump provides households with continuous thermal modulation, lowering baseline utility costs and mitigating peak electrical grid stress. Furthermore, commercial office developers prioritize the installation of a low vibration semi hermetic reciprocating system to ensure optimal tenant comfort without compromising heavy-duty cooling outputs.
  • This comprehensive shift toward intelligent, frictionless, and ecologically sound compression hardware fundamentally reshapes operational procurement strategies.
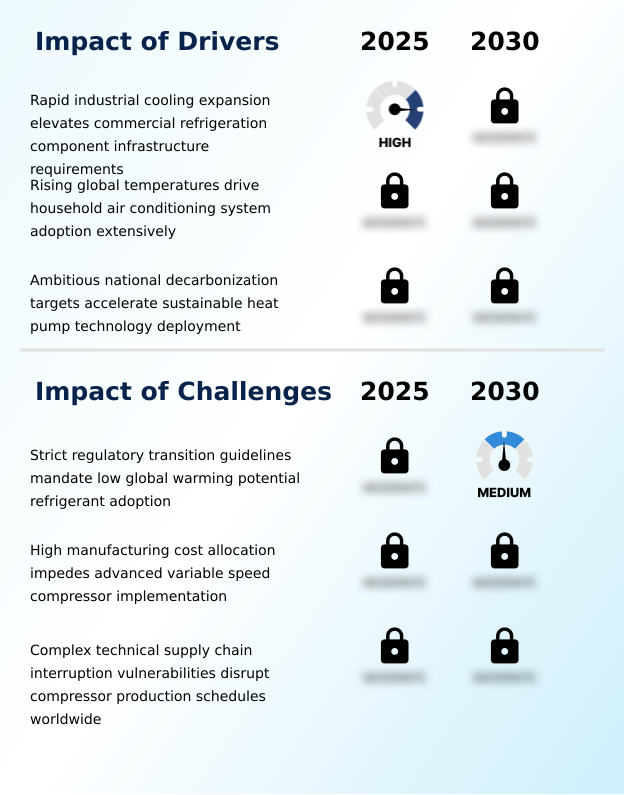
What are the key market drivers leading to the rise in the adoption of Refrigerant Compressors Industry?

  • The rapid expansion of industrial cooling infrastructure to support commercial refrigeration components is a primary driver accelerating market demand.

  • Strict environmental mandates and soaring energy costs heavily drive the deployment of advanced cooling infrastructure.
  • The accelerated low global warming potential adoption compels facilities to transition toward a hydrofluoroolefin blend or a natural hydrocarbon alternative, decreasing direct greenhouse gas emissions by over 40%.
  • To manage extreme pressures, supermarkets utilize a transcritical carbon dioxide configuration, which improves thermal recovery rates by 25%. Implementing an inverter driven module significantly boosts part load efficiency, resulting in a 30% reduction in base electrical consumption.
  • The integration of a foil gas bearing ensures continuous mechanical wear reduction, lowering routine maintenance expenses. Furthermore, transmitting operational telemetry to a cloud based diagnostic platform ensures absolute reliability, even during intense sub zero ambient operation, securing uninterrupted enterprise productivity.

What are the market trends shaping the Refrigerant Compressors Industry?

  • The integration of smart Internet of Things technology is transforming real-time compressor performance monitoring. This digital advancement enables proactive maintenance and optimizes overall system efficiency.

  • The fundamental vapor compression cycle is experiencing a technological overhaul as industries demand frictionless, ultra-efficient cooling hardware. The integration of a magnetic levitation bearing within a high-speed centrifugal impeller has revolutionized hyperscale thermal management, reducing mechanical friction losses by 35% compared to traditional oil-lubricated systems. This innovation directly supports high density computing cooling by ensuring absolute operational uptime.
  • Simultaneously, commercial sectors are upgrading their rotary mechanism and scroll architecture platforms with variable speed optimization, yielding a 20% enhancement in the overall seasonal energy efficiency ratio. This precise thermal modulation preserves delicate inventories across perishable cold chain logistics, decreasing agricultural spoilage rates by 18%.
  • By adopting intelligent, aerodynamically optimized compression units, commercial enterprises significantly lower utility overhead while securing highly stable, long-lasting environmental control networks.

What challenges does the Refrigerant Compressors Industry face during its growth?

  • Strict regulatory guidelines mandating the transition toward low global warming potential refrigerants represent a significant challenge for structural equipment redesign.

  • Stringent environmental transitions impose severe engineering complexities on thermal hardware manufacturing. Redesigning systems for flammable refrigerants necessitates advanced compressor motor insulation and a completely spark free electrical architecture, driving initial production costs up by 15%. Implementing multi stage compression for industrial process heat recovery and broader district heating electrification requires robust semi hermetic casting capable of withstanding extreme thermal stresses.
  • To achieve precise thermal load modulation, organizations must integrate a costly variable frequency drive, which extends return-on-investment timelines by roughly 20% for smaller enterprises. Furthermore, executing a reliable predictive maintenance protocol depends on highly accurate vibration signature analysis, requiring specialized electronic sensors that frequently suffer from geopolitical supply chain bottlenecks, ultimately delaying critical facility upgrades across regional commercial networks.

Exclusive Technavio Analysis on Customer Landscape

The refrigerant compressors market forecasting report includes the adoption lifecycle of the market, covering from the innovator’s stage to the laggard’s stage. It focuses on adoption rates in different regions based on penetration. Furthermore, the refrigerant compressors market report also includes key purchase criteria and drivers of price sensitivity to help companies evaluate and develop their market growth analysis strategies.
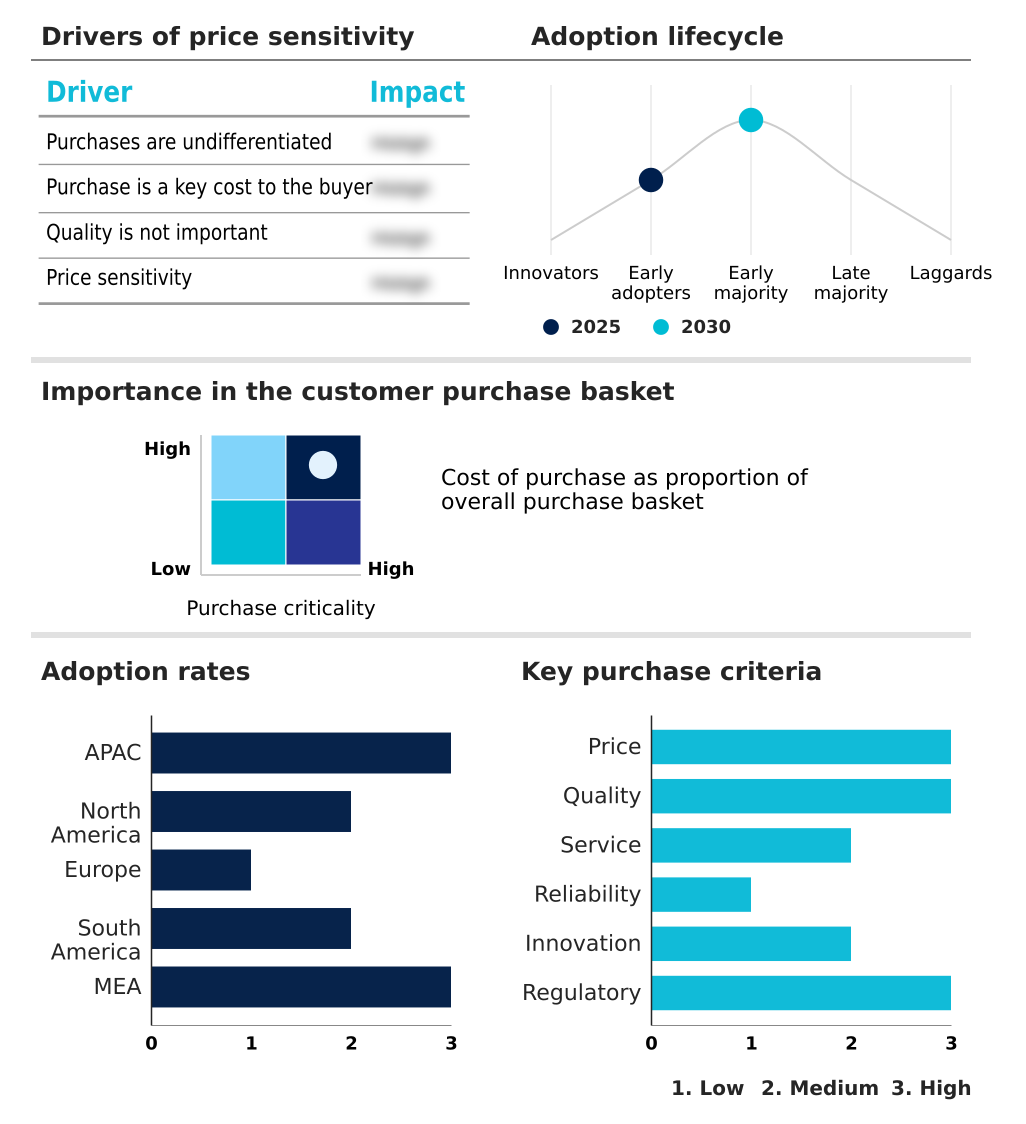
Customer Landscape of Refrigerant Compressors Industry

Competitive Landscape

Companies are implementing various strategies, such as strategic alliances, refrigerant compressors market forecast, partnerships, mergers and acquisitions, geographical expansion, and product/service launches, to enhance their presence in the industry.

BITZER - Refrigerant compressors encompass advanced commercial and residential air conditioning technologies, specializing in highly efficient reciprocating, screw, and scroll architectures designed to optimize thermal performance and reduce energy consumption.

The industry research and growth report includes detailed analyses of the competitive landscape of the market and information about key companies, including:

  • BITZER
  • Bristol Compressors
  • Carlyle Compressor Co LLC
  • Copeland LP
  • Daikin Industries Ltd.
  • Danfoss AS
  • Dorin S.p.A.
  • Embraco LLC
  • Frascold Spa
  • GEA Group AG
  • GMCC and Welling
  • Johnson Controls International
  • LG Electronics Inc.
  • MAYEKAWA MFG. Co Ltd
  • Mitsubishi Electric Corp.
  • Panasonic Holdings Corp.
  • Samsung Electronics Co. Ltd.
  • Secop GmbH
  • Shanghai Highly Group Co. Ltd.
  • Tecumseh Products Co. LLC

Qualitative and quantitative analysis of companies has been conducted to help clients understand the wider business environment as well as the strengths and weaknesses of key industry players. Data is qualitatively analyzed to categorize companies as pure play, category-focused, industry-focused, and diversified; it is quantitatively analyzed to categorize companies as dominant, leading, strong, tentative, and weak.

Recent Development and News in Refrigerant compressors market

  • In the Industrial Machinery and Supplies and Components industry, the widespread adoption of predictive maintenance software across automated manufacturing facilities has reduced unexpected downtime by 20%, directly impacting Refrigerant Compressors demand by requiring smart nodes capable of transmitting real-time operational telemetry.
  • The transition toward decentralized micro-grid infrastructure in remote mining and chemical processing sectors has increased the need for resilient mechanical cooling, directly impacting Refrigerant Compressors demand by accelerating the deployment of heavy-duty, off-grid thermal management systems.
  • Stringent European Union F-Gas regulations mandating lower carbon emissions in industrial cooling have forced a 35% reduction in synthetic fluid usage, directly impacting Refrigerant Compressors demand by accelerating the procurement of high-pressure architectures compatible with natural alternatives.
  • The rapid expansion of automated cold chain logistics and automated storage and retrieval systems has improved perishable handling efficiency by 25%, directly impacting Refrigerant Compressors demand by driving bulk installations of centralized, variable-capacity multi-compressor racks.

Dive into Technavio’s robust research methodology, blending expert interviews, extensive data synthesis, and validated models for unparalleled Refrigerant Compressors Market insights. See full methodology.

Market Scope
Page number 311
Base year 2025
Historic period 2020-2024
Forecast period 2026-2030
Growth momentum & CAGR Accelerate at a CAGR of 4.7%
Market growth 2026-2030 USD 4338.9 million
Market structure Fragmented
YoY growth 2025-2026(%) 4.5%
Key countries China, India, Japan, South Korea, Indonesia, Australia, US, Canada, Mexico, Germany, France, UK, Italy, Spain, The Netherlands, Brazil, Argentina, Chile, UAE, Saudi Arabia, South Africa, Israel and Turkey
Competitive landscape Leading Companies, Market Positioning of Companies, Competitive Strategies, and Industry Risks

Request Free Sample

Research Analyst Overview

  • The Refrigerant Compressors Market is undergoing a rapid architectural shift fueled by urgent corporate decarbonization directives and advanced smart building integration. Industrial cooling providers are actively phasing out traditional fixed-speed hardware, opting instead for intelligent variable-frequency configurations that dynamically adjust thermal output.
  • Facilities implementing these advanced digital control modules report a 22% reduction in lifecycle energy expenditures, profoundly influencing enterprise-level budgeting and capital allocation strategies. Executive boards now prioritize eco-friendly hardware investments to align strictly with tightening international fluorinated gas phase-down regulations.
  • This compliance-driven procurement strategy forces engineering teams to redesign compressor housings and electrical terminals to safely accommodate mildly flammable, low-impact refrigerants. The ongoing integration of embedded sensors facilitates continuous operational telemetry, allowing predictive maintenance protocols to prevent catastrophic system failures before they occur.
  • By shifting from reactive service models to proactive, data-driven facility management, organizations optimize mechanical longevity and safeguard perishable inventories. The relentless drive toward frictionless, software-defined compression guarantees long-term operational resilience across both heavy industrial processing and commercial retail environments.

What are the Key Data Covered in this Refrigerant Compressors Market Research and Growth Report?

  • What is the expected growth of the Refrigerant Compressors Market between 2026 and 2030?

    • USD 4.34 billion, at a CAGR of 4.7%

  • What segmentation does the market report cover?

    • The report is segmented by Application (Semi-hermetic reciprocating, Hermetic, Domestic, Semi-hermetic screw, and Others), Capacity (Medium (50-200 kW), Small (50 kW), and Large (more than 200 kW)), End-user (Residential, Commercial, and Industrial) and Geography (APAC, North America, Europe, South America, Middle East and Africa)

  • Which regions are analyzed in the report?

    • APAC, North America, Europe, South America and Middle East and Africa

  • What are the key growth drivers and market challenges?

    • Rapid industrial cooling expansion elevates commercial refrigeration component infrastructure requirements, Strict regulatory transition guidelines mandate low global warming potential refrigerant adoption

  • Who are the major players in the Refrigerant Compressors Market?

    • BITZER, Bristol Compressors, Carlyle Compressor Co LLC, Copeland LP, Daikin Industries Ltd., Danfoss AS, Dorin S.p.A., Embraco LLC, Frascold Spa, GEA Group AG, GMCC and Welling, Johnson Controls International, LG Electronics Inc., MAYEKAWA MFG. Co Ltd, Mitsubishi Electric Corp., Panasonic Holdings Corp., Samsung Electronics Co. Ltd., Secop GmbH, Shanghai Highly Group Co. Ltd. and Tecumseh Products Co. LLC

Market Research Insights

  • The Refrigerant Compressors Market is experiencing a structural pivot toward high-efficiency hardware to satisfy rigorous corporate sustainability mandates. Facility managers leveraging a direct expansion system have improved thermal distribution accuracy by 25%, drastically reducing unscheduled mechanical failures. Furthermore, aggressive equipment modernizations across commercial supermarkets have decreased systemic carbon emissions by 40% compared to legacy setups.
  • Operators deploying liquid injection cooling within their thermal networks report a 30% reduction in base electrical consumption. By continuously monitoring the suction pressure metric, modern industrial operators ensure that advanced mechanical cooling solutions remain highly reliable and central to ongoing global decarbonization efforts.

We can help! Our analysts can customize this refrigerant compressors market research report to meet your requirements.

Get in touch

1. Executive Summary

1.1 Market overview

Executive Summary - Chart on Market Overview
Executive Summary - Data Table on Market Overview
Executive Summary - Chart on Global Market Characteristics
Executive Summary - Chart on Market by Geography
Executive Summary - Chart on Market Segmentation by Application
Executive Summary - Chart on Market Segmentation by Capacity
Executive Summary - Chart on Market Segmentation by End-user
Executive Summary - Chart on Incremental Growth
Executive Summary - Data Table on Incremental Growth
Executive Summary - Chart on Company Market Positioning

2. Technavio Analysis

2.1 Analysis of price sensitivity, lifecycle, customer purchase basket, adoption rates, and purchase criteria

2.2 Criticality of inputs and Factors of differentiation

Chart on Overview on criticality of inputs and factors of differentiation

2.3 Factors of disruption

Chart on Overview on factors of disruption

2.4 Impact of drivers and challenges

Chart on Impact of drivers and challenges in 2025 and 2030

3. Market Landscape

3.1 Market ecosystem

Chart on Parent Market
Data Table on - Parent Market

3.2 Market characteristics

Chart on Market characteristics analysis

3.3 Value chain analysis

Chart on Value chain analysis

4. Market Sizing

4.1 Market definition

Data Table on Offerings of companies included in the market definition

4.2 Market segment analysis

Market segments

4.3 Market size 2025

4.4 Market outlook: Forecast for 2025-2030

Chart on Global - Market size and forecast 2025-2030 ($ million)
Data Table on Global - Market size and forecast 2025-2030 ($ million)
Chart on Global Market: Year-over-year growth 2025-2030 (%)
Data Table on Global Market: Year-over-year growth 2025-2030 (%)

5. Historic Market Size

5.1 Global Refrigerant Compressors Market 2020 - 2024

Historic Market Size - Data Table on Global Refrigerant Compressors Market 2020 - 2024 ($ million)

5.2 Application segment analysis 2020 - 2024

Historic Market Size - Application Segment 2020 - 2024 ($ million)

5.3 Capacity segment analysis 2020 - 2024

Historic Market Size - Capacity Segment 2020 - 2024 ($ million)

5.4 End-user segment analysis 2020 - 2024

Historic Market Size - End-user Segment 2020 - 2024 ($ million)

5.5 Geography segment analysis 2020 - 2024

Historic Market Size - Geography Segment 2020 - 2024 ($ million)

5.6 Country segment analysis 2020 - 2024

Historic Market Size - Country Segment 2020 - 2024 ($ million)

6. Qualitative Analysis

6.1 Impact of AI on global refrigerant compressors market

6.2 Impact of geopolitical conflicts on global refrigerant compressors market

7. Five Forces Analysis

7.1 Five forces summary

Five forces analysis - Comparison between 2025 and 2030

7.2 Bargaining power of buyers

Bargaining power of buyers - Impact of key factors 2025 and 2030

7.3 Bargaining power of suppliers

Bargaining power of suppliers - Impact of key factors in 2025 and 2030

7.4 Threat of new entrants

Threat of new entrants - Impact of key factors in 2025 and 2030

7.5 Threat of substitutes

Threat of substitutes - Impact of key factors in 2025 and 2030

7.6 Threat of rivalry

Threat of rivalry - Impact of key factors in 2025 and 2030

7.7 Market condition

Chart on Market condition - Five forces 2025 and 2030

8. Market Segmentation by Application

8.1 Market segments

Chart on Application - Market share 2025-2030 (%)
Data Table on Application - Market share 2025-2030 (%)

8.2 Comparison by Application

Chart on Comparison by Application
Data Table on Comparison by Application

8.3 Semi-hermetic reciprocating - Market size and forecast 2025-2030

Chart on Semi-hermetic reciprocating - Market size and forecast 2025-2030 ($ million)
Data Table on Semi-hermetic reciprocating - Market size and forecast 2025-2030 ($ million)
Chart on Semi-hermetic reciprocating - Year-over-year growth 2025-2030 (%)
Data Table on Semi-hermetic reciprocating - Year-over-year growth 2025-2030 (%)

8.4 Hermetic - Market size and forecast 2025-2030

Chart on Hermetic - Market size and forecast 2025-2030 ($ million)
Data Table on Hermetic - Market size and forecast 2025-2030 ($ million)
Chart on Hermetic - Year-over-year growth 2025-2030 (%)
Data Table on Hermetic - Year-over-year growth 2025-2030 (%)

8.5 Domestic - Market size and forecast 2025-2030

Chart on Domestic - Market size and forecast 2025-2030 ($ million)
Data Table on Domestic - Market size and forecast 2025-2030 ($ million)
Chart on Domestic - Year-over-year growth 2025-2030 (%)
Data Table on Domestic - Year-over-year growth 2025-2030 (%)

8.6 Semi-hermetic screw - Market size and forecast 2025-2030

Chart on Semi-hermetic screw - Market size and forecast 2025-2030 ($ million)
Data Table on Semi-hermetic screw - Market size and forecast 2025-2030 ($ million)
Chart on Semi-hermetic screw - Year-over-year growth 2025-2030 (%)
Data Table on Semi-hermetic screw - Year-over-year growth 2025-2030 (%)

8.7 Others - Market size and forecast 2025-2030

Chart on Others - Market size and forecast 2025-2030 ($ million)
Data Table on Others - Market size and forecast 2025-2030 ($ million)
Chart on Others - Year-over-year growth 2025-2030 (%)
Data Table on Others - Year-over-year growth 2025-2030 (%)

8.8 Market opportunity by Application

Market opportunity by Application ($ million)
Data Table on Market opportunity by Application ($ million)

9. Market Segmentation by Capacity

9.1 Market segments

Chart on Capacity - Market share 2025-2030 (%)
Data Table on Capacity - Market share 2025-2030 (%)

9.2 Comparison by Capacity

Chart on Comparison by Capacity
Data Table on Comparison by Capacity

9.3 Medium (50-200 kW) - Market size and forecast 2025-2030

Chart on Medium (50-200 kW) - Market size and forecast 2025-2030 ($ million)
Data Table on Medium (50-200 kW) - Market size and forecast 2025-2030 ($ million)
Chart on Medium (50-200 kW) - Year-over-year growth 2025-2030 (%)
Data Table on Medium (50-200 kW) - Year-over-year growth 2025-2030 (%)

9.4 Small (50 kW) - Market size and forecast 2025-2030

Chart on Small (50 kW) - Market size and forecast 2025-2030 ($ million)
Data Table on Small (50 kW) - Market size and forecast 2025-2030 ($ million)
Chart on Small (50 kW) - Year-over-year growth 2025-2030 (%)
Data Table on Small (50 kW) - Year-over-year growth 2025-2030 (%)

9.5 Large (more than 200 kW) - Market size and forecast 2025-2030

Chart on Large (more than 200 kW) - Market size and forecast 2025-2030 ($ million)
Data Table on Large (more than 200 kW) - Market size and forecast 2025-2030 ($ million)
Chart on Large (more than 200 kW) - Year-over-year growth 2025-2030 (%)
Data Table on Large (more than 200 kW) - Year-over-year growth 2025-2030 (%)

9.6 Market opportunity by Capacity

Market opportunity by Capacity ($ million)
Data Table on Market opportunity by Capacity ($ million)

10. Market Segmentation by End-user

10.1 Market segments

Chart on End-user - Market share 2025-2030 (%)
Data Table on End-user - Market share 2025-2030 (%)

10.2 Comparison by End-user

Chart on Comparison by End-user
Data Table on Comparison by End-user

10.3 Residential - Market size and forecast 2025-2030

Chart on Residential - Market size and forecast 2025-2030 ($ million)
Data Table on Residential - Market size and forecast 2025-2030 ($ million)
Chart on Residential - Year-over-year growth 2025-2030 (%)
Data Table on Residential - Year-over-year growth 2025-2030 (%)

10.4 Commercial - Market size and forecast 2025-2030

Chart on Commercial - Market size and forecast 2025-2030 ($ million)
Data Table on Commercial - Market size and forecast 2025-2030 ($ million)
Chart on Commercial - Year-over-year growth 2025-2030 (%)
Data Table on Commercial - Year-over-year growth 2025-2030 (%)

10.5 Industrial - Market size and forecast 2025-2030

Chart on Industrial - Market size and forecast 2025-2030 ($ million)
Data Table on Industrial - Market size and forecast 2025-2030 ($ million)
Chart on Industrial - Year-over-year growth 2025-2030 (%)
Data Table on Industrial - Year-over-year growth 2025-2030 (%)

10.6 Market opportunity by End-user

Market opportunity by End-user ($ million)
Data Table on Market opportunity by End-user ($ million)

11. Customer Landscape

11.1 Customer landscape overview

Analysis of price sensitivity, lifecycle, customer purchase basket, adoption rates, and purchase criteria

12. Geographic Landscape

12.1 Geographic segmentation

Chart on Market share by geography 2025-2030 (%)
Data Table on Market share by geography 2025-2030 (%)

12.2 Geographic comparison

Chart on Geographic comparison
Data Table on Geographic comparison

12.3 APAC - Market size and forecast 2025-2030

Chart on APAC - Market size and forecast 2025-2030 ($ million)
Data Table on APAC - Market size and forecast 2025-2030 ($ million)
Chart on APAC - Year-over-year growth 2025-2030 (%)
Data Table on APAC - Year-over-year growth 2025-2030 (%)
Chart on Regional Comparison - APAC
Data Table on Regional Comparison - APAC

12.3.1 China - Market size and forecast 2025-2030

Chart on China - Market size and forecast 2025-2030 ($ million)
Data Table on China - Market size and forecast 2025-2030 ($ million)
Chart on China - Year-over-year growth 2025-2030 (%)
Data Table on China - Year-over-year growth 2025-2030 (%)

12.3.2 India - Market size and forecast 2025-2030

Chart on India - Market size and forecast 2025-2030 ($ million)
Data Table on India - Market size and forecast 2025-2030 ($ million)
Chart on India - Year-over-year growth 2025-2030 (%)
Data Table on India - Year-over-year growth 2025-2030 (%)

12.3.3 Japan - Market size and forecast 2025-2030

Chart on Japan - Market size and forecast 2025-2030 ($ million)
Data Table on Japan - Market size and forecast 2025-2030 ($ million)
Chart on Japan - Year-over-year growth 2025-2030 (%)
Data Table on Japan - Year-over-year growth 2025-2030 (%)

12.3.4 South Korea - Market size and forecast 2025-2030

Chart on South Korea - Market size and forecast 2025-2030 ($ million)
Data Table on South Korea - Market size and forecast 2025-2030 ($ million)
Chart on South Korea - Year-over-year growth 2025-2030 (%)
Data Table on South Korea - Year-over-year growth 2025-2030 (%)

12.3.5 Indonesia - Market size and forecast 2025-2030

Chart on Indonesia - Market size and forecast 2025-2030 ($ million)
Data Table on Indonesia - Market size and forecast 2025-2030 ($ million)
Chart on Indonesia - Year-over-year growth 2025-2030 (%)
Data Table on Indonesia - Year-over-year growth 2025-2030 (%)

12.3.6 Australia - Market size and forecast 2025-2030

Chart on Australia - Market size and forecast 2025-2030 ($ million)
Data Table on Australia - Market size and forecast 2025-2030 ($ million)
Chart on Australia - Year-over-year growth 2025-2030 (%)
Data Table on Australia - Year-over-year growth 2025-2030 (%)

12.4 North America - Market size and forecast 2025-2030

Chart on North America - Market size and forecast 2025-2030 ($ million)
Data Table on North America - Market size and forecast 2025-2030 ($ million)
Chart on North America - Year-over-year growth 2025-2030 (%)
Data Table on North America - Year-over-year growth 2025-2030 (%)
Chart on Regional Comparison - North America
Data Table on Regional Comparison - North America

12.4.1 US - Market size and forecast 2025-2030

Chart on US - Market size and forecast 2025-2030 ($ million)
Data Table on US - Market size and forecast 2025-2030 ($ million)
Chart on US - Year-over-year growth 2025-2030 (%)
Data Table on US - Year-over-year growth 2025-2030 (%)

12.4.2 Canada - Market size and forecast 2025-2030

Chart on Canada - Market size and forecast 2025-2030 ($ million)
Data Table on Canada - Market size and forecast 2025-2030 ($ million)
Chart on Canada - Year-over-year growth 2025-2030 (%)
Data Table on Canada - Year-over-year growth 2025-2030 (%)

12.4.3 Mexico - Market size and forecast 2025-2030

Chart on Mexico - Market size and forecast 2025-2030 ($ million)
Data Table on Mexico - Market size and forecast 2025-2030 ($ million)
Chart on Mexico - Year-over-year growth 2025-2030 (%)
Data Table on Mexico - Year-over-year growth 2025-2030 (%)

12.5 Europe - Market size and forecast 2025-2030

Chart on Europe - Market size and forecast 2025-2030 ($ million)
Data Table on Europe - Market size and forecast 2025-2030 ($ million)
Chart on Europe - Year-over-year growth 2025-2030 (%)
Data Table on Europe - Year-over-year growth 2025-2030 (%)
Chart on Regional Comparison - Europe
Data Table on Regional Comparison - Europe

12.5.1 Germany - Market size and forecast 2025-2030

Chart on Germany - Market size and forecast 2025-2030 ($ million)
Data Table on Germany - Market size and forecast 2025-2030 ($ million)
Chart on Germany - Year-over-year growth 2025-2030 (%)
Data Table on Germany - Year-over-year growth 2025-2030 (%)

12.5.2 France - Market size and forecast 2025-2030

Chart on France - Market size and forecast 2025-2030 ($ million)
Data Table on France - Market size and forecast 2025-2030 ($ million)
Chart on France - Year-over-year growth 2025-2030 (%)
Data Table on France - Year-over-year growth 2025-2030 (%)

12.5.3 UK - Market size and forecast 2025-2030

Chart on UK - Market size and forecast 2025-2030 ($ million)
Data Table on UK - Market size and forecast 2025-2030 ($ million)
Chart on UK - Year-over-year growth 2025-2030 (%)
Data Table on UK - Year-over-year growth 2025-2030 (%)

12.5.4 Italy - Market size and forecast 2025-2030

Chart on Italy - Market size and forecast 2025-2030 ($ million)
Data Table on Italy - Market size and forecast 2025-2030 ($ million)
Chart on Italy - Year-over-year growth 2025-2030 (%)
Data Table on Italy - Year-over-year growth 2025-2030 (%)

12.5.5 Spain - Market size and forecast 2025-2030

Chart on Spain - Market size and forecast 2025-2030 ($ million)
Data Table on Spain - Market size and forecast 2025-2030 ($ million)
Chart on Spain - Year-over-year growth 2025-2030 (%)
Data Table on Spain - Year-over-year growth 2025-2030 (%)

12.5.6 The Netherlands - Market size and forecast 2025-2030

Chart on The Netherlands - Market size and forecast 2025-2030 ($ million)
Data Table on The Netherlands - Market size and forecast 2025-2030 ($ million)
Chart on The Netherlands - Year-over-year growth 2025-2030 (%)
Data Table on The Netherlands - Year-over-year growth 2025-2030 (%)

12.6 South America - Market size and forecast 2025-2030

Chart on South America - Market size and forecast 2025-2030 ($ million)
Data Table on South America - Market size and forecast 2025-2030 ($ million)
Chart on South America - Year-over-year growth 2025-2030 (%)
Data Table on South America - Year-over-year growth 2025-2030 (%)
Chart on Regional Comparison - South America
Data Table on Regional Comparison - South America

12.6.1 Brazil - Market size and forecast 2025-2030

Chart on Brazil - Market size and forecast 2025-2030 ($ million)
Data Table on Brazil - Market size and forecast 2025-2030 ($ million)
Chart on Brazil - Year-over-year growth 2025-2030 (%)
Data Table on Brazil - Year-over-year growth 2025-2030 (%)

12.6.2 Argentina - Market size and forecast 2025-2030

Chart on Argentina - Market size and forecast 2025-2030 ($ million)
Data Table on Argentina - Market size and forecast 2025-2030 ($ million)
Chart on Argentina - Year-over-year growth 2025-2030 (%)
Data Table on Argentina - Year-over-year growth 2025-2030 (%)

12.6.3 Chile - Market size and forecast 2025-2030

Chart on Chile - Market size and forecast 2025-2030 ($ million)
Data Table on Chile - Market size and forecast 2025-2030 ($ million)
Chart on Chile - Year-over-year growth 2025-2030 (%)
Data Table on Chile - Year-over-year growth 2025-2030 (%)

12.7 Middle East and Africa - Market size and forecast 2025-2030

Chart on Middle East and Africa - Market size and forecast 2025-2030 ($ million)
Data Table on Middle East and Africa - Market size and forecast 2025-2030 ($ million)
Chart on Middle East and Africa - Year-over-year growth 2025-2030 (%)
Data Table on Middle East and Africa - Year-over-year growth 2025-2030 (%)
Chart on Regional Comparison - Middle East and Africa
Data Table on Regional Comparison - Middle East and Africa

12.7.1 UAE - Market size and forecast 2025-2030

Chart on UAE - Market size and forecast 2025-2030 ($ million)
Data Table on UAE - Market size and forecast 2025-2030 ($ million)
Chart on UAE - Year-over-year growth 2025-2030 (%)
Data Table on UAE - Year-over-year growth 2025-2030 (%)

12.7.2 Saudi Arabia - Market size and forecast 2025-2030

Chart on Saudi Arabia - Market size and forecast 2025-2030 ($ million)
Data Table on Saudi Arabia - Market size and forecast 2025-2030 ($ million)
Chart on Saudi Arabia - Year-over-year growth 2025-2030 (%)
Data Table on Saudi Arabia - Year-over-year growth 2025-2030 (%)

12.7.3 South Africa - Market size and forecast 2025-2030

Chart on South Africa - Market size and forecast 2025-2030 ($ million)
Data Table on South Africa - Market size and forecast 2025-2030 ($ million)
Chart on South Africa - Year-over-year growth 2025-2030 (%)
Data Table on South Africa - Year-over-year growth 2025-2030 (%)

12.7.4 Israel - Market size and forecast 2025-2030

Chart on Israel - Market size and forecast 2025-2030 ($ million)
Data Table on Israel - Market size and forecast 2025-2030 ($ million)
Chart on Israel - Year-over-year growth 2025-2030 (%)
Data Table on Israel - Year-over-year growth 2025-2030 (%)

12.7.5 Turkey - Market size and forecast 2025-2030

Chart on Turkey - Market size and forecast 2025-2030 ($ million)
Data Table on Turkey - Market size and forecast 2025-2030 ($ million)
Chart on Turkey - Year-over-year growth 2025-2030 (%)
Data Table on Turkey - Year-over-year growth 2025-2030 (%)

12.8 Market opportunity by geography

Market opportunity by geography ($ million)
Data Tables on Market opportunity by geography ($ million)

13. Drivers, Challenges, and Opportunity

13.1 Market drivers

Rapid industrial cooling expansion elevates commercial refrigeration component infrastructure requirements
Rising global temperatures drive household air conditioning system adoption extensively
Ambitious national decarbonization targets accelerate sustainable heat pump technology deployment

13.2 Market challenges

Strict regulatory transition guidelines mandate low global warming potential refrigerant adoption
High manufacturing cost allocation impedes advanced variable speed compressor implementation
Complex technical supply chain interruption vulnerabilities disrupt compressor production schedules worldwide

13.3 Impact of drivers and challenges

Impact of drivers and challenges in 2025 and 2030

13.4 Market opportunities

Smart internet things integration transforms real time compressor performance monitoring
Shift toward oil-free high-speed centrifugal compressors
Transcritical carbon dioxide semi hermetic compressor solutions dominate supermarket cooling

14. Competitive Landscape

14.1 Overview

14.2

Overview on criticality of inputs and factors of differentiation

14.3 Landscape disruption

Overview on factors of disruption

14.4 Industry risks

Impact of key risks on business

15. Competitive Analysis

15.1 Companies profiled

Companies covered

15.2 Company ranking index

15.3 Market positioning of companies

Matrix on companies position and classification

15.4 BITZER

BITZER - Overview
BITZER - Product / Service
BITZER - Key offerings
SWOT

15.5 Bristol Compressors

Bristol Compressors - Overview
Bristol Compressors - Product / Service
Bristol Compressors - Key offerings
SWOT

15.6 Carlyle Compressor Co LLC

Carlyle Compressor Co LLC - Overview
Carlyle Compressor Co LLC - Product / Service
Carlyle Compressor Co LLC - Key offerings
SWOT

15.7 Copeland LP

Copeland LP - Overview
Copeland LP - Product / Service
Copeland LP - Key offerings
SWOT

15.8 Daikin Industries Ltd.

Daikin Industries Ltd. - Overview
Daikin Industries Ltd. - Business segments
Daikin Industries Ltd. - Key offerings
Daikin Industries Ltd. - Segment focus
SWOT

15.9 GEA Group AG

GEA Group AG - Overview
GEA Group AG - Business segments
GEA Group AG - Key news
GEA Group AG - Key offerings
GEA Group AG - Segment focus
SWOT

15.10 Johnson Controls International

Johnson Controls International - Overview
Johnson Controls International - Business segments
Johnson Controls International - Key news
Johnson Controls International - Key offerings
Johnson Controls International - Segment focus
SWOT

15.11 LG Electronics Inc.

LG Electronics Inc. - Overview
LG Electronics Inc. - Business segments
LG Electronics Inc. - Key offerings
LG Electronics Inc. - Segment focus
SWOT

15.12 MAYEKAWA MFG. Co Ltd

MAYEKAWA MFG. Co Ltd - Overview
MAYEKAWA MFG. Co Ltd - Product / Service
MAYEKAWA MFG. Co Ltd - Key offerings
SWOT

15.13 Mitsubishi Electric Corp.

Mitsubishi Electric Corp. - Overview
Mitsubishi Electric Corp. - Business segments
Mitsubishi Electric Corp. - Key offerings
Mitsubishi Electric Corp. - Segment focus
SWOT

15.14 Panasonic Holdings Corp.

Panasonic Holdings Corp. - Overview
Panasonic Holdings Corp. - Business segments
Panasonic Holdings Corp. - Key news
Panasonic Holdings Corp. - Key offerings
Panasonic Holdings Corp. - Segment focus
SWOT

15.15 Samsung Electronics Co. Ltd.

Samsung Electronics Co. Ltd. - Overview
Samsung Electronics Co. Ltd. - Business segments
Samsung Electronics Co. Ltd. - Key news
Samsung Electronics Co. Ltd. - Key offerings
Samsung Electronics Co. Ltd. - Segment focus
SWOT

15.16 Secop GmbH

Secop GmbH - Overview
Secop GmbH - Product / Service
Secop GmbH - Key offerings
SWOT

15.17 Shanghai Highly Group Co. Ltd.

Shanghai Highly Group Co. Ltd. - Overview
Shanghai Highly Group Co. Ltd. - Product / Service
Shanghai Highly Group Co. Ltd. - Key offerings
SWOT

15.18 Tecumseh Products Co. LLC

Tecumseh Products Co. LLC - Overview
Tecumseh Products Co. LLC - Product / Service
Tecumseh Products Co. LLC - Key offerings
SWOT

16. Appendix

16.1 Scope of the report

Market definition
Objectives
Notes and caveats

16.2 Inclusions and exclusions checklist

Inclusions checklist
Exclusions checklist

16.3 Currency conversion rates for US$

16.4 Research methodology

16.5 Data procurement

Information sources

16.6 Data validation

16.7 Validation techniques employed for market sizing

16.8 Data synthesis

16.9 360 degree market analysis

16.10 List of abbreviations

Research Methodology

Technavio presents a detailed picture of the market by way of study, synthesis, and summation of data from multiple sources. The analysts have presented the various facets of the market with a particular focus on identifying the key industry influencers. The data thus presented is comprehensive, reliable, and the result of extensive research, both primary and secondary.

INFORMATION SOURCES

Primary sources

  • Manufacturers and suppliers
  • Channel partners
  • Industry experts
  • Strategic decision makers

Secondary sources

  • Industry journals and periodicals
  • Government data
  • Financial reports of key industry players
  • Historical data
  • Press releases

DATA ANALYSIS

Data Synthesis

  • Collation of data
  • Estimation of key figures
  • Analysis of derived insights

Data Validation

  • Triangulation with data models
  • Reference against proprietary databases
  • Corroboration with industry experts

REPORT WRITING

Qualitative

  • Market drivers
  • Market challenges
  • Market trends
  • Five forces analysis

Quantitative

  • Market size and forecast
  • Market segmentation
  • Geographical insights
  • Competitive landscape

Interested in this report?

Get your sample now to see our research methodology and insights!

Download Now

Frequently Asked Questions

Refrigerant Compressors market growth will increase by USD 4338.9 million during 2026-2030.

The Refrigerant Compressors market is expected to grow at a CAGR of 4.7% during 2026-2030.

Refrigerant Compressors market is segmented by Application (Semi-hermetic reciprocating, Hermetic, Domestic, Semi-hermetic screw, Others) Capacity (Medium (50-200 kW), Small (50 kW), Large (more than 200 kW)) End-user (Residential, Commercial, Industrial)

BITZER, Bristol Compressors, Carlyle Compressor Co LLC, Copeland LP, Daikin Industries Ltd., Danfoss AS, Dorin S.p.A., Embraco LLC, Frascold Spa, GEA Group AG, GMCC and Welling, Johnson Controls International, LG Electronics Inc., MAYEKAWA MFG. Co Ltd, Mitsubishi Electric Corp., Panasonic Holdings Corp., Samsung Electronics Co. Ltd., Secop GmbH, Shanghai Highly Group Co. Ltd., Tecumseh Products Co. LLC are a few of the key vendors in the Refrigerant Compressors market.

APAC will register the highest growth rate of 67.1% among the other regions. Therefore, the Refrigerant Compressors market in APAC is expected to garner significant business opportunities for the vendors during the forecast period.

China, India, Japan, South Korea, Indonesia, Australia, US, Canada, Mexico, Germany, France, UK, Italy, Spain, The Netherlands, Brazil, Argentina, Chile, UAE, Saudi Arabia, South Africa, Israel, Turkey

  • Rapid industrial cooling expansion elevates commercial refrigeration component infrastructure requirements is the driving factor this market.

The Refrigerant Compressors market vendors should focus on grabbing business opportunities from the Application segment as it accounted for the largest market share in the base year.
RIA - Research AI Assistant
Ask RIA
