
Regtech Market Analysis, Size, and Forecast 2026-2030: North America (US, Canada, and Mexico), Europe (UK, Germany, and France), APAC (China, Japan, and India), South America (Brazil, Argentina, and Chile), Middle East and Africa (UAE, Saudi Arabia, and South Africa), and Rest of World (ROW)

Regtech Market Analysis, Size, and Forecast 2026-2030:
North America (US, Canada, and Mexico), Europe (UK, Germany, and France), APAC (China, Japan, and India), South America (Brazil, Argentina, and Chile), Middle East and Africa (UAE, Saudi Arabia, and South Africa), and Rest of World (ROW)

Published: Oct 2026 295 Pages SKU: IRTNTR70467

Market Overview at a Glance

$53.02 B
Market Opportunity
32.2%
CAGR 2025 - 2030
31.3%
North America Growth
$10.71 B
Solutions segment 2024

Regtech Market Size 2026-2030

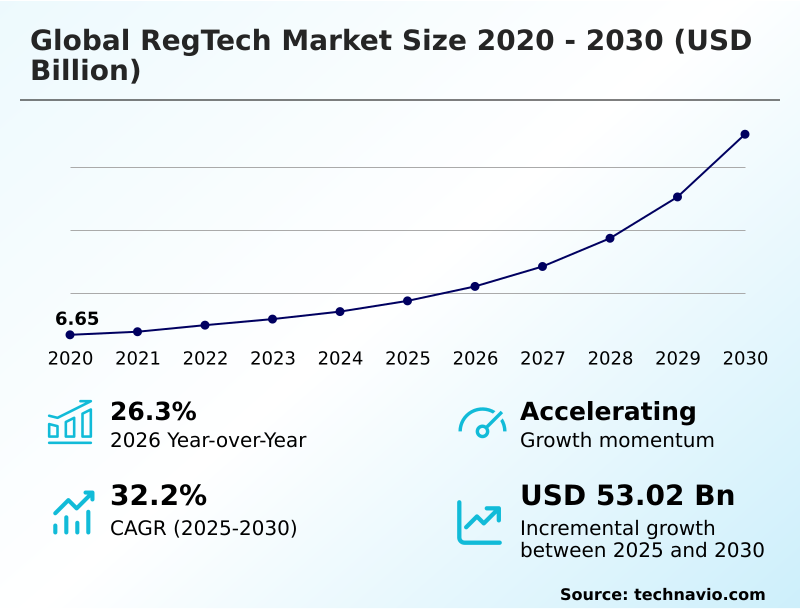
The regtech market size is valued to increase by USD 53.02 billion, at a CAGR of 32.2% from 2025 to 2030. Escalating complexity of cross border financial regulations will drive the regtech market.

Major Market Trends & Insights

  • North America dominated the market and accounted for a 31.3% growth during the forecast period.
  • By Component - Solutions segment was valued at USD 10.71 billion in 2024
  • By End-user - Large enterprises segment accounted for the largest market revenue share in 2024

Market Size & Forecast

  • Market Opportunities: USD 63.82 billion
  • Market Future Opportunities: USD 53.02 billion
  • CAGR from 2025 to 2030 : 32.2%

Market Summary

  • The Regtech environment demonstrates accelerating momentum as enterprises systematically transition from manual compliance tracking to highly sophisticated, technology driven risk management infrastructures. Organizations navigating multi layered supply chains and international transactions are deploying advanced algorithmic verification models to eliminate operational opacity and guarantee continuous vendor screening.
  • By implementing these digital platforms, multinational corporations have achieved a 35% reduction in compliance processing delays compared to traditional manual oversight workflows. A primary driver of this technological adoption is the escalating complexity of cross border financial regulations, which forces institutions to integrate real time regulatory intelligence dashboards to prevent severe administrative penalties.
  • Conversely, profound regulatory fragmentation across diverse geographic jurisdictions acts as a substantial operational challenge, causing localized implementation bottlenecks as technology providers struggle to adapt standardized software to vastly different sovereign legal frameworks.
  • Despite these integration hurdles, the necessity to secure digital payment ecosystems ensures that enterprises continue to invest heavily in resilient, automated compliance systems that safeguard consumer data and streamline institutional reporting capabilities.

What will be the Size of the Regtech Market during the forecast period?
Get Key Insights on Market Forecast (PDF) Get Free Sample

How is the Regtech Market Segmented?

The regtech industry research report provides comprehensive data (region-wise segment analysis), with forecasts and estimates in "USD million" for the period 2026-2030, as well as historical data from 2020-2024 for the following segments.

  • Component
    • Solutions
    • Services
  • End-user
    • Large enterprises
    • Small and medium enterprises
  • Deployment
    • Cloud-based
    • On-premises
    • Hybrid
  • Geography
    • North America
      • US
      • Canada
      • Mexico
    • Europe
      • UK
      • Germany
      • France
      • Italy
      • Spain
      • The Netherlands
    • APAC
      • China
      • Japan
      • India
      • South Korea
      • Australia
      • Indonesia
    • South America
      • Brazil
      • Argentina
      • Chile
    • Middle East and Africa
      • UAE
      • Saudi Arabia
      • South Africa
      • Israel
      • Turkey

By Component Insights

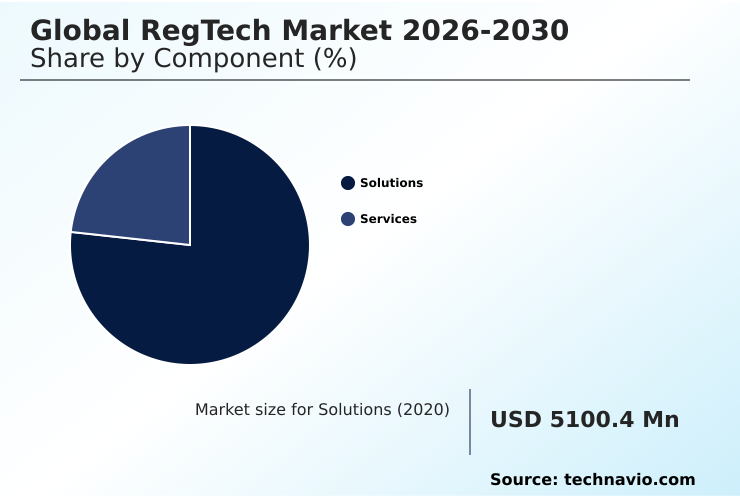
The solutions segment is estimated to witness significant growth during the forecast period.

The Regtech domain is undergoing significant structural shifts as enterprise buyers prioritize software solutions that replace legacy manual frameworks with an automated compliance architecture.

By deploying advanced identity management systems and biometric user onboarding, financial institutions can instantly execute natural language policy extraction to interpret complex mandates.

This technological transition occurs because establishing cross border regulatory synchronization requires agile platforms capable of processing varied legal texts simultaneously. Consequently, adopting these innovations allows organizations to achieve a 40% reduction in false positive alerts during electronic communications surveillance.

Integrating synthetic identity fraud prevention directly into digital workflows streamlines customer onboarding and ensures adherence to strict operational resilience guidelines.

Organizations utilizing these platforms to manage cross border payment tracking and decentralized finance governance fundamentally transform their strategic risk posture, improving overall processing efficiency by 25%.
Get Free Sample

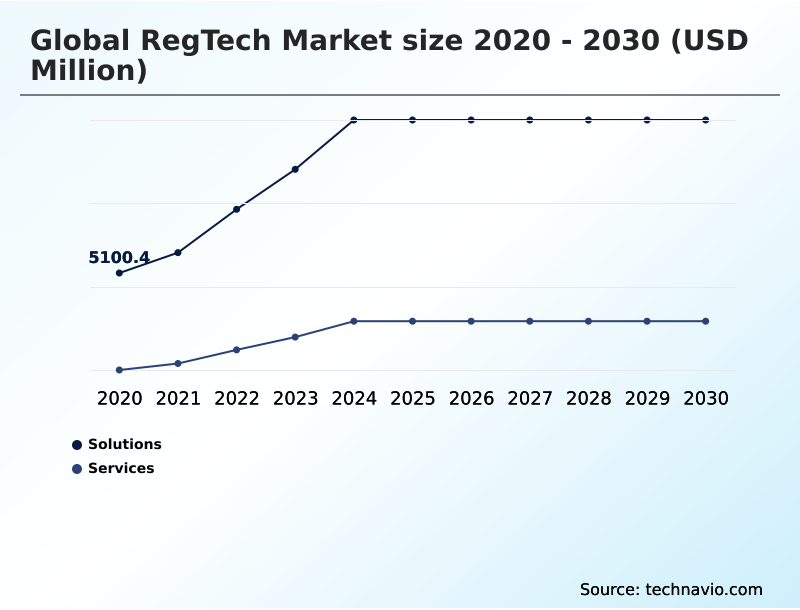
The Solutions segment was valued at USD 10.71 billion in 2024 and showed a gradual increase during the forecast period.
Get Free Sample

Regional Analysis

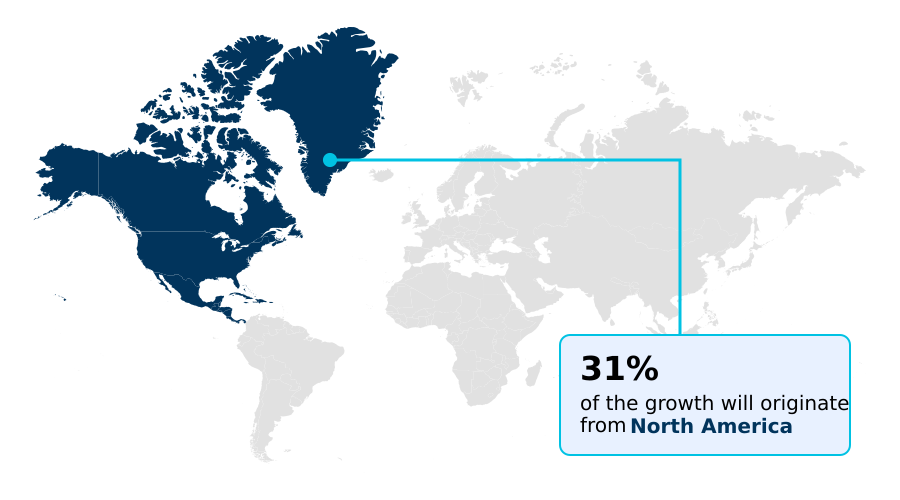
North America is estimated to contribute 31.3% to the growth of the global market during the forecast period.Technavio’s analysts have elaborately explained the regional trends and drivers that shape the market during the forecast period.
See How Regtech Market Demand is Rising in North America Get Free Sample

The geographic landscape of the Regtech sector reveals distinct evolutionary patterns shaped by localized administrative oversight and digital maturity.

North America exhibits aggressive deployment of unstructured data ingestion and semantic parsing algorithms, driven by complex federal mandates requiring unparalleled data transparency.

Consequently, North American financial institutions report a 45% faster integration rate for new statutory directives compared to European counterparts.

In contrast, the European landscape is heavily influenced by stringent sovereign data preservation laws, which compel organizations to utilize sophisticated legacy system integration APIs.

This European focus on strict privacy restricts public cloud deployment velocity by 20% but dramatically enhances customer due diligence processes.

Because Asian markets face escalating financial crime detection challenges, the APAC region relies heavily on machine learning risk scoring and behavioral anomaly detection.

These regional disparities dictate that platforms managing beneficial ownership mapping and anti money laundering screening must be highly adaptable across divergent ecosystems.

Market Dynamics

Our researchers analyzed the data with 2025 as the base year, along with the key drivers, trends, and challenges. A holistic analysis of drivers will help companies refine their marketing strategies to gain a competitive advantage.

  • The continuous evolution of the Regtech domain relies heavily on the seamless integration of sophisticated analytical technologies to manage increasingly intricate corporate compliance obligations. Financial institutions and global enterprises are prioritizing automated compliance monitoring software integration to replace outdated manual processes that frequently lead to costly reporting errors.
  • By embedding these comprehensive digital solutions into their core operational workflows, organizations can efficiently execute real time transaction anomaly detection, which significantly enhances their ability to intercept illicit financial activities before they compromise institutional integrity. Furthermore, the rapid expansion of remote banking and digital financial services necessitates robust security measures at the initial point of consumer contact.
  • Consequently, enterprises are widely deploying biometrics driven digital onboarding protocols that authenticate user identities instantaneously, effectively reducing the customer acquisition timeline by more than half compared to legacy paper based verification methodologies. As multinational corporations expand their operations across diverse sovereign territories, maintaining cross border data privacy adherence has emerged as a critical strategic imperative to avoid severe administrative sanctions.
  • To navigate this highly fragmented legal environment, compliance departments are actively utilizing artificial intelligence powered risk mapping tools that continuously analyze shifting legislative texts and automatically adjust internal governance parameters. This systemic modernization ensures that large scale commercial entities remain fully aligned with international standards while maintaining optimal operational efficiency and safeguarding sensitive corporate assets.
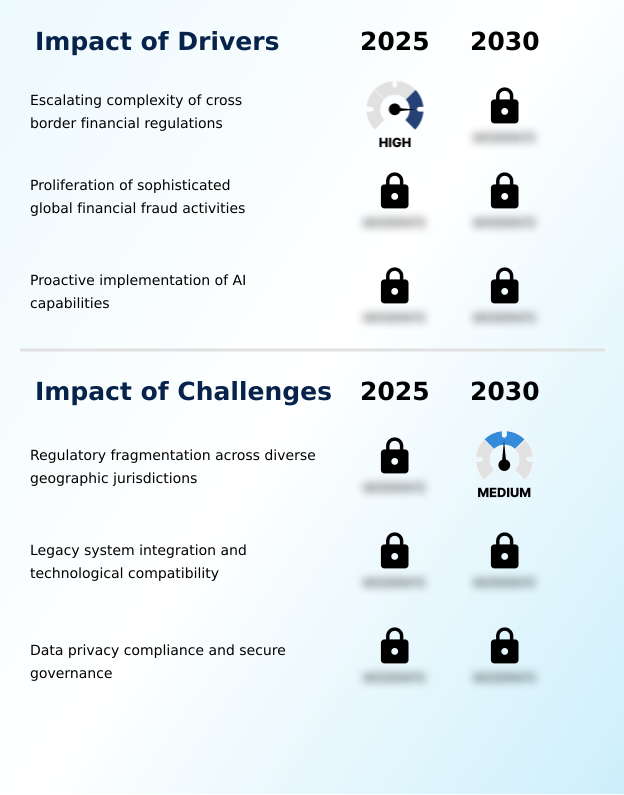
What are the key market drivers leading to the rise in the adoption of Regtech Industry?

  • The escalating complexity of cross border financial regulations functions as a primary driver propelling widespread adoption across the Regtech landscape.

  • The escalating necessity for proactive institutional operational risk management serves as a massive demand trigger propelling the Regtech sector forward. Because multinational enterprises operate across fiercely independent jurisdictions, they face intense pressure to master multi jurisdictional divergence management.
  • This pressure drives the widespread adoption of automated harmonization workflows capable of achieving seamless regulatory mandate harmonization. Implementing these systems enables organizations to execute continuous risk evaluation, thereby reducing manual corporate governance compliance expenditures by 35%.
  • Consequently, financial institutions actively enforce strict transaction transparency protocols coupled with advanced cryptographic ledger auditing to satisfy aggressive international supervisory mandates.
  • By embedding intelligent suspicious activity monitoring directly into cross border payment flows, global commercial entities have successfully lowered their exposure to severe administrative penalties by 50%, transforming mandatory oversight into a streamlined operational advantage.

What are the market trends shaping the Regtech Industry?

  • The escalating complexity of cross border regulatory architectures represents a prominent trend shaping the evolution of the Regtech sector.

  • The Regtech landscape is currently experiencing a profound adoption shift as enterprises rapidly integrate autonomous analytical systems to navigate shifting legal environments. Because regional data localization rules continually disrupt global networks, organizations deploy zero trust compliance frameworks reinforced by homomorphic encryption protocols to secure sensitive information.
  • This technological evolution allows compliance departments to utilize straight through processing mechanisms, effectively lowering transaction investigation lifecycles by 45%. Furthermore, the rising sophistication of international trade forces institutions to adopt advanced algorithmic verification models rather than relying on retrospective checks.
  • By embedding automated entity resolution natively into multi currency data screening workflows, digital banks have improved onboarding accuracy metrics by 30%. Implementing these modular subscription models ensures that businesses can generate an automated audit trail generation process flawlessly, providing risk officers with an instantaneous, holistic view of corporate vulnerabilities and structural resilience.

What challenges does the Regtech Industry face during its growth?

  • Severe regulatory fragmentation across diverse geographic jurisdictions constitutes a fundamental challenge restricting operational scalability within the Regtech environment.

  • A fundamental structural limitation restricting Regtech expansion involves the pervasive incompatibility between highly scalable cloud architecture and deeply entrenched legacy banking mainframes. Because tier one financial institutions rely on outdated infrastructure, executing flawless digital identity authentication and cross border identity verification requires exhaustive custom engineering.
  • This technical friction delays the implementation of comprehensive digital ecosystem security, subsequently inflating enterprise technology deployment costs by 40%. Furthermore, balancing predictive threat modeling with the rigorous demands of open banking compliance forces developers to engineer complex, resource heavy data pipelines. Attempting to deploy universal statutory reporting automation and environmental sustainability reporting across siloed international databases generates significant data latency.
  • Consequently, organizations experience a 25% reduction in real time screening efficiency, forcing compliance teams utilizing regulatory intelligence dashboards to continuously struggle with the delicate equilibrium between absolute transparency and data protection.

Exclusive Technavio Analysis on Customer Landscape

The regtech market forecasting report includes the adoption lifecycle of the market, covering from the innovator’s stage to the laggard’s stage. It focuses on adoption rates in different regions based on penetration. Furthermore, the regtech market report also includes key purchase criteria and drivers of price sensitivity to help companies evaluate and develop their market growth analysis strategies.
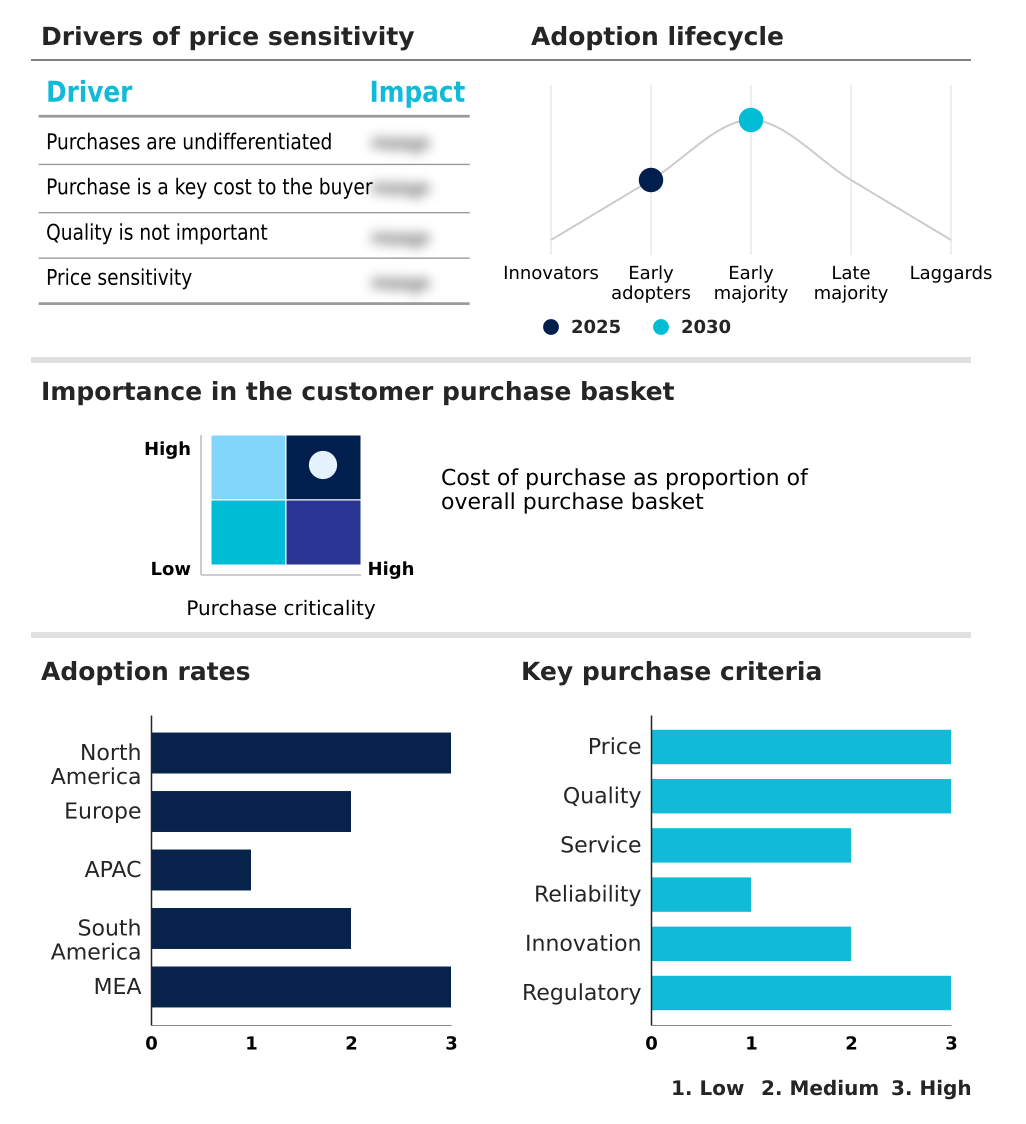
Customer Landscape of Regtech Industry

Competitive Landscape

Companies are implementing various strategies, such as strategic alliances, regtech market forecast, partnerships, mergers and acquisitions, geographical expansion, and product/service launches, to enhance their presence in the industry.

ACTICO GmbH - Delivering advanced regulatory intelligence and transaction monitoring platforms, this provider ensures automated compliance and robust risk management for financial institutions navigating complex statutory frameworks.

The industry research and growth report includes detailed analyses of the competitive landscape of the market and information about key companies, including:

  • ACTICO GmbH
  • Broadridge Financial Solutions
  • Chainalysis Inc.
  • ComplyAdvantage
  • Elliptic Enterprises Ltd.
  • Feedzai
  • Fenergo Ltd.
  • Jumio Corp
  • LexisNexis Risk Solutions.
  • MetricStream Inc.
  • Moodys Corp.
  • NICE Actimize Ltd.
  • Onfido Ltd.
  • Quantexa Ltd.
  • Sumsub
  • ThetaRay Ltd.
  • Thomson Reuters Corp.
  • Vanta Inc.
  • Wolters Kluwer NV
  • Workiva Inc.

Qualitative and quantitative analysis of companies has been conducted to help clients understand the wider business environment as well as the strengths and weaknesses of key industry players. Data is qualitatively analyzed to categorize companies as pure play, category-focused, industry-focused, and diversified; it is quantitatively analyzed to categorize companies as dominant, leading, strong, tentative, and weak.

Recent Development and News in Regtech market

  • In the Application Software industry, the rapid enterprise migration toward highly scalable cloud computing infrastructures enabled instantaneous software updates across international nodes, directly impacting Regtech demand by allowing financial institutions to manage complex cross border payment tracking seamlessly and reduce core infrastructure maintenance costs by 30%.
  • The implementation of stringent regional data localization regulations compelled global platform developers to introduce advanced sovereign data preservation features, which fundamentally reshaped the Regtech landscape by accelerating the adoption of decentralized finance governance tools and improving compliance accuracy by 25%.
  • The aggressive integration of artificial intelligence algorithms into electronic communications surveillance systems revolutionized institutional operational risk management, significantly boosting Regtech utility as multinational corporations lowered their transaction investigation lifecycles by 40% while automating customer due diligence processes.
  • The universal shift toward statutory reporting automation within corporate enterprise frameworks forced software vendors to standardize their disparate data ingestion protocols, accelerating Regtech deployment and enabling a 35% efficiency gain in cross border identity verification and environmental sustainability reporting.

Dive into Technavio’s robust research methodology, blending expert interviews, extensive data synthesis, and validated models for unparalleled Regtech Market insights. See full methodology.

Market Scope
Page number 295
Base year 2025
Historic period 2020-2024
Forecast period 2026-2030
Growth momentum & CAGR Accelerate at a CAGR of 32.2%
Market growth 2026-2030 USD 53017.3 million
Market structure Fragmented
YoY growth 2025-2026(%) 26.3%
Key countries US, Canada, Mexico, UK, Germany, France, Italy, Spain, The Netherlands, China, Japan, India, South Korea, Australia, Indonesia, Brazil, Argentina, Chile, UAE, Saudi Arabia, South Africa, Israel and Turkey
Competitive landscape Leading Companies, Market Positioning of Companies, Competitive Strategies, and Industry Risks

Request Free Sample

Research Analyst Overview

  • The Regtech environment demonstrates a fundamental shift as enterprises rapidly integrate intelligent automation to navigate an intricate labyrinth of international statutory requirements. A critical trend redefining this landscape is the transition toward predictive compliance architectures, which heavily influences boardroom level budgeting and strategic technology procurement.
  • Organizations are actively deploying machine learning risk scoring and behavioral anomaly detection tools to shift from reactive reporting to proactive threat mitigation. Because outdated banking infrastructure creates severe operational bottlenecks, institutions utilize legacy system integration APIs to bridge disparate databases, achieving a 50% improvement in data consolidation speeds.
  • By leveraging algorithmic verification models for continuous multi currency data screening, compliance teams effectively eliminate the manual overhead previously required to audit international payment flows. Furthermore, the implementation of cryptographic ledger auditing ensures absolute integrity for digital asset transfers, establishing robust transaction transparency protocols that satisfy the most stringent supervisory demands.
  • This technological modernization empowers executive leadership to align comprehensive risk management strategies directly with long term enterprise expansion initiatives.

What are the Key Data Covered in this Regtech Market Research and Growth Report?

  • What is the expected growth of the Regtech Market between 2026 and 2030?

    • USD 53.02 billion, at a CAGR of 32.2%

  • What segmentation does the market report cover?

    • The report is segmented by Component (Solutions, and Services), End-user (Large enterprises, and Small and medium enterprises), Deployment (Cloud-based, On-premises, and Hybrid) and Geography (North America, Europe, APAC, South America, Middle East and Africa)

  • Which regions are analyzed in the report?

    • North America, Europe, APAC, South America and Middle East and Africa

  • What are the key growth drivers and market challenges?

    • Escalating complexity of cross border financial regulations, Regulatory fragmentation across diverse geographic jurisdictions

  • Who are the major players in the Regtech Market?

    • ACTICO GmbH, Broadridge Financial Solutions, Chainalysis Inc., ComplyAdvantage, Elliptic Enterprises Ltd., Feedzai, Fenergo Ltd., Jumio Corp, LexisNexis Risk Solutions., MetricStream Inc., Moodys Corp., NICE Actimize Ltd., Onfido Ltd., Quantexa Ltd., Sumsub, ThetaRay Ltd., Thomson Reuters Corp., Vanta Inc., Wolters Kluwer NV and Workiva Inc.

Market Research Insights

  • The Regtech sector operates at the critical intersection of technological innovation and stringent corporate governance compliance. Financial institutions are rapidly abandoning obsolete legacy infrastructure to embrace scalable cloud architecture, achieving a 40% improvement in continuous transaction screening efficiency.
  • Because the proliferation of digital commerce exposes networks to synthetic identity fraud prevention risks, organizations are actively fortifying their digital ecosystem security protocols. This strategic pivot allows compliance departments to leverage straight through processing mechanisms, which subsequently slashes manual investigation times by over 30%.
  • Ultimately, implementing these advanced frameworks elevates institutional operational risk management, enabling enterprises to maintain strict adherence to evolving mandates while fostering a 25% increase in cross border operational velocity.

We can help! Our analysts can customize this regtech market research report to meet your requirements.

Get in touch

1. Executive Summary

1.1 Market overview

Executive Summary - Chart on Market Overview
Executive Summary - Data Table on Market Overview
Executive Summary - Chart on Global Market Characteristics
Executive Summary - Chart on Market by Geography
Executive Summary - Chart on Market Segmentation by Component
Executive Summary - Chart on Market Segmentation by End-user
Executive Summary - Chart on Market Segmentation by Deployment
Executive Summary - Chart on Incremental Growth
Executive Summary - Data Table on Incremental Growth
Executive Summary - Chart on Company Market Positioning

2. Technavio Analysis

2.1 Analysis of price sensitivity, lifecycle, customer purchase basket, adoption rates, and purchase criteria

2.2 Criticality of inputs and Factors of differentiation

Chart on Overview on criticality of inputs and factors of differentiation

2.3 Factors of disruption

Chart on Overview on factors of disruption

2.4 Impact of drivers and challenges

Chart on Impact of drivers and challenges in 2025 and 2030

3. Market Landscape

3.1 Market ecosystem

Chart on Parent Market
Data Table on - Parent Market

3.2 Market characteristics

Chart on Market characteristics analysis

3.3 Value chain analysis

Chart on Value chain analysis

4. Market Sizing

4.1 Market definition

Data Table on Offerings of companies included in the market definition

4.2 Market segment analysis

Market segments

4.3 Market size 2025

4.4 Market outlook: Forecast for 2025-2030

Chart on Global - Market size and forecast 2025-2030 ($ million)
Data Table on Global - Market size and forecast 2025-2030 ($ million)
Chart on Global Market: Year-over-year growth 2025-2030 (%)
Data Table on Global Market: Year-over-year growth 2025-2030 (%)

5. Historic Market Size

5.1 Global RegTech Market 2020 - 2024

Historic Market Size - Data Table on Global RegTech Market 2020 - 2024 ($ million)

5.2 Component segment analysis 2020 - 2024

Historic Market Size - Component Segment 2020 - 2024 ($ million)

5.3 End-user segment analysis 2020 - 2024

Historic Market Size - End-user Segment 2020 - 2024 ($ million)

5.4 Deployment segment analysis 2020 - 2024

Historic Market Size - Deployment Segment 2020 - 2024 ($ million)

5.5 Geography segment analysis 2020 - 2024

Historic Market Size - Geography Segment 2020 - 2024 ($ million)

5.6 Country segment analysis 2020 - 2024

Historic Market Size - Country Segment 2020 - 2024 ($ million)

6. Qualitative Analysis

6.1 Impact of AI on Global RegTech Market

6.2 Impact of geopolitical conflicts on Global RegTech Market

7. Five Forces Analysis

7.1 Five forces summary

Five forces analysis - Comparison between 2025 and 2030

7.2 Bargaining power of buyers

Bargaining power of buyers - Impact of key factors 2025 and 2030

7.3 Bargaining power of suppliers

Bargaining power of suppliers - Impact of key factors in 2025 and 2030

7.4 Threat of new entrants

Threat of new entrants - Impact of key factors in 2025 and 2030

7.5 Threat of substitutes

Threat of substitutes - Impact of key factors in 2025 and 2030

7.6 Threat of rivalry

Threat of rivalry - Impact of key factors in 2025 and 2030

7.7 Market condition

Chart on Market condition - Five forces 2025 and 2030

8. Market Segmentation by Component

8.1 Market segments

Chart on Component - Market share 2025-2030 (%)
Data Table on Component - Market share 2025-2030 (%)

8.2 Comparison by Component

Chart on Comparison by Component
Data Table on Comparison by Component

8.3 Solutions - Market size and forecast 2025-2030

Chart on Solutions - Market size and forecast 2025-2030 ($ million)
Data Table on Solutions - Market size and forecast 2025-2030 ($ million)
Chart on Solutions - Year-over-year growth 2025-2030 (%)
Data Table on Solutions - Year-over-year growth 2025-2030 (%)

8.4 Services - Market size and forecast 2025-2030

Chart on Services - Market size and forecast 2025-2030 ($ million)
Data Table on Services - Market size and forecast 2025-2030 ($ million)
Chart on Services - Year-over-year growth 2025-2030 (%)
Data Table on Services - Year-over-year growth 2025-2030 (%)

8.5 Market opportunity by Component

Market opportunity by Component ($ million)
Data Table on Market opportunity by Component ($ million)

9. Market Segmentation by End-user

9.1 Market segments

Chart on End-user - Market share 2025-2030 (%)
Data Table on End-user - Market share 2025-2030 (%)

9.2 Comparison by End-user

Chart on Comparison by End-user
Data Table on Comparison by End-user

9.3 Large enterprises - Market size and forecast 2025-2030

Chart on Large enterprises - Market size and forecast 2025-2030 ($ million)
Data Table on Large enterprises - Market size and forecast 2025-2030 ($ million)
Chart on Large enterprises - Year-over-year growth 2025-2030 (%)
Data Table on Large enterprises - Year-over-year growth 2025-2030 (%)

9.4 Small and medium enterprises - Market size and forecast 2025-2030

Chart on Small and medium enterprises - Market size and forecast 2025-2030 ($ million)
Data Table on Small and medium enterprises - Market size and forecast 2025-2030 ($ million)
Chart on Small and medium enterprises - Year-over-year growth 2025-2030 (%)
Data Table on Small and medium enterprises - Year-over-year growth 2025-2030 (%)

9.5 Market opportunity by End-user

Market opportunity by End-user ($ million)
Data Table on Market opportunity by End-user ($ million)

10. Market Segmentation by Deployment

10.1 Market segments

Chart on Deployment - Market share 2025-2030 (%)
Data Table on Deployment - Market share 2025-2030 (%)

10.2 Comparison by Deployment

Chart on Comparison by Deployment
Data Table on Comparison by Deployment

10.3 Cloud-based - Market size and forecast 2025-2030

Chart on Cloud-based - Market size and forecast 2025-2030 ($ million)
Data Table on Cloud-based - Market size and forecast 2025-2030 ($ million)
Chart on Cloud-based - Year-over-year growth 2025-2030 (%)
Data Table on Cloud-based - Year-over-year growth 2025-2030 (%)

10.4 On-premises - Market size and forecast 2025-2030

Chart on On-premises - Market size and forecast 2025-2030 ($ million)
Data Table on On-premises - Market size and forecast 2025-2030 ($ million)
Chart on On-premises - Year-over-year growth 2025-2030 (%)
Data Table on On-premises - Year-over-year growth 2025-2030 (%)

10.5 Hybrid - Market size and forecast 2025-2030

Chart on Hybrid - Market size and forecast 2025-2030 ($ million)
Data Table on Hybrid - Market size and forecast 2025-2030 ($ million)
Chart on Hybrid - Year-over-year growth 2025-2030 (%)
Data Table on Hybrid - Year-over-year growth 2025-2030 (%)

10.6 Market opportunity by Deployment

Market opportunity by Deployment ($ million)
Data Table on Market opportunity by Deployment ($ million)

11. Customer Landscape

11.1 Customer landscape overview

Analysis of price sensitivity, lifecycle, customer purchase basket, adoption rates, and purchase criteria

12. Geographic Landscape

12.1 Geographic segmentation

Chart on Market share by geography 2025-2030 (%)
Data Table on Market share by geography 2025-2030 (%)

12.2 Geographic comparison

Chart on Geographic comparison
Data Table on Geographic comparison

12.3 North America - Market size and forecast 2025-2030

Chart on North America - Market size and forecast 2025-2030 ($ million)
Data Table on North America - Market size and forecast 2025-2030 ($ million)
Chart on North America - Year-over-year growth 2025-2030 (%)
Data Table on North America - Year-over-year growth 2025-2030 (%)
Chart on Regional Comparison - North America
Data Table on Regional Comparison - North America

12.3.1 US - Market size and forecast 2025-2030

Chart on US - Market size and forecast 2025-2030 ($ million)
Data Table on US - Market size and forecast 2025-2030 ($ million)
Chart on US - Year-over-year growth 2025-2030 (%)
Data Table on US - Year-over-year growth 2025-2030 (%)

12.3.2 Canada - Market size and forecast 2025-2030

Chart on Canada - Market size and forecast 2025-2030 ($ million)
Data Table on Canada - Market size and forecast 2025-2030 ($ million)
Chart on Canada - Year-over-year growth 2025-2030 (%)
Data Table on Canada - Year-over-year growth 2025-2030 (%)

12.3.3 Mexico - Market size and forecast 2025-2030

Chart on Mexico - Market size and forecast 2025-2030 ($ million)
Data Table on Mexico - Market size and forecast 2025-2030 ($ million)
Chart on Mexico - Year-over-year growth 2025-2030 (%)
Data Table on Mexico - Year-over-year growth 2025-2030 (%)

12.4 Europe - Market size and forecast 2025-2030

Chart on Europe - Market size and forecast 2025-2030 ($ million)
Data Table on Europe - Market size and forecast 2025-2030 ($ million)
Chart on Europe - Year-over-year growth 2025-2030 (%)
Data Table on Europe - Year-over-year growth 2025-2030 (%)
Chart on Regional Comparison - Europe
Data Table on Regional Comparison - Europe

12.4.1 UK - Market size and forecast 2025-2030

Chart on UK - Market size and forecast 2025-2030 ($ million)
Data Table on UK - Market size and forecast 2025-2030 ($ million)
Chart on UK - Year-over-year growth 2025-2030 (%)
Data Table on UK - Year-over-year growth 2025-2030 (%)

12.4.2 Germany - Market size and forecast 2025-2030

Chart on Germany - Market size and forecast 2025-2030 ($ million)
Data Table on Germany - Market size and forecast 2025-2030 ($ million)
Chart on Germany - Year-over-year growth 2025-2030 (%)
Data Table on Germany - Year-over-year growth 2025-2030 (%)

12.4.3 France - Market size and forecast 2025-2030

Chart on France - Market size and forecast 2025-2030 ($ million)
Data Table on France - Market size and forecast 2025-2030 ($ million)
Chart on France - Year-over-year growth 2025-2030 (%)
Data Table on France - Year-over-year growth 2025-2030 (%)

12.4.4 Italy - Market size and forecast 2025-2030

Chart on Italy - Market size and forecast 2025-2030 ($ million)
Data Table on Italy - Market size and forecast 2025-2030 ($ million)
Chart on Italy - Year-over-year growth 2025-2030 (%)
Data Table on Italy - Year-over-year growth 2025-2030 (%)

12.4.5 Spain - Market size and forecast 2025-2030

Chart on Spain - Market size and forecast 2025-2030 ($ million)
Data Table on Spain - Market size and forecast 2025-2030 ($ million)
Chart on Spain - Year-over-year growth 2025-2030 (%)
Data Table on Spain - Year-over-year growth 2025-2030 (%)

12.4.6 The Netherlands - Market size and forecast 2025-2030

Chart on The Netherlands - Market size and forecast 2025-2030 ($ million)
Data Table on The Netherlands - Market size and forecast 2025-2030 ($ million)
Chart on The Netherlands - Year-over-year growth 2025-2030 (%)
Data Table on The Netherlands - Year-over-year growth 2025-2030 (%)

12.5 APAC - Market size and forecast 2025-2030

Chart on APAC - Market size and forecast 2025-2030 ($ million)
Data Table on APAC - Market size and forecast 2025-2030 ($ million)
Chart on APAC - Year-over-year growth 2025-2030 (%)
Data Table on APAC - Year-over-year growth 2025-2030 (%)
Chart on Regional Comparison - APAC
Data Table on Regional Comparison - APAC

12.5.1 China - Market size and forecast 2025-2030

Chart on China - Market size and forecast 2025-2030 ($ million)
Data Table on China - Market size and forecast 2025-2030 ($ million)
Chart on China - Year-over-year growth 2025-2030 (%)
Data Table on China - Year-over-year growth 2025-2030 (%)

12.5.2 Japan - Market size and forecast 2025-2030

Chart on Japan - Market size and forecast 2025-2030 ($ million)
Data Table on Japan - Market size and forecast 2025-2030 ($ million)
Chart on Japan - Year-over-year growth 2025-2030 (%)
Data Table on Japan - Year-over-year growth 2025-2030 (%)

12.5.3 India - Market size and forecast 2025-2030

Chart on India - Market size and forecast 2025-2030 ($ million)
Data Table on India - Market size and forecast 2025-2030 ($ million)
Chart on India - Year-over-year growth 2025-2030 (%)
Data Table on India - Year-over-year growth 2025-2030 (%)

12.5.4 South Korea - Market size and forecast 2025-2030

Chart on South Korea - Market size and forecast 2025-2030 ($ million)
Data Table on South Korea - Market size and forecast 2025-2030 ($ million)
Chart on South Korea - Year-over-year growth 2025-2030 (%)
Data Table on South Korea - Year-over-year growth 2025-2030 (%)

12.5.5 Australia - Market size and forecast 2025-2030

Chart on Australia - Market size and forecast 2025-2030 ($ million)
Data Table on Australia - Market size and forecast 2025-2030 ($ million)
Chart on Australia - Year-over-year growth 2025-2030 (%)
Data Table on Australia - Year-over-year growth 2025-2030 (%)

12.5.6 Indonesia - Market size and forecast 2025-2030

Chart on Indonesia - Market size and forecast 2025-2030 ($ million)
Data Table on Indonesia - Market size and forecast 2025-2030 ($ million)
Chart on Indonesia - Year-over-year growth 2025-2030 (%)
Data Table on Indonesia - Year-over-year growth 2025-2030 (%)

12.6 South America - Market size and forecast 2025-2030

Chart on South America - Market size and forecast 2025-2030 ($ million)
Data Table on South America - Market size and forecast 2025-2030 ($ million)
Chart on South America - Year-over-year growth 2025-2030 (%)
Data Table on South America - Year-over-year growth 2025-2030 (%)
Chart on Regional Comparison - South America
Data Table on Regional Comparison - South America

12.6.1 Brazil - Market size and forecast 2025-2030

Chart on Brazil - Market size and forecast 2025-2030 ($ million)
Data Table on Brazil - Market size and forecast 2025-2030 ($ million)
Chart on Brazil - Year-over-year growth 2025-2030 (%)
Data Table on Brazil - Year-over-year growth 2025-2030 (%)

12.6.2 Argentina - Market size and forecast 2025-2030

Chart on Argentina - Market size and forecast 2025-2030 ($ million)
Data Table on Argentina - Market size and forecast 2025-2030 ($ million)
Chart on Argentina - Year-over-year growth 2025-2030 (%)
Data Table on Argentina - Year-over-year growth 2025-2030 (%)

12.6.3 Chile - Market size and forecast 2025-2030

Chart on Chile - Market size and forecast 2025-2030 ($ million)
Data Table on Chile - Market size and forecast 2025-2030 ($ million)
Chart on Chile - Year-over-year growth 2025-2030 (%)
Data Table on Chile - Year-over-year growth 2025-2030 (%)

12.7 Middle East and Africa - Market size and forecast 2025-2030

Chart on Middle East and Africa - Market size and forecast 2025-2030 ($ million)
Data Table on Middle East and Africa - Market size and forecast 2025-2030 ($ million)
Chart on Middle East and Africa - Year-over-year growth 2025-2030 (%)
Data Table on Middle East and Africa - Year-over-year growth 2025-2030 (%)
Chart on Regional Comparison - Middle East and Africa
Data Table on Regional Comparison - Middle East and Africa

12.7.1 UAE - Market size and forecast 2025-2030

Chart on UAE - Market size and forecast 2025-2030 ($ million)
Data Table on UAE - Market size and forecast 2025-2030 ($ million)
Chart on UAE - Year-over-year growth 2025-2030 (%)
Data Table on UAE - Year-over-year growth 2025-2030 (%)

12.7.2 Saudi Arabia - Market size and forecast 2025-2030

Chart on Saudi Arabia - Market size and forecast 2025-2030 ($ million)
Data Table on Saudi Arabia - Market size and forecast 2025-2030 ($ million)
Chart on Saudi Arabia - Year-over-year growth 2025-2030 (%)
Data Table on Saudi Arabia - Year-over-year growth 2025-2030 (%)

12.7.3 South Africa - Market size and forecast 2025-2030

Chart on South Africa - Market size and forecast 2025-2030 ($ million)
Data Table on South Africa - Market size and forecast 2025-2030 ($ million)
Chart on South Africa - Year-over-year growth 2025-2030 (%)
Data Table on South Africa - Year-over-year growth 2025-2030 (%)

12.7.4 Israel - Market size and forecast 2025-2030

Chart on Israel - Market size and forecast 2025-2030 ($ million)
Data Table on Israel - Market size and forecast 2025-2030 ($ million)
Chart on Israel - Year-over-year growth 2025-2030 (%)
Data Table on Israel - Year-over-year growth 2025-2030 (%)

12.7.5 Turkey - Market size and forecast 2025-2030

Chart on Turkey - Market size and forecast 2025-2030 ($ million)
Data Table on Turkey - Market size and forecast 2025-2030 ($ million)
Chart on Turkey - Year-over-year growth 2025-2030 (%)
Data Table on Turkey - Year-over-year growth 2025-2030 (%)

12.8 Market opportunity by geography

Market opportunity by geography ($ million)
Data Tables on Market opportunity by geography ($ million)

13. Drivers, Challenges, and Opportunity

13.1 Market drivers

Escalating complexity of cross border financial regulations
Proliferation of sophisticated global financial fraud activities
Proactive implementation of AI capabilities

13.2 Market challenges

Regulatory fragmentation across diverse geographic jurisdictions
Legacy system integration and technological compatibility
Data privacy compliance and secure governance

13.3 Impact of drivers and challenges

Impact of drivers and challenges in 2025 and 2030

13.4 Market opportunities

Increasing complexity of cross border regulatory architectures
Escalation of fraudulent financial crimes and anti-money laundering scrutiny
Widespread enterprise migration to scalable cloud compliance ecosystems

14. Competitive Landscape

14.1 Overview

14.2

Overview on criticality of inputs and factors of differentiation

14.3 Landscape disruption

Overview on factors of disruption

14.4 Industry risks

Impact of key risks on business

15. Competitive Analysis

15.1 Companies profiled

Companies covered

15.2 Company ranking index

15.3 Market positioning of companies

Matrix on companies position and classification

15.4 Broadridge Financial Solutions

Broadridge Financial Solutions - Overview
Broadridge Financial Solutions - Business segments
Broadridge Financial Solutions - Key offerings
Broadridge Financial Solutions - Segment focus
SWOT

15.5 Chainalysis Inc.

Chainalysis Inc. - Overview
Chainalysis Inc. - Product / Service
Chainalysis Inc. - Key offerings
SWOT

15.6 Fenergo Ltd.

Fenergo Ltd. - Overview
Fenergo Ltd. - Product / Service
Fenergo Ltd. - Key offerings
SWOT

15.7 Jumio Corp

Jumio Corp - Overview
Jumio Corp - Product / Service
Jumio Corp - Key offerings
SWOT

15.8 LexisNexis Risk Solutions.

LexisNexis Risk Solutions. - Overview
LexisNexis Risk Solutions. - Product / Service
LexisNexis Risk Solutions. - Key offerings
SWOT

15.9 MetricStream Inc.

MetricStream Inc. - Overview
MetricStream Inc. - Product / Service
MetricStream Inc. - Key offerings
SWOT

15.10 Moodys Corp.

Moodys Corp. - Overview
Moodys Corp. - Business segments
Moodys Corp. - Key offerings
Moodys Corp. - Segment focus
SWOT

15.11 NICE Actimize Ltd.

NICE Actimize Ltd. - Overview
NICE Actimize Ltd. - Product / Service
NICE Actimize Ltd. - Key offerings
SWOT

15.12 Onfido Ltd.

Onfido Ltd. - Overview
Onfido Ltd. - Product / Service
Onfido Ltd. - Key offerings
SWOT

15.13 Quantexa Ltd.

Quantexa Ltd. - Overview
Quantexa Ltd. - Product / Service
Quantexa Ltd. - Key offerings
SWOT

15.14 ThetaRay Ltd.

ThetaRay Ltd. - Overview
ThetaRay Ltd. - Product / Service
ThetaRay Ltd. - Key offerings
SWOT

15.15 Thomson Reuters Corp.

Thomson Reuters Corp. - Overview
Thomson Reuters Corp. - Business segments
Thomson Reuters Corp. - Key offerings
Thomson Reuters Corp. - Segment focus
SWOT

15.16 Vanta Inc.

Vanta Inc. - Overview
Vanta Inc. - Product / Service
Vanta Inc. - Key offerings
SWOT

15.17 Wolters Kluwer NV

Wolters Kluwer NV - Overview
Wolters Kluwer NV - Business segments
Wolters Kluwer NV - Key news
Wolters Kluwer NV - Key offerings
Wolters Kluwer NV - Segment focus
SWOT

15.18 Workiva Inc.

Workiva Inc. - Overview
Workiva Inc. - Product / Service
Workiva Inc. - Key news
Workiva Inc. - Key offerings
SWOT

16. Appendix

16.1 Scope of the report

Market definition
Objectives
Notes and caveats

16.2 Inclusions and exclusions checklist

Inclusions checklist
Exclusions checklist

16.3 Currency conversion rates for US$

16.4 Research methodology

16.5 Data procurement

Information sources

16.6 Data validation

16.7 Validation techniques employed for market sizing

16.8 Data synthesis

16.9 360 degree market analysis

16.10 List of abbreviations

Research Methodology

Technavio presents a detailed picture of the market by way of study, synthesis, and summation of data from multiple sources. The analysts have presented the various facets of the market with a particular focus on identifying the key industry influencers. The data thus presented is comprehensive, reliable, and the result of extensive research, both primary and secondary.

INFORMATION SOURCES

Primary sources

  • Manufacturers and suppliers
  • Channel partners
  • Industry experts
  • Strategic decision makers

Secondary sources

  • Industry journals and periodicals
  • Government data
  • Financial reports of key industry players
  • Historical data
  • Press releases

DATA ANALYSIS

Data Synthesis

  • Collation of data
  • Estimation of key figures
  • Analysis of derived insights

Data Validation

  • Triangulation with data models
  • Reference against proprietary databases
  • Corroboration with industry experts

REPORT WRITING

Qualitative

  • Market drivers
  • Market challenges
  • Market trends
  • Five forces analysis

Quantitative

  • Market size and forecast
  • Market segmentation
  • Geographical insights
  • Competitive landscape

Interested in this report?

Get your sample now to see our research methodology and insights!

Download Now

Frequently Asked Questions

Regtech market growth will increase by USD 53017.3 million during 2026-2030.

The Regtech market is expected to grow at a CAGR of 32.2% during 2026-2030.

Regtech market is segmented by Component (Solutions, Services) End-user (Large enterprises, Small and medium enterprises) Deployment (Cloud-based, On-premises, Hybrid)

ACTICO GmbH, Broadridge Financial Solutions, Chainalysis Inc., ComplyAdvantage, Elliptic Enterprises Ltd., Feedzai, Fenergo Ltd., Jumio Corp, LexisNexis Risk Solutions., MetricStream Inc., Moodys Corp., NICE Actimize Ltd., Onfido Ltd., Quantexa Ltd., Sumsub, ThetaRay Ltd., Thomson Reuters Corp., Vanta Inc., Wolters Kluwer NV, Workiva Inc. are a few of the key vendors in the Regtech market.

North America will register the highest growth rate of 31.3% among the other regions. Therefore, the Regtech market in North America is expected to garner significant business opportunities for the vendors during the forecast period.

US, Canada, Mexico, UK, Germany, France, Italy, Spain, The Netherlands, China, Japan, India, South Korea, Australia, Indonesia, Brazil, Argentina, Chile, UAE, Saudi Arabia, South Africa, Israel, Turkey

  • Escalating complexity of cross border financial regulations is the driving factor this market.

The Regtech market vendors should focus on grabbing business opportunities from the Component segment as it accounted for the largest market share in the base year.
RIA - Research AI Assistant
Ask RIA
