Renewable Fuel Market Analysis North America, Europe, APAC, South America, Middle East and Africa - US, China, Germany, UK, France, Australia - Size and Forecast 2024-2028

Renewable Fuel Market Analysis North America, Europe, APAC, South America, Middle East and Africa - US, China, Germany, UK, France, Australia - Size and Forecast 2024-2028

Published: Jul 2024 217 Pages SKU: IRTNTR80044

Market Overview at a Glance

$66.7 Mn
Market Opportunity
7.13%
CAGR
6.29
YoY growth 2023-2024(%)

Renewable Fuel Market Size 2024-2028

The renewable fuel market size is forecast to increase by USD 66.7 million, at a CAGR of 7.13% between 2023 and 2028.

  • The market is experiencing significant growth due to several key trends. One of the major factors driving market expansion is the increasing adoption of waste-to-energy technologies. These technologies convert waste materials into fuel, reducing the reliance on traditional fossil fuels and addressing environmental concerns. Another trend is the development of e-fuels, which are produced from renewable sources such as water, air, and sunlight. Renewable fuels, derived from biomass, solar, and hydro sources, are increasingly replacing fossil fuels in power generation and transportation applications. However, the inconsistent availability and quality of feedstocks for renewable fuels pose challenges to market growth. Producers must address these issues through advancements in technology and sustainable farming practices to ensure a steady supply of high-quality feedstocks. Overall, the market is poised for continued growth as the world transitions towards more sustainable energy sources.

What will be the Size of the Renewable Fuel Market During the Forecast Period?

Renewable Fuel Market Size

 Request Free Sample

  • The market encompasses various sectors, including solar, hydropower, windpower, biofuels, and hydrogen fuels. This market is experiencing significant growth as the global shift towards net-zero carbon emissions intensifies. Biofuels, such as biodiesel, biogasoline, ethanol, and pyrolysis oil, are derived from feedstocks like municipal waste, landfills, and agricultural residues. The market is driven by the need to reduce greenhouse gas emissions, improve energy security, and decrease the carbon footprint of automobile production and transportation mediums. Additionally, the market is expanding into sectors like marine, cooling & heating, and electricity generation. The market's size and direction reflect the global energy transition towards sustainable, renewable sources.

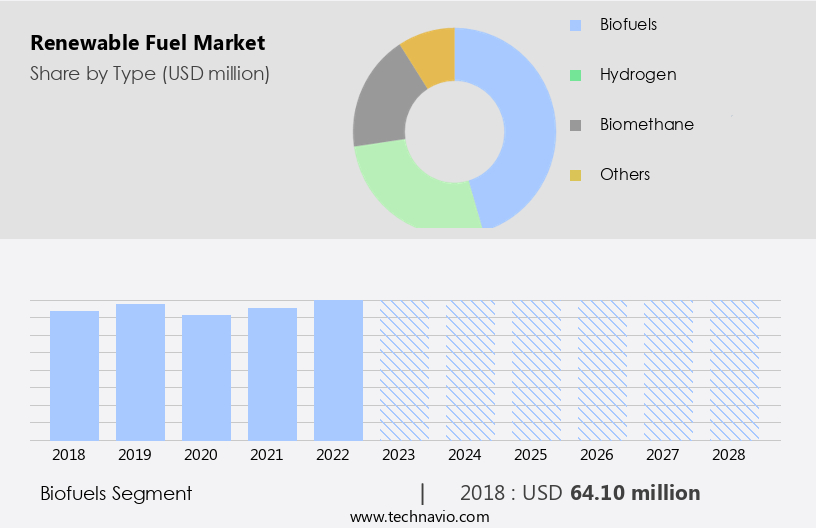
How is the Renewable Fuel Industry segmented and which is the largest segment?

The renewable fuel industry research report provides comprehensive data (region-wise segment analysis), with forecasts and estimates in "USD million" for the period 2024-2028, as well as historical data from 2018-2022 for the following segments.

  • Type
    • Biofuels
    • Hydrogen
    • Biomethane
    • Others
  • End-user
    • Road transporation
    • Avaition
    • Marine
    • Residential
    • Others
  • Geography
    • North America
      • US
    • Europe
      • Germany
      • UK
      • France
    • APAC
      • China
    • South America
    • Middle East and Africa

By Type Insights

  • The biofuels segment is estimated to witness significant growth during the forecast period.

Biofuels, including solar-derived bioethanol, hydropower-generated biomass fuel, windpower-produced biogasoline, and ethanol from corn, soybeans, cassava, sugar beets, sugar cane, and cereal crops, offer lower greenhouse gas emissions compared to fossil fuels. These renewable sources contribute to long-term sustainability and lessen reliance on finite resources. Biofuels reduce emissions of harmful pollutants like sulfur oxides (SOx) and particulate matter, improving air quality. Derived from agricultural residues and waste materials, they help manage and recycle organic waste. Biofuels provide an alternative to fossil fuels, enhancing energy security by diversifying energy sources and reducing dependence on imported oil. Locally produced biofuels from regional feedstocks reduce transportation costs and boost local economies.

Incorporating feedstocks from municipal waste and landfills further supports waste management and circular economy principles. Biofuels, such as biodiesel from soybean, canola oil, animal fat, and distillers corn, provide sustainable solutions for automobile production, power generation, transportation, marine, aerospace, locomotive, heat engines, fuel cells, vehicles, power generators, pipeline transport, and cooling & heating industries. Capital investment in renewable biofuels, including geothermal, wind, and hydrogen fuels, supports the energy transition towards net-zero carbon emissions.

Renewable Fuel Market Size

Get a glance at the market report of the share of various segments Request Free Sample

The biofuels segment was valued at USD 64.10 million in 2018 and showed a gradual increase during the forecast period.

Regional Analysis

  • North America is estimated to contribute 37% to the growth of the global market during the forecast period.

Technavio's analysts have elaborately explained the regional trends and drivers that shape the market during the forecast period.

Renewable Fuel Market Share by Geography

For more insights on the market size of various regions, Request Free Sample

Renewable fuels are gaining momentum in North America due to increasing commitments to reduce greenhouse gas emissions and growing consumer awareness about environmental sustainability. The Paris Agreement and Renewable Portfolio Standards or renewable energy Standards are driving the demand for renewable fuels, with policies mandating the use of renewable energy. Carbon pricing mechanisms, such as cap-and-trade systems and carbon taxes, provide financial incentives for adopting renewable fuels by increasing the cost of fossil fuels. The market in North America is experiencing significant investment from both government and private sectors, with technologies in solar, hydropower, windpower, biofuels, biogasoline, ethanol, electricity, and others advancing.

Feedstocks, including corn, soybeans, cassava, sugar beets, sugar cane, cereal crops, municipal waste, and landfills, are being utilized to produce renewable fuels. The power generation, transportation, marine, aerospace, locomotive, heat engines, fuel cells, vehicles, power generators, pipeline transport, and cooling & heating sectors are transitioning towards renewable fuels to reduce their carbon footprint and improve energy security. Capital investment in renewable energy technologies, including geothermal, wind, and hydrogen fuels, is also increasing.

Market Dynamics

Our researchers analyzed the data with 2023 as the base year, along with the key drivers, trends, and challenges. A holistic analysis of drivers will help companies refine their marketing strategies to gain a competitive advantage.

What are the key market drivers leading to the rise In the adoption of Renewable Fuel Industry?

Rising adoption of Waste-to-Energy Technologies is the key driver of the market.

  • The rising adoption of Waste-to-Energy technologies is a key driver in the growth of the global renewable fuel market. These technologies convert various types of waste materials, such as food scraps and agricultural residues, into usable energy, including electricity, heat, and fuels through methods like anaerobic digestion, incineration, gasification, pyrolysis, and fermentation. The conversion of organic waste into biogas, syngas, bio-oil, and other fuels helps reduce greenhouse gas emissions and provides a renewable energy source. Innovations such as Eni Rewind's Waste to Fuel (W2F) technology, which transforms organic waste into biofuels, are also contributing to sustainable waste management and energy recovery, thus supporting energy diversity and sustainability goals.

What are the market trends shaping the Renewable Fuel Industry?

Development of e-fuels is the upcoming market trend.

  • The development of e-fuels is gaining momentum as an innovative trend in the renewable fuel sector. E-fuels are synthetic fuels produced from renewable electricity through processes such as Power-to-Liquids (PtL) and Power-to-Gas (PtG), using hydrogen and CO2 to create hydrocarbons. E-fuels provide a carbon-neutral solution if the CO2 is captured from the atmosphere, making them ideal for sectors that are hard to electrify, such as aviation and shipping. The integration of e-fuels into existing infrastructure and their drop-in nature are fueling the transition towards cleaner, renewable fuels.

What challenges does the Renewable Fuel Industry face during its growth?

Inconsistent availability and quality of feedstocks for renewable fuel is a key challenge affecting the industry's growth.

  • One of the significant challenges facing the renewable fuel sector is the inconsistent availability and quality of feedstocks. The conversion of waste into energy heavily relies on a steady and reliable supply of organic materials, and variations in feedstock quality can impact the efficiency of energy production. This inconsistency can hinder the scalability and economic viability of Waste-to-Energy technologies, slowing down their widespread adoption. As the market moves forward, securing sustainable and high-quality feedstock will be essential to overcoming this barrier.

Exclusive Customer Landscape

The renewable fuel market forecasting report includes the adoption lifecycle of the market, covering from the innovator's stage to the laggard's stage. It focuses on adoption rates in different regions based on penetration. Furthermore, the renewable fuel market report also includes key purchase criteria and drivers of price sensitivity to help companies evaluate and develop their market growth analysis strategies.

Renewable Fuel Market Share by Geography

 Customer Landscape

Key Companies & Market Insights

Companies are implementing various strategies, such as strategic alliances, renewable fuel market forecast, partnerships, mergers and acquisitions, geographical expansion, and product/service launches, to enhance their presence in the industry.

The industry research and growth report includes detailed analyses of the competitive landscape of the market and information about key companies, including:

  • Aemetis Inc.
  • ALTO INGREDIENTS Inc.
  • Archer Daniels Midland Co.
  • BP Plc
  • Bunge Ltd.
  • Cargill Inc.
  • Chevron Corp.
  • Clariant AG
  • Cox Energy SAB de CV
  • Eni SpA
  • Enviva Inc.
  • Green Plains Inc.
  • INEOS AG
  • Louis Dreyfus Co. BV
  • Neste Corp.
  • Novozymes AS
  • POET LLC
  • Shell plc
  • Suncor Energy Inc.
  • TotalEnergies SE
  • Valero Energy Corp.

Qualitative and quantitative analysis of companies has been conducted to help clients understand the wider business environment as well as the strengths and weaknesses of key industry players. Data is qualitatively analyzed to categorize companies as pure play, category-focused, industry-focused, and diversified; it is quantitatively analyzed to categorize companies as dominant, leading, strong, tentative, and weak.

Research Analyst Overview

Renewable fuels have emerged as a significant alternative to traditional fossil fuels in various sectors, including power generation, transportation, and automobile production. Renewable fuels, such as solar, hydropower, windpower, biofuels, biomass, pyrolysis oil, hydrogen fuels, and electricity, offer numerous benefits, including reduced greenhouse gas emissions and improved energy security. Biofuels, derived from feedstocks like corn, soybeans, cassava, sugar beets, sugar cane, and cereal crops, have gained popularity as a renewable alternative to fossil fuels In the transportation sector. These fuels, including biodiesel, biogasoline, and ethanol, offer significant reductions in carbon footprint compared to their fossil fuel counterparts. The power generation sector has also seen a shift towards renewable fuels, with wind energy, both onshore and offshore, and solar energy becoming increasingly prevalent.

Hydroelectric power, another renewable energy source, continues to be a significant contributor to the power sector. Geothermal energy is another renewable source gaining traction in the power industry. Fuel cells, which convert chemical energy into electricity, offer another avenue for renewable fuel adoption. Hydrogen fuels, produced from renewable sources, can be used in fuel cells to generate electricity. This technology holds significant potential for the transportation sector, particularly in the aviation industry. The marine sector is also exploring renewable fuel options, with biofuels and hydrogen fuels being considered as alternatives to traditional marine fuels. The use of renewable fuels in the marine sector can help reduce greenhouse gas emissions and improve energy security.

In addition, the adoption of renewable fuels is driven by various factors, including the need to reduce greenhouse gas emissions, energy security concerns, and the transition towards a low-carbon economy. Capital investment in renewable fuel production and infrastructure is a key driver of market growth. The use of renewable fuels In the transportation sector is also influenced by factors such as labor and land costs, feedstock availability, and agricultural subsidizations. The oil market, which has traditionally dominated the transportation fuel market, is facing increasing competition from renewable fuels. Renewable fuels offer numerous benefits, including reduced greenhouse gas emissions, improved energy security, and a smaller carbon footprint.

Market Scope

Report Coverage

Details

Page number

217

Base year

2023

Historic period

2018-2022

Forecast period

2024-2028

Growth momentum & CAGR

Accelerate at a CAGR of 7.13%

Market growth 2024-2028

USD 66.7 million

Market structure

Fragmented

YoY growth 2023-2024(%)

6.29

Key countries

US, China, Germany, UK, France, and Australia

Competitive landscape

Leading Companies, Market Positioning of Companies, Competitive Strategies, and Industry Risks

Request Free Sample

What are the Key Data Covered in this Renewable Fuel Market Research and Growth Report?

  • CAGR of the Renewable Fuel industry during the forecast period
  • Detailed information on factors that will drive the market growth and forecasting between 2024 and 2028
  • Precise estimation of the size of the market and its contribution of the industry in focus to the parent market
  • Accurate predictions about upcoming growth and trends and changes in consumer behaviour
  • Growth of the market across North America, Europe, APAC, South America, and Middle East and Africa
  • Thorough analysis of the market's competitive landscape and detailed information about companies
  • Comprehensive analysis of factors that will challenge the renewable fuel market growth of industry companies

We can help! Our analysts can customize this renewable fuel market research report to meet your requirements.

Get in touch

1 Executive Summary

  • 1.1 Market overview
    • Executive Summary - Chart on Market Overview
    • Executive Summary - Data Table on Market Overview
    • Executive Summary - Chart on Global Market Characteristics
    • Executive Summary - Chart on Market by Geography
    • Executive Summary - Chart on Market Segmentation by Type
    • Executive Summary - Chart on Market Segmentation by End-user
    • Executive Summary - Chart on Incremental Growth
    • Executive Summary - Data Table on Incremental Growth
    • Executive Summary - Chart on Company Market Positioning

2 Technavio Analysis

  • 2.1 Analysis of price sensitivity, lifecycle, customer purchase basket, adoption rates, and purchase criteria
    • Analysis of price sensitivity, lifecycle, customer purchase basket, adoption rates, and purchase criteria
  • 2.2 Criticality of inputs and Factors of differentiation
    • Overview on criticality of inputs and factors of differentiation
  • 2.3 Factors of disruption
    • Overview on factors of disruption
  • 2.4 Impact of drivers and challenges
    • Impact of drivers and challenges in 2023 and 2028

3 Market Landscape

  • 3.1 Market ecosystem
    • Parent Market
    • Data Table on - Parent Market
  • 3.2 Market characteristics
    • Market characteristics analysis
  • 3.3 Value chain analysis
    • Value Chain Analysis

4 Market Sizing

  • 4.1 Market definition
    • Offerings of companies included in the market definition
  • 4.2 Market segment analysis
    • Market segments
  • 4.3 Market size 2023
    • 4.4 Market outlook: Forecast for 2023-2028
      • Chart on Global - Market size and forecast 2023-2028 ($ million)
      • Data Table on Global - Market size and forecast 2023-2028 ($ million)
      • Chart on Global Market: Year-over-year growth 2023-2028 (%)
      • Data Table on Global Market: Year-over-year growth 2023-2028 (%)

    5 Historic Market Size

    • 5.1 Global Renewable Fuel Market 2018 - 2022
      • Historic Market Size - Data Table on Global Renewable Fuel Market 2018 - 2022 ($ million)
    • 5.2 Type segment analysis 2018 - 2022
      • Historic Market Size - Type Segment 2018 - 2022 ($ million)
    • 5.3 End-user segment analysis 2018 - 2022
      • Historic Market Size - End-user Segment 2018 - 2022 ($ million)
    • 5.4 Geography segment analysis 2018 - 2022
      • Historic Market Size - Geography Segment 2018 - 2022 ($ million)
    • 5.5 Country segment analysis 2018 - 2022
      • Historic Market Size - Country Segment 2018 - 2022 ($ million)

    6 Additional Value/Volume Data

    • 6.1 Global renewable fuel market by country 2023 - 2028 ($ million)
      • Market Size (value) - Data Table on Global renewable fuel market by Country 2023 - 2028 ($ million)

    7 Five Forces Analysis

    • 7.1 Five forces summary
      • Five forces analysis - Comparison between 2023 and 2028
    • 7.2 Bargaining power of buyers
      • Bargaining power of buyers - Impact of key factors 2023 and 2028
    • 7.3 Bargaining power of suppliers
      • Bargaining power of suppliers - Impact of key factors in 2023 and 2028
    • 7.4 Threat of new entrants
      • Threat of new entrants - Impact of key factors in 2023 and 2028
    • 7.5 Threat of substitutes
      • Threat of substitutes - Impact of key factors in 2023 and 2028
    • 7.6 Threat of rivalry
      • Threat of rivalry - Impact of key factors in 2023 and 2028
    • 7.7 Market condition
      • Chart on Market condition - Five forces 2023 and 2028

    8 Market Segmentation by Type

    • 8.1 Market segments
      • Chart on Type - Market share 2023-2028 (%)
      • Data Table on Type - Market share 2023-2028 (%)
    • 8.2 Comparison by Type
      • Chart on Comparison by Type
      • Data Table on Comparison by Type
    • 8.3 Biofuels - Market size and forecast 2023-2028
      • Chart on Biofuels - Market size and forecast 2023-2028 ($ million)
      • Data Table on Biofuels - Market size and forecast 2023-2028 ($ million)
      • Chart on Biofuels - Year-over-year growth 2023-2028 (%)
      • Data Table on Biofuels - Year-over-year growth 2023-2028 (%)
    • 8.4 Hydrogen - Market size and forecast 2023-2028
      • Chart on Hydrogen - Market size and forecast 2023-2028 ($ million)
      • Data Table on Hydrogen - Market size and forecast 2023-2028 ($ million)
      • Chart on Hydrogen - Year-over-year growth 2023-2028 (%)
      • Data Table on Hydrogen - Year-over-year growth 2023-2028 (%)
    • 8.5 Biomethane - Market size and forecast 2023-2028
      • Chart on Biomethane - Market size and forecast 2023-2028 ($ million)
      • Data Table on Biomethane - Market size and forecast 2023-2028 ($ million)
      • Chart on Biomethane - Year-over-year growth 2023-2028 (%)
      • Data Table on Biomethane - Year-over-year growth 2023-2028 (%)
    • 8.6 Others - Market size and forecast 2023-2028
      • Chart on Others - Market size and forecast 2023-2028 ($ million)
      • Data Table on Others - Market size and forecast 2023-2028 ($ million)
      • Chart on Others - Year-over-year growth 2023-2028 (%)
      • Data Table on Others - Year-over-year growth 2023-2028 (%)
    • 8.7 Market opportunity by Type
      • Market opportunity by Type ($ million)
      • Data Table on Market opportunity by Type ($ million)

    9 Market Segmentation by End-user

    • 9.1 Market segments
      • Chart on End-user - Market share 2023-2028 (%)
      • Data Table on End-user - Market share 2023-2028 (%)
    • 9.2 Comparison by End-user
      • Chart on Comparison by End-user
      • Data Table on Comparison by End-user
    • 9.3 Road transporation - Market size and forecast 2023-2028
      • Chart on Road transporation - Market size and forecast 2023-2028 ($ million)
      • Data Table on Road transporation - Market size and forecast 2023-2028 ($ million)
      • Chart on Road transporation - Year-over-year growth 2023-2028 (%)
      • Data Table on Road transporation - Year-over-year growth 2023-2028 (%)
    • 9.4 Avaition - Market size and forecast 2023-2028
      • Chart on Avaition - Market size and forecast 2023-2028 ($ million)
      • Data Table on Avaition - Market size and forecast 2023-2028 ($ million)
      • Chart on Avaition - Year-over-year growth 2023-2028 (%)
      • Data Table on Avaition - Year-over-year growth 2023-2028 (%)
    • 9.5 Marine - Market size and forecast 2023-2028
      • Chart on Marine - Market size and forecast 2023-2028 ($ million)
      • Data Table on Marine - Market size and forecast 2023-2028 ($ million)
      • Chart on Marine - Year-over-year growth 2023-2028 (%)
      • Data Table on Marine - Year-over-year growth 2023-2028 (%)
    • 9.6 Residential - Market size and forecast 2023-2028
      • Chart on Residential - Market size and forecast 2023-2028 ($ million)
      • Data Table on Residential - Market size and forecast 2023-2028 ($ million)
      • Chart on Residential - Year-over-year growth 2023-2028 (%)
      • Data Table on Residential - Year-over-year growth 2023-2028 (%)
    • 9.7 Others - Market size and forecast 2023-2028
      • Chart on Others - Market size and forecast 2023-2028 ($ million)
      • Data Table on Others - Market size and forecast 2023-2028 ($ million)
      • Chart on Others - Year-over-year growth 2023-2028 (%)
      • Data Table on Others - Year-over-year growth 2023-2028 (%)
    • 9.8 Market opportunity by End-user
      • Market opportunity by End-user ($ million)
      • Data Table on Market opportunity by End-user ($ million)

    10 Customer Landscape

    • 10.1 Customer landscape overview
      • Analysis of price sensitivity, lifecycle, customer purchase basket, adoption rates, and purchase criteria

    11 Geographic Landscape

    • 11.1 Geographic segmentation
      • Chart on Market share by geography 2023-2028 (%)
      • Data Table on Market share by geography 2023-2028 (%)
    • 11.2 Geographic comparison
      • Chart on Geographic comparison
      • Data Table on Geographic comparison
    • 11.3 North America - Market size and forecast 2023-2028
      • Chart on North America - Market size and forecast 2023-2028 ($ million)
      • Data Table on North America - Market size and forecast 2023-2028 ($ million)
      • Chart on North America - Year-over-year growth 2023-2028 (%)
      • Data Table on North America - Year-over-year growth 2023-2028 (%)
    • 11.4 Europe - Market size and forecast 2023-2028
      • Chart on Europe - Market size and forecast 2023-2028 ($ million)
      • Data Table on Europe - Market size and forecast 2023-2028 ($ million)
      • Chart on Europe - Year-over-year growth 2023-2028 (%)
      • Data Table on Europe - Year-over-year growth 2023-2028 (%)
    • 11.5 APAC - Market size and forecast 2023-2028
      • Chart on APAC - Market size and forecast 2023-2028 ($ million)
      • Data Table on APAC - Market size and forecast 2023-2028 ($ million)
      • Chart on APAC - Year-over-year growth 2023-2028 (%)
      • Data Table on APAC - Year-over-year growth 2023-2028 (%)
    • 11.6 South America - Market size and forecast 2023-2028
      • Chart on South America - Market size and forecast 2023-2028 ($ million)
      • Data Table on South America - Market size and forecast 2023-2028 ($ million)
      • Chart on South America - Year-over-year growth 2023-2028 (%)
      • Data Table on South America - Year-over-year growth 2023-2028 (%)
    • 11.7 Middle East and Africa - Market size and forecast 2023-2028
      • Chart on Middle East and Africa - Market size and forecast 2023-2028 ($ million)
      • Data Table on Middle East and Africa - Market size and forecast 2023-2028 ($ million)
      • Chart on Middle East and Africa - Year-over-year growth 2023-2028 (%)
      • Data Table on Middle East and Africa - Year-over-year growth 2023-2028 (%)
    • 11.8 US - Market size and forecast 2023-2028
      • Chart on US - Market size and forecast 2023-2028 ($ million)
      • Data Table on US - Market size and forecast 2023-2028 ($ million)
      • Chart on US - Year-over-year growth 2023-2028 (%)
      • Data Table on US - Year-over-year growth 2023-2028 (%)
    • 11.9 China - Market size and forecast 2023-2028
      • Chart on China - Market size and forecast 2023-2028 ($ million)
      • Data Table on China - Market size and forecast 2023-2028 ($ million)
      • Chart on China - Year-over-year growth 2023-2028 (%)
      • Data Table on China - Year-over-year growth 2023-2028 (%)
    • 11.10 Germany - Market size and forecast 2023-2028
      • Chart on Germany - Market size and forecast 2023-2028 ($ million)
      • Data Table on Germany - Market size and forecast 2023-2028 ($ million)
      • Chart on Germany - Year-over-year growth 2023-2028 (%)
      • Data Table on Germany - Year-over-year growth 2023-2028 (%)
    • 11.11 UK - Market size and forecast 2023-2028
      • Chart on UK - Market size and forecast 2023-2028 ($ million)
      • Data Table on UK - Market size and forecast 2023-2028 ($ million)
      • Chart on UK - Year-over-year growth 2023-2028 (%)
      • Data Table on UK - Year-over-year growth 2023-2028 (%)
    • 11.12 France - Market size and forecast 2023-2028
      • Chart on France - Market size and forecast 2023-2028 ($ million)
      • Data Table on France - Market size and forecast 2023-2028 ($ million)
      • Chart on France - Year-over-year growth 2023-2028 (%)
      • Data Table on France - Year-over-year growth 2023-2028 (%)
    • 11.13 Australia - Market size and forecast 2023-2028
      • Chart on Australia - Market size and forecast 2023-2028 ($ million)
      • Data Table on Australia - Market size and forecast 2023-2028 ($ million)
      • Chart on Australia - Year-over-year growth 2023-2028 (%)
      • Data Table on Australia - Year-over-year growth 2023-2028 (%)
    • 11.14 Market opportunity by geography
      • Market opportunity by geography ($ million)
      • Data Tables on Market opportunity by geography ($ million)

    12 Drivers, Challenges, and Opportunity/Restraints

    • 12.1 Market drivers
      • 12.2 Market challenges
        • 12.3 Impact of drivers and challenges
          • Impact of drivers and challenges in 2023 and 2028
        • 12.4 Market opportunities/restraints

          13 Competitive Landscape

          • 13.1 Overview
            • 13.2 Competitive Landscape
              • Overview on criticality of inputs and factors of differentiation
            • 13.3 Landscape disruption
              • Overview on factors of disruption
            • 13.4 Industry risks
              • Impact of key risks on business

            14 Competitive Analysis

            • 14.1 Companies profiled
              • Companies covered
            • 14.2 Company ranking index
              • Company ranking index
            • 14.3 Market positioning of companies
              • Matrix on companies position and classification
            • 14.4 Archer Daniels Midland Co.
              • Archer Daniels Midland Co. - Overview
              • Archer Daniels Midland Co. - Business segments
              • Archer Daniels Midland Co. - Key news
              • Archer Daniels Midland Co. - Key offerings
              • Archer Daniels Midland Co. - Segment focus
              • SWOT
            • 14.5 BP Plc
              • BP Plc - Overview
              • BP Plc - Business segments
              • BP Plc - Key news
              • BP Plc - Key offerings
              • BP Plc - Segment focus
              • SWOT
            • 14.6 Bunge Ltd.
              • Bunge Ltd. - Overview
              • Bunge Ltd. - Business segments
              • Bunge Ltd. - Key news
              • Bunge Ltd. - Key offerings
              • Bunge Ltd. - Segment focus
              • SWOT
            • 14.7 Cargill Inc.
              • Cargill Inc. - Overview
              • Cargill Inc. - Product / Service
              • Cargill Inc. - Key news
              • Cargill Inc. - Key offerings
              • SWOT
            • 14.8 Chevron Corp.
              • Chevron Corp. - Overview
              • Chevron Corp. - Business segments
              • Chevron Corp. - Key news
              • Chevron Corp. - Key offerings
              • Chevron Corp. - Segment focus
              • SWOT
            • 14.9 Clariant AG
              • Clariant AG - Overview
              • Clariant AG - Business segments
              • Clariant AG - Key news
              • Clariant AG - Key offerings
              • Clariant AG - Segment focus
              • SWOT
            • 14.10 Cox Energy SAB de CV
              • Cox Energy SAB de CV - Overview
              • Cox Energy SAB de CV - Product / Service
              • Cox Energy SAB de CV - Key offerings
              • SWOT
            • 14.11 Eni SpA
              • Eni SpA - Overview
              • Eni SpA - Business segments
              • Eni SpA - Key news
              • Eni SpA - Key offerings
              • Eni SpA - Segment focus
              • SWOT
            • 14.12 INEOS AG
              • INEOS AG - Overview
              • INEOS AG - Product / Service
              • INEOS AG - Key news
              • INEOS AG - Key offerings
              • SWOT
            • 14.13 Neste Corp.
              • Neste Corp. - Overview
              • Neste Corp. - Business segments
              • Neste Corp. - Key news
              • Neste Corp. - Key offerings
              • Neste Corp. - Segment focus
              • SWOT
            • 14.14 Novozymes AS
              • Novozymes AS - Overview
              • Novozymes AS - Product / Service
              • Novozymes AS - Key offerings
              • SWOT
            • 14.15 Shell plc
              • Shell plc - Overview
              • Shell plc - Business segments
              • Shell plc - Key news
              • Shell plc - Key offerings
              • Shell plc - Segment focus
              • SWOT
            • 14.16 Suncor Energy Inc.
              • Suncor Energy Inc. - Overview
              • Suncor Energy Inc. - Business segments
              • Suncor Energy Inc. - Key offerings
              • Suncor Energy Inc. - Segment focus
              • SWOT
            • 14.17 TotalEnergies SE
              • TotalEnergies SE - Overview
              • TotalEnergies SE - Business segments
              • TotalEnergies SE - Key news
              • TotalEnergies SE - Key offerings
              • TotalEnergies SE - Segment focus
              • SWOT
            • 14.18 Valero Energy Corp.
              • Valero Energy Corp. - Overview
              • Valero Energy Corp. - Business segments
              • Valero Energy Corp. - Key offerings
              • Valero Energy Corp. - Segment focus
              • SWOT

            15 Appendix

            • 15.1 Scope of the report
              • 15.2 Inclusions and exclusions checklist
                • Inclusions checklist
                • Exclusions checklist
              • 15.3 Currency conversion rates for US$
                • Currency conversion rates for US$
              • 15.4 Research methodology
                • Research methodology
              • 15.5 Data procurement
                • Information sources
              • 15.6 Data validation
                • Data validation
              • 15.7 Validation techniques employed for market sizing
                • Validation techniques employed for market sizing
              • 15.8 Data synthesis
                • Data synthesis
              • 15.9 360 degree market analysis
                • 360 degree market analysis
              • 15.10 List of abbreviations
                • List of abbreviations

              Research Methodology

              Technavio presents a detailed picture of the market by way of study, synthesis, and summation of data from multiple sources. The analysts have presented the various facets of the market with a particular focus on identifying the key industry influencers. The data thus presented is comprehensive, reliable, and the result of extensive research, both primary and secondary.

              INFORMATION SOURCES

              Primary sources

              • Manufacturers and suppliers
              • Channel partners
              • Industry experts
              • Strategic decision makers

              Secondary sources

              • Industry journals and periodicals
              • Government data
              • Financial reports of key industry players
              • Historical data
              • Press releases

              DATA ANALYSIS

              Data Synthesis

              • Collation of data
              • Estimation of key figures
              • Analysis of derived insights

              Data Validation

              • Triangulation with data models
              • Reference against proprietary databases
              • Corroboration with industry experts

              REPORT WRITING

              Qualitative

              • Market drivers
              • Market challenges
              • Market trends
              • Five forces analysis

              Quantitative

              • Market size and forecast
              • Market segmentation
              • Geographical insights
              • Competitive landscape

              Interested in this report?

              Get your sample now to see our research methodology and insights!

              Download Now

              Frequently Asked Questions

              Renewable Fuel market growth will increase by $ 66.7 mn during 2024-2028.

              The Renewable Fuel market is expected to grow at a CAGR of 7.13% during 2024-2028.

              Renewable Fuel market is segmented by Type( Biofuels, Hydrogen, Biomethane, Others) End-user( Road transporation, Avaition, Marine, Residential, Others)

              Aemetis Inc., ALTO INGREDIENTS Inc., Archer Daniels Midland Co., BP Plc, Bunge Ltd., Cargill Inc., Chevron Corp., Clariant AG, Cox Energy SAB de CV, Eni SpA, Enviva Inc., Green Plains Inc., INEOS AG, Louis Dreyfus Co. BV, Neste Corp., Novozymes AS, POET LLC, Shell plc, Suncor Energy Inc., TotalEnergies SE, Valero Energy Corp. are a few of the key vendors in the Renewable Fuel market.

              North America will register the highest growth rate of 37% among the other regions. Therefore, the Renewable Fuel market in North America is expected to garner significant business opportunities for the vendors during the forecast period.

              US, China, Germany, UK, France, Australia

              • Rising adoption of Waste-to-Energy Technologies is the driving factor this market.

              The Renewable Fuel market vendors should focus on grabbing business opportunities from the Biofuels segment as it accounted for the largest market share in the base year.