Restaurant Management Software Market Analysis, Size, and Forecast 2026-2030: North America (US, Canada, and Mexico), Europe (Germany, UK, and France), APAC (China, Japan, and India), South America (Brazil and Argentina), Middle East and Africa (Saudi Arabia, UAE, and South Africa), and Rest of World (ROW)

Restaurant Management Software Market Analysis, Size, and Forecast 2026-2030:
North America (US, Canada, and Mexico), Europe (Germany, UK, and France), APAC (China, Japan, and India), South America (Brazil and Argentina), Middle East and Africa (Saudi Arabia, UAE, and South Africa), and Rest of World (ROW)

Published: Mar 2026 294 Pages SKU: IRTNTR40354

Market Overview at a Glance

$9.12 B
Market Opportunity
19.4%
CAGR 2025 - 2030
49.9%
North America Growth
$3.73 B
On-premises segment 2024

Restaurant Management Software Market Size 2026-2030

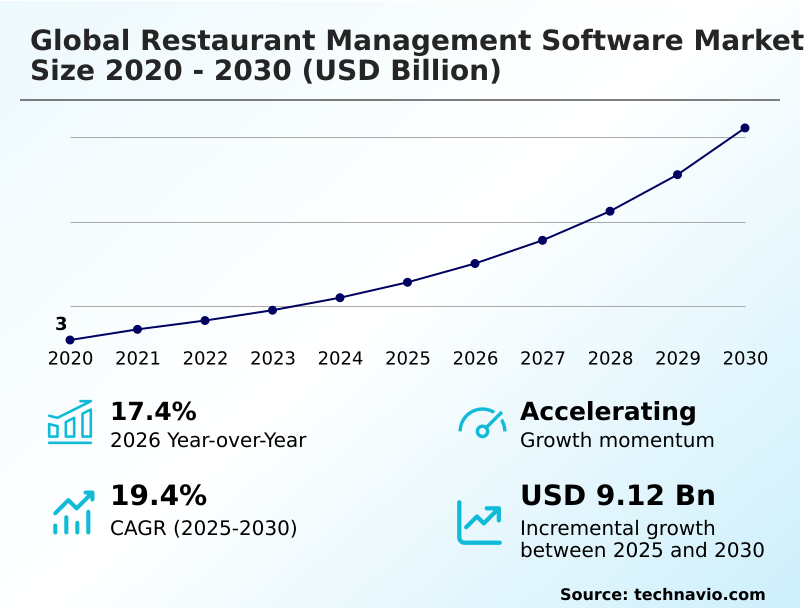
The restaurant management software market size is valued to increase by USD 9.12 billion, at a CAGR of 19.4% from 2025 to 2030. Rapid digitalization of restaurant operations and workflow automation will drive the restaurant management software market.

Major Market Trends & Insights

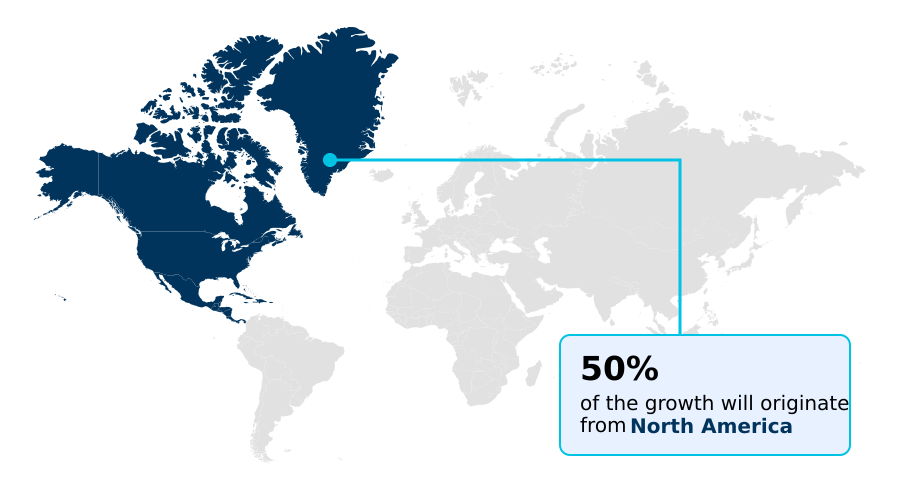
  • North America dominated the market and accounted for a 49.9% growth during the forecast period.
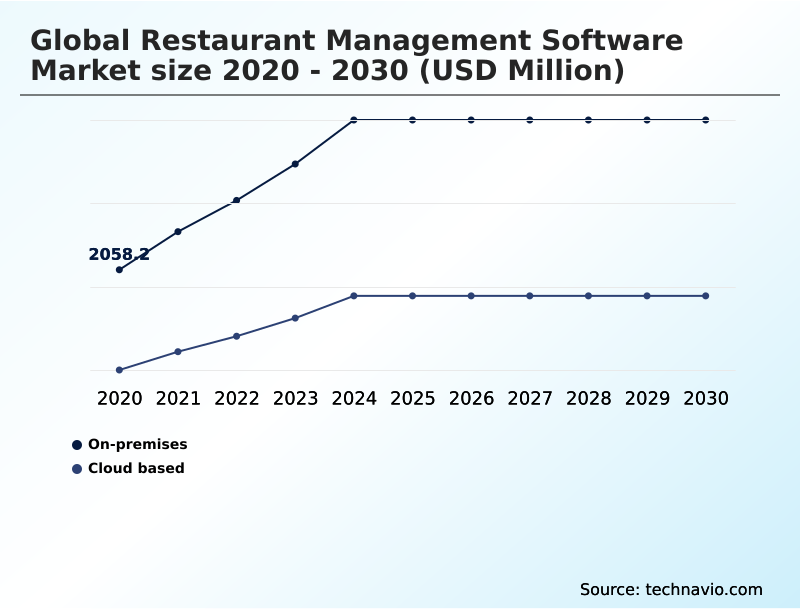
  • By Deployment - On-premises segment was valued at USD 3.73 billion in 2024
  • By End-user - Quick service restaurant segment accounted for the largest market revenue share in 2024

Market Size & Forecast

  • Market Opportunities: USD 12.53 billion
  • Market Future Opportunities: USD 9.12 billion
  • CAGR from 2025 to 2030 : 19.4%

Market Summary

  • The restaurant management software market is defined by a dynamic push toward digital transformation, driven by the need for enhanced operational efficiency and superior customer experiences. Key trends include the widespread adoption of cloud-based pos architecture and subscription-based software models, which offer scalability and reduce upfront capital expenditure for establishments of all sizes.
  • The integration of artificial intelligence is also becoming prominent, enabling advanced capabilities like predictive demand forecasting and menu engineering analytics to optimize profitability. For instance, a multi-location restaurant chain can leverage a unified restaurant operations platform to standardize workflows, using data from its point-of-sale (pos) systems for real-time inventory tracking across all branches.
  • This data-driven decision making allows for precise food cost management and reduces waste. However, challenges such as the complexity of third-party delivery integration and ensuring robust payment security compliance persist.
  • As the industry evolves, the focus remains on creating seamless, integrated ecosystems that automate everything from online reservation systems to back-of-house automation, ultimately helping businesses navigate a competitive landscape marked by thin margins and high consumer expectations. Solutions that offer a comprehensive end-to-end platform are best positioned for success.

What will be the Size of the Restaurant Management Software Market during the forecast period?

Get Key Insights on Market Forecast (PDF) Request Free Sample

How is the Restaurant Management Software Market Segmented?

The restaurant management software industry research report provides comprehensive data (region-wise segment analysis), with forecasts and estimates in "USD million" for the period 2026-2030, as well as historical data from 2020-2024 for the following segments.

  • Deployment
    • On-premises
    • Cloud based
  • End-user
    • Quick service restaurant
    • Full-service restaurant
    • Institutional
  • Type
    • Front end software
    • Accounting and cash flow
    • Purchasing and inventory management
    • Others
  • Geography
    • North America
      • US
      • Canada
      • Mexico
    • Europe
      • Germany
      • UK
      • France
    • APAC
      • China
      • Japan
      • India
    • South America
      • Brazil
      • Argentina
    • Middle East and Africa
      • Saudi Arabia
      • UAE
      • South Africa
    • Rest of World (ROW)

By Deployment Insights

The on-premises segment is estimated to witness significant growth during the forecast period.

The on-premises segment remains foundational for large-scale hospitality groups prioritizing direct control over their enterprise resource planning (erp) infrastructure. This deployment model involves installing software, from comprehensive restaurant accounting software to specialized inventory control software, directly onto local servers.

It ensures uninterrupted operations, maintaining a 99.9% uptime rate for crucial functions like online reservation systems even during internet outages.

Operators leverage these systems for intensive supply chain optimization, detailed ingredient-level tracking, and generating automated purchase orders through procurement management modules.

For enterprises with complex employee payroll processing or shift management software needs, on-premises solutions offer unparalleled customization, ensuring that all restaurant financial reporting is managed within a secure, self-contained environment.

Request Free Sample

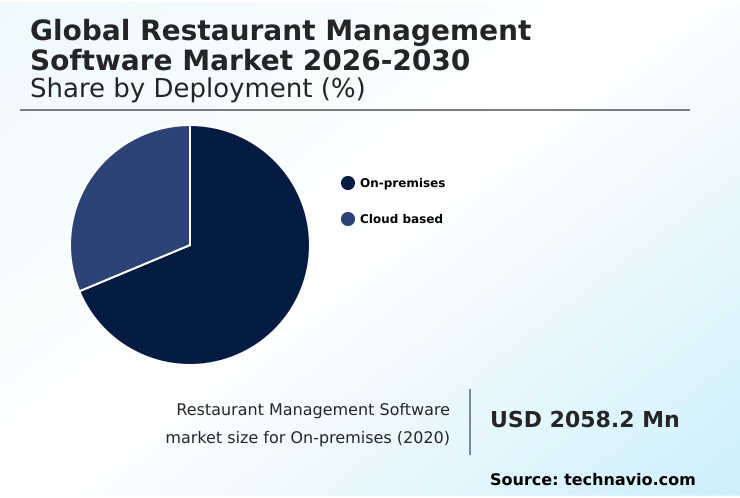
The On-premises segment was valued at USD 3.73 billion in 2024 and showed a gradual increase during the forecast period.

Request Free Sample

Regional Analysis

North America is estimated to contribute 49.9% to the growth of the global market during the forecast period.Technavio’s analysts have elaborately explained the regional trends and drivers that shape the market during the forecast period.

See How Restaurant Management Software Market Demand is Rising in North America Request Free Sample

The geographic landscape is led by North America, accounting for nearly 50% of incremental growth due to high adoption of cloud-based pos architecture.

Meanwhile, APAC is forecast to expand at a rate over 20%, fueled by mobile-first economies adopting end-to-end platform solutions. In mature markets, deployment of a unified commerce platform improves staff performance tracking and overall efficiency by up to 18%.

European operators prioritize systems with strong revenue management system features, while emerging markets focus on foundational table management software and tools for food cost management.

Advanced capabilities like predictive demand forecasting and kitchen display systems (kds) are becoming standard globally, supported by a comprehensive restaurant analytics dashboard for real-time insights.

Market Dynamics

Our researchers analyzed the data with 2025 as the base year, along with the key drivers, trends, and challenges. A holistic analysis of drivers will help companies refine their marketing strategies to gain a competitive advantage.

  • The Global Restaurant Management Software Market 2026-2030 addresses a wide spectrum of operational needs, from the high-transaction environment of Global Restaurant Management Software Market 2026-2030 for quick service restaurants to the nuanced requirements of fine dining.
  • A key consideration for operators is choosing a pos system for a small restaurant, where affordability and ease of use are paramount, versus selecting a cloud-based pos for multi-unit chains that offers robust scalability. The omnichannel strategy for restaurant chains has become essential, necessitating seamless processes for integrating delivery apps with pos systems.
  • Technology is also pivotal in achieving internal efficiencies. For example, ai-driven inventory management for restaurants provides a direct answer to how to reduce food waste with technology, with some businesses reporting a reduction in spoilage that is double that of those using manual tracking.
  • Restaurant workforce scheduling automation software and tools for managing staff payroll and tips with software address critical labor challenges. The kitchen display system benefits for efficiency are well-documented, directly improving table turnover with management software. For full-service establishments, contactless dining solutions for full-service restaurants enhance guest safety and convenience.
  • Data-centric tools, including analytics for optimizing restaurant menu pricing and real-time sales analytics for restaurant owners, empower strategic decisions. Finally, customer loyalty program software for restaurants, restaurant accounting software integration with pos, and strong best practices for restaurant data security are crucial for sustainable growth, ensuring a positive return on investment of restaurant management software.
  • The self-service kiosk implementation in restaurants and comprehensive restaurant supply chain management solutions round out the ecosystem.

What are the key market drivers leading to the rise in the adoption of Restaurant Management Software Industry?

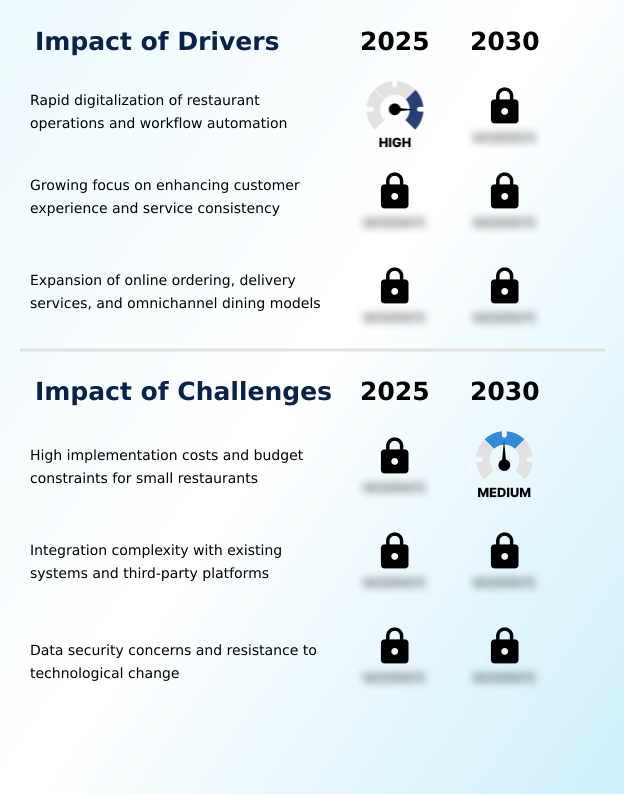
  • The rapid digitalization of restaurant operations and the push for workflow automation are key drivers propelling market growth.

  • Market growth is driven by the urgent need for operational efficiency and omnichannel dining management. A modern restaurant operations platform enables centralized order processing from in-house and third-party channels via seamless online ordering integration.
  • This push for efficiency extends to back-of-house automation and kitchen workflow optimization, where kitchen order ticket (kot) automation has been shown to reduce order fulfillment times by over 25%.
  • On the management side, tools for labor cost optimization, such as a workforce scheduling platform, and real-time sales reporting empower data-driven decision making.
  • Furthermore, real-time inventory tracking reduces waste and improves margins, while integrated payment solutions streamline the entire transaction process.

What are the market trends shaping the Restaurant Management Software Industry?

  • A significant market trend is the accelerating adoption of cloud-based and subscription-oriented software platforms, reflecting a fundamental shift in how restaurants procure and scale technology.

  • Key market trends are centered on enhancing the customer journey through technology. The adoption of subscription-based software models is accelerating, allowing for continuous updates to features like digital menu management and marketing automation tools.
  • This supports a rise in contactless ordering systems, including QR code menu generation and self-service kiosks, which integrate with mobile POS applications for seamless mobile payment processing. These digital storefront solutions are not just transactional; they incorporate powerful guest engagement tools and loyalty program integration.
  • Back-end menu engineering analytics improve profitability by 10-15%, while detailed customer preference tracking enables personalization, improving repeat business by over 20%.

What challenges does the Restaurant Management Software Industry face during its growth?

  • High implementation costs and persistent budget constraints, particularly for small restaurants, present a key challenge affecting industry-wide adoption and growth.

  • Significant challenges persist, primarily around the complexity and cost of integrating disparate systems. Implementing comprehensive hospitality management solutions can be hindered by difficulties with third-party delivery integration, which often requires custom API for third-party apps and can increase initial setup costs by 20%. Achieving robust payment security compliance is another major hurdle, particularly for smaller operators.
  • Even with advanced software, businesses struggle to utilize features like customer relationship management (crm) and guest feedback analytics effectively without proper training, leading to a 50% underutilization of tools designed for customer data analytics. Similarly, extracting value from waste reduction analytics or server performance metrics requires a shift in management culture toward data literacy.

Exclusive Technavio Analysis on Customer Landscape

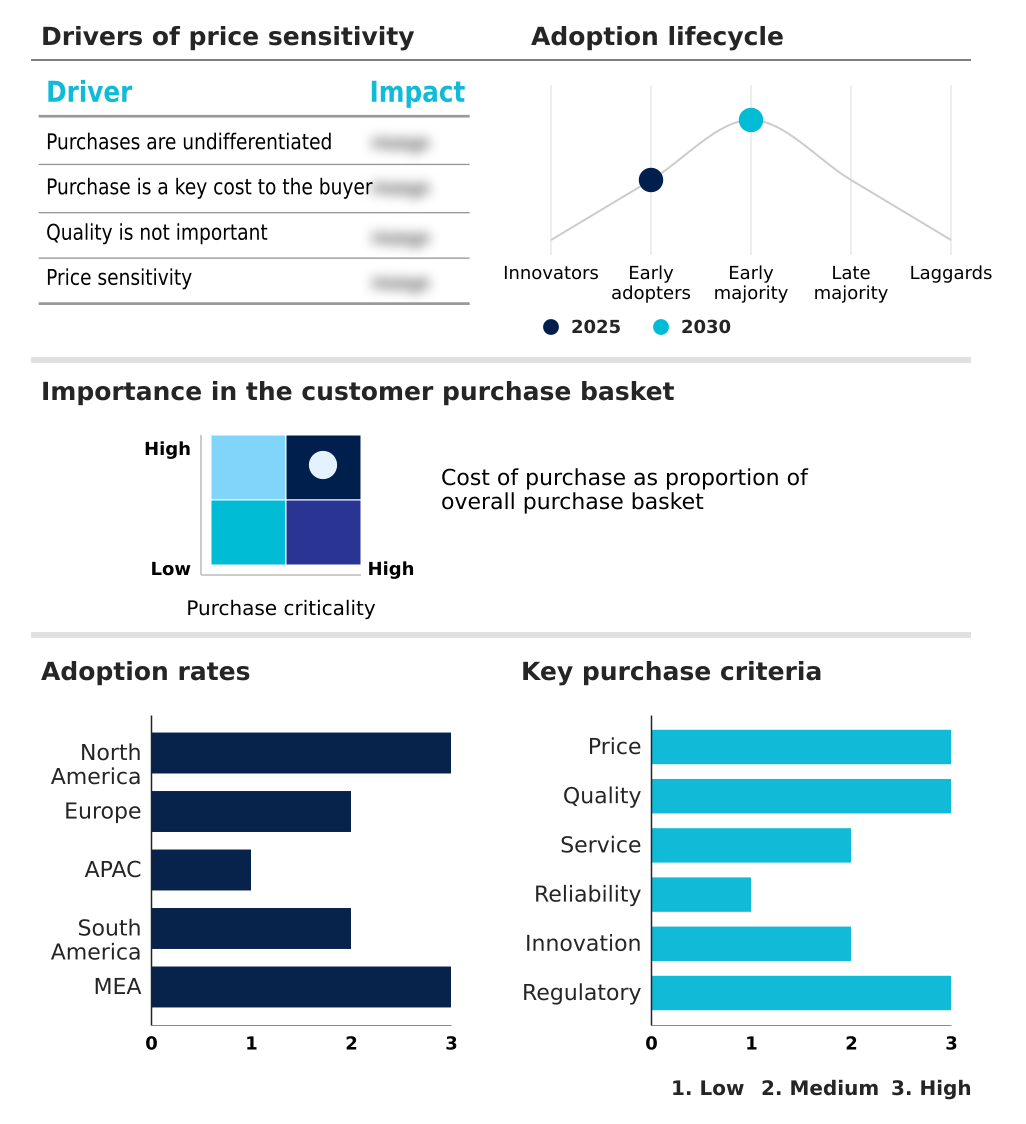
The restaurant management software market forecasting report includes the adoption lifecycle of the market, covering from the innovator’s stage to the laggard’s stage. It focuses on adoption rates in different regions based on penetration. Furthermore, the restaurant management software market report also includes key purchase criteria and drivers of price sensitivity to help companies evaluate and develop their market growth analysis strategies.

Customer Landscape of Restaurant Management Software Industry

Competitive Landscape

Companies are implementing various strategies, such as strategic alliances, restaurant management software market forecast, partnerships, mergers and acquisitions, geographical expansion, and product/service launches, to enhance their presence in the industry.

Block Inc. - Analysis shows a strategic focus on unified cloud platforms that integrate point-of-sale, payments, and operational management to enhance restaurant efficiency and guest engagement.

The industry research and growth report includes detailed analyses of the competitive landscape of the market and information about key companies, including:

  • Block Inc.
  • Cozy Infosystems Inc.
  • Fiserv Inc.
  • Fourth Enterprises LLC
  • Gofrugal Technologies Ltd.
  • i3 Verticals Inc.
  • Jolt Software Inc.
  • Lavu Inc.
  • Lightspeed Commerce Inc.
  • NCR Payment Solutions LLC
  • OpenTable Inc.
  • Oracle Corp.
  • PAR Technology Corp.
  • Restaurant365 LLC
  • Shift4 Payments Inc.
  • Technoheaven Pvt.
  • Toast Inc.
  • TouchBistro Inc.

Qualitative and quantitative analysis of companies has been conducted to help clients understand the wider business environment as well as the strengths and weaknesses of key industry players. Data is qualitatively analyzed to categorize companies as pure play, category-focused, industry-focused, and diversified; it is quantitatively analyzed to categorize companies as dominant, leading, strong, tentative, and weak.

Recent Development and News in Restaurant management software market

  • In September 2024, Zomato launched its new POS Developer Platform, providing unified API guides and real-time testing tools to accelerate integration for point-of-sale partners and streamline restaurant operations.
  • In March 2025, Block Inc. announced the launch of its next-generation Square Point of Sale App, a unified application combining commerce, payments, and operational tools into a single, streamlined interface for sellers.
  • In April 2025, Lightspeed Commerce Inc. integrated wholesale ordering directly into its retail POS platform with PO Sync, allowing retailers to automate replenishment orders to suppliers with a single click.
  • In May 2025, Toast, Inc. introduced ToastIQ, an AI-powered intelligence engine designed to provide data-driven prompts, personalized recommendations, and automated workflows to help restaurant operators manage daily operations more efficiently.

Dive into Technavio’s robust research methodology, blending expert interviews, extensive data synthesis, and validated models for unparalleled Restaurant Management Software Market insights. See full methodology.

Market Scope
Page number 294
Base year 2025
Historic period 2020-2024
Forecast period 2026-2030
Growth momentum & CAGR Accelerate at a CAGR of 19.4%
Market growth 2026-2030 USD 9117.3 million
Market structure Fragmented
YoY growth 2025-2026(%) 17.4%
Key countries US, Canada, Mexico, Germany, UK, France, Italy, Spain, The Netherlands, China, Japan, India, South Korea, Australia, Indonesia, Brazil, Argentina, Chile, Saudi Arabia, UAE, South Africa, Israel and Turkey
Competitive landscape Leading Companies, Market Positioning of Companies, Competitive Strategies, and Industry Risks

Request Free Sample

Research Analyst Overview

  • From a strategic viewpoint, the market is defined by the shift toward a unified cloud-based pos architecture. Boardroom decisions center on this migration, which integrates point-of-sale (pos) systems with tools for the complete guest journey, including online reservation systems, table management software, contactless ordering systems via qr code menu generation, and self-service kiosks.
  • This approach enhances omnichannel dining management and is completed with mobile payment processing and integrated payment solutions. Operationally, this extends to back-of-house automation, connecting the kitchen display systems (kds) for superior kitchen workflow optimization.
  • Core back-end functions like inventory control software, procurement management modules, supply chain optimization, and employee payroll processing are unified within a single enterprise resource planning (erp) or specialized restaurant accounting software. The power of this ecosystem lies in data-driven decision making, fueled by menu engineering analytics, real-time sales reporting, guest feedback analytics, and waste reduction analytics.
  • These insights inform predictive demand forecasting and precise food cost management, while nutritional data management ensures compliance. Advanced platforms also improve server performance metrics and table turnover rate tracking. Finally, this ecosystem connects externally through digital storefront solutions, marketing automation tools, customer relationship management (crm) with loyalty program integration, and essential third-party delivery integration.

What are the Key Data Covered in this Restaurant Management Software Market Research and Growth Report?

  • What is the expected growth of the Restaurant Management Software Market between 2026 and 2030?

    • USD 9.12 billion, at a CAGR of 19.4%

  • What segmentation does the market report cover?

    • The report is segmented by Deployment (On-premises, and Cloud based), End-user (Quick service restaurant, Full-service restaurant, and Institutional), Type (Front end software, Accounting and cash flow, Purchasing and inventory management, and Others) and Geography (North America, Europe, APAC, South America, Middle East and Africa)

  • Which regions are analyzed in the report?

    • North America, Europe, APAC, South America and Middle East and Africa

  • What are the key growth drivers and market challenges?

    • Rapid digitalization of restaurant operations and workflow automation, High implementation costs and budget constraints for small restaurants

  • Who are the major players in the Restaurant Management Software Market?

    • Block Inc., Cozy Infosystems Inc., Fiserv Inc., Fourth Enterprises LLC, Gofrugal Technologies Ltd., i3 Verticals Inc., Jolt Software Inc., Lavu Inc., Lightspeed Commerce Inc., NCR Payment Solutions LLC, OpenTable Inc., Oracle Corp., PAR Technology Corp., Restaurant365 LLC, Shift4 Payments Inc., Technoheaven Pvt., Toast Inc. and TouchBistro Inc.

Market Research Insights

  • Market dynamics are increasingly shaped by the pursuit of data-driven efficiency through integrated hospitality management solutions. The adoption of a unified commerce platform has been shown to reduce order processing errors by up to 25%, directly improving customer satisfaction.
  • Furthermore, implementing real-time inventory tracking as part of a restaurant operations platform can decrease food waste by 15%, which significantly impacts bottom-line profitability. These food service technology advancements enable operators to leverage customer data analytics for targeted marketing and labor cost optimization.
  • As a result, businesses are shifting from fragmented tools to holistic systems that offer a complete view of operations, from centralized order processing to restaurant financial reporting, driving a higher return on technology investment.

We can help! Our analysts can customize this restaurant management software market research report to meet your requirements.

Get in touch

1. Executive Summary

1.1 Market overview

Executive Summary - Chart on Market Overview
Executive Summary - Data Table on Market Overview
Executive Summary - Chart on Global Market Characteristics
Executive Summary - Chart on Market by Geography
Executive Summary - Chart on Market Segmentation by Deployment
Executive Summary - Chart on Market Segmentation by End-user
Executive Summary - Chart on Market Segmentation by Type
Executive Summary - Chart on Incremental Growth
Executive Summary - Data Table on Incremental Growth
Executive Summary - Chart on Company Market Positioning

2. Technavio Analysis

2.1 Analysis of price sensitivity, lifecycle, customer purchase basket, adoption rates, and purchase criteria

2.2 Criticality of inputs and Factors of differentiation

Chart on Overview on criticality of inputs and factors of differentiation

2.3 Factors of disruption

Chart on Overview on factors of disruption

2.4 Impact of drivers and challenges

Chart on Impact of drivers and challenges in 2025 and 2030

3. Market Landscape

3.1 Market ecosystem

Chart on Parent Market
Data Table on - Parent Market

3.2 Market characteristics

Chart on Market characteristics analysis

3.3 Value chain analysis

Chart on Value chain analysis

4. Market Sizing

4.1 Market definition

Data Table on Offerings of companies included in the market definition

4.2 Market segment analysis

Market segments

4.3 Market size 2025

4.4 Market outlook: Forecast for 2025-2030

Chart on Global - Market size and forecast 2025-2030 ($ million)
Data Table on Global - Market size and forecast 2025-2030 ($ million)
Chart on Global Market: Year-over-year growth 2025-2030 (%)
Data Table on Global Market: Year-over-year growth 2025-2030 (%)

5. Historic Market Size

5.1 Global Restaurant Management Software Market 2020 - 2024

Historic Market Size - Data Table on Global Restaurant Management Software Market 2020 - 2024 ($ million)

5.2 Deployment segment analysis 2020 - 2024

Historic Market Size - Deployment Segment 2020 - 2024 ($ million)

5.3 End-user segment analysis 2020 - 2024

Historic Market Size - End-user Segment 2020 - 2024 ($ million)

5.4 Type segment analysis 2020 - 2024

Historic Market Size - Type Segment 2020 - 2024 ($ million)

5.5 Geography segment analysis 2020 - 2024

Historic Market Size - Geography Segment 2020 - 2024 ($ million)

5.6 Country segment analysis 2020 - 2024

Historic Market Size - Country Segment 2020 - 2024 ($ million)

6. Qualitative Analysis

6.1 The Impact of AI on Global Restaurant Management Software Market

7. Five Forces Analysis

7.1 Five forces summary

Five forces analysis - Comparison between 2025 and 2030

7.2 Bargaining power of buyers

Bargaining power of buyers - Impact of key factors 2025 and 2030

7.3 Bargaining power of suppliers

Bargaining power of suppliers - Impact of key factors in 2025 and 2030

7.4 Threat of new entrants

Threat of new entrants - Impact of key factors in 2025 and 2030

7.5 Threat of substitutes

Threat of substitutes - Impact of key factors in 2025 and 2030

7.6 Threat of rivalry

Threat of rivalry - Impact of key factors in 2025 and 2030

7.7 Market condition

Chart on Market condition - Five forces 2025 and 2030

8. Market Segmentation by Deployment

8.1 Market segments

Chart on Deployment - Market share 2025-2030 (%)
Data Table on Deployment - Market share 2025-2030 (%)

8.2 Comparison by Deployment

Chart on Comparison by Deployment
Data Table on Comparison by Deployment

8.3 On-premises - Market size and forecast 2025-2030

Chart on On-premises - Market size and forecast 2025-2030 ($ million)
Data Table on On-premises - Market size and forecast 2025-2030 ($ million)
Chart on On-premises - Year-over-year growth 2025-2030 (%)
Data Table on On-premises - Year-over-year growth 2025-2030 (%)

8.4 Cloud based - Market size and forecast 2025-2030

Chart on Cloud based - Market size and forecast 2025-2030 ($ million)
Data Table on Cloud based - Market size and forecast 2025-2030 ($ million)
Chart on Cloud based - Year-over-year growth 2025-2030 (%)
Data Table on Cloud based - Year-over-year growth 2025-2030 (%)

8.5 Market opportunity by Deployment

Market opportunity by Deployment ($ million)
Data Table on Market opportunity by Deployment ($ million)

9. Market Segmentation by End-user

9.1 Market segments

Chart on End-user - Market share 2025-2030 (%)
Data Table on End-user - Market share 2025-2030 (%)

9.2 Comparison by End-user

Chart on Comparison by End-user
Data Table on Comparison by End-user

9.3 Quick service restaurant - Market size and forecast 2025-2030

Chart on Quick service restaurant - Market size and forecast 2025-2030 ($ million)
Data Table on Quick service restaurant - Market size and forecast 2025-2030 ($ million)
Chart on Quick service restaurant - Year-over-year growth 2025-2030 (%)
Data Table on Quick service restaurant - Year-over-year growth 2025-2030 (%)

9.4 Full-service restaurant - Market size and forecast 2025-2030

Chart on Full-service restaurant - Market size and forecast 2025-2030 ($ million)
Data Table on Full-service restaurant - Market size and forecast 2025-2030 ($ million)
Chart on Full-service restaurant - Year-over-year growth 2025-2030 (%)
Data Table on Full-service restaurant - Year-over-year growth 2025-2030 (%)

9.5 Institutional - Market size and forecast 2025-2030

Chart on Institutional - Market size and forecast 2025-2030 ($ million)
Data Table on Institutional - Market size and forecast 2025-2030 ($ million)
Chart on Institutional - Year-over-year growth 2025-2030 (%)
Data Table on Institutional - Year-over-year growth 2025-2030 (%)

9.6 Market opportunity by End-user

Market opportunity by End-user ($ million)
Data Table on Market opportunity by End-user ($ million)

10. Market Segmentation by Type

10.1 Market segments

Chart on Type - Market share 2025-2030 (%)
Data Table on Type - Market share 2025-2030 (%)

10.2 Comparison by Type

Chart on Comparison by Type
Data Table on Comparison by Type

10.3 Front end software - Market size and forecast 2025-2030

Chart on Front end software - Market size and forecast 2025-2030 ($ million)
Data Table on Front end software - Market size and forecast 2025-2030 ($ million)
Chart on Front end software - Year-over-year growth 2025-2030 (%)
Data Table on Front end software - Year-over-year growth 2025-2030 (%)

10.4 Accounting and cash flow - Market size and forecast 2025-2030

Chart on Accounting and cash flow - Market size and forecast 2025-2030 ($ million)
Data Table on Accounting and cash flow - Market size and forecast 2025-2030 ($ million)
Chart on Accounting and cash flow - Year-over-year growth 2025-2030 (%)
Data Table on Accounting and cash flow - Year-over-year growth 2025-2030 (%)

10.5 Purchasing and inventory management - Market size and forecast 2025-2030

Chart on Purchasing and inventory management - Market size and forecast 2025-2030 ($ million)
Data Table on Purchasing and inventory management - Market size and forecast 2025-2030 ($ million)
Chart on Purchasing and inventory management - Year-over-year growth 2025-2030 (%)
Data Table on Purchasing and inventory management - Year-over-year growth 2025-2030 (%)

10.6 Others - Market size and forecast 2025-2030

Chart on Others - Market size and forecast 2025-2030 ($ million)
Data Table on Others - Market size and forecast 2025-2030 ($ million)
Chart on Others - Year-over-year growth 2025-2030 (%)
Data Table on Others - Year-over-year growth 2025-2030 (%)

10.7 Market opportunity by Type

Market opportunity by Type ($ million)
Data Table on Market opportunity by Type ($ million)

11. Customer Landscape

11.1 Customer landscape overview

Analysis of price sensitivity, lifecycle, customer purchase basket, adoption rates, and purchase criteria

12. Geographic Landscape

12.1 Geographic segmentation

Chart on Market share by geography 2025-2030 (%)
Data Table on Market share by geography 2025-2030 (%)

12.2 Geographic comparison

Chart on Geographic comparison
Data Table on Geographic comparison

12.3 North America - Market size and forecast 2025-2030

Chart on North America - Market size and forecast 2025-2030 ($ million)
Data Table on North America - Market size and forecast 2025-2030 ($ million)
Chart on North America - Year-over-year growth 2025-2030 (%)
Data Table on North America - Year-over-year growth 2025-2030 (%)
Chart on Regional Comparison - North America
Data Table on Regional Comparison - North America

12.3.1 US - Market size and forecast 2025-2030

Chart on US - Market size and forecast 2025-2030 ($ million)
Data Table on US - Market size and forecast 2025-2030 ($ million)
Chart on US - Year-over-year growth 2025-2030 (%)
Data Table on US - Year-over-year growth 2025-2030 (%)

12.3.2 Canada - Market size and forecast 2025-2030

Chart on Canada - Market size and forecast 2025-2030 ($ million)
Data Table on Canada - Market size and forecast 2025-2030 ($ million)
Chart on Canada - Year-over-year growth 2025-2030 (%)
Data Table on Canada - Year-over-year growth 2025-2030 (%)

12.3.3 Mexico - Market size and forecast 2025-2030

Chart on Mexico - Market size and forecast 2025-2030 ($ million)
Data Table on Mexico - Market size and forecast 2025-2030 ($ million)
Chart on Mexico - Year-over-year growth 2025-2030 (%)
Data Table on Mexico - Year-over-year growth 2025-2030 (%)

12.4 Europe - Market size and forecast 2025-2030

Chart on Europe - Market size and forecast 2025-2030 ($ million)
Data Table on Europe - Market size and forecast 2025-2030 ($ million)
Chart on Europe - Year-over-year growth 2025-2030 (%)
Data Table on Europe - Year-over-year growth 2025-2030 (%)
Chart on Regional Comparison - Europe
Data Table on Regional Comparison - Europe

12.4.1 Germany - Market size and forecast 2025-2030

Chart on Germany - Market size and forecast 2025-2030 ($ million)
Data Table on Germany - Market size and forecast 2025-2030 ($ million)
Chart on Germany - Year-over-year growth 2025-2030 (%)
Data Table on Germany - Year-over-year growth 2025-2030 (%)

12.4.2 UK - Market size and forecast 2025-2030

Chart on UK - Market size and forecast 2025-2030 ($ million)
Data Table on UK - Market size and forecast 2025-2030 ($ million)
Chart on UK - Year-over-year growth 2025-2030 (%)
Data Table on UK - Year-over-year growth 2025-2030 (%)

12.4.3 France - Market size and forecast 2025-2030

Chart on France - Market size and forecast 2025-2030 ($ million)
Data Table on France - Market size and forecast 2025-2030 ($ million)
Chart on France - Year-over-year growth 2025-2030 (%)
Data Table on France - Year-over-year growth 2025-2030 (%)

12.4.4 Italy - Market size and forecast 2025-2030

Chart on Italy - Market size and forecast 2025-2030 ($ million)
Data Table on Italy - Market size and forecast 2025-2030 ($ million)
Chart on Italy - Year-over-year growth 2025-2030 (%)
Data Table on Italy - Year-over-year growth 2025-2030 (%)

12.4.5 Spain - Market size and forecast 2025-2030

Chart on Spain - Market size and forecast 2025-2030 ($ million)
Data Table on Spain - Market size and forecast 2025-2030 ($ million)
Chart on Spain - Year-over-year growth 2025-2030 (%)
Data Table on Spain - Year-over-year growth 2025-2030 (%)

12.4.6 The Netherlands - Market size and forecast 2025-2030

Chart on The Netherlands - Market size and forecast 2025-2030 ($ million)
Data Table on The Netherlands - Market size and forecast 2025-2030 ($ million)
Chart on The Netherlands - Year-over-year growth 2025-2030 (%)
Data Table on The Netherlands - Year-over-year growth 2025-2030 (%)

12.5 APAC - Market size and forecast 2025-2030

Chart on APAC - Market size and forecast 2025-2030 ($ million)
Data Table on APAC - Market size and forecast 2025-2030 ($ million)
Chart on APAC - Year-over-year growth 2025-2030 (%)
Data Table on APAC - Year-over-year growth 2025-2030 (%)
Chart on Regional Comparison - APAC
Data Table on Regional Comparison - APAC

12.5.1 China - Market size and forecast 2025-2030

Chart on China - Market size and forecast 2025-2030 ($ million)
Data Table on China - Market size and forecast 2025-2030 ($ million)
Chart on China - Year-over-year growth 2025-2030 (%)
Data Table on China - Year-over-year growth 2025-2030 (%)

12.5.2 Japan - Market size and forecast 2025-2030

Chart on Japan - Market size and forecast 2025-2030 ($ million)
Data Table on Japan - Market size and forecast 2025-2030 ($ million)
Chart on Japan - Year-over-year growth 2025-2030 (%)
Data Table on Japan - Year-over-year growth 2025-2030 (%)

12.5.3 India - Market size and forecast 2025-2030

Chart on India - Market size and forecast 2025-2030 ($ million)
Data Table on India - Market size and forecast 2025-2030 ($ million)
Chart on India - Year-over-year growth 2025-2030 (%)
Data Table on India - Year-over-year growth 2025-2030 (%)

12.5.4 South Korea - Market size and forecast 2025-2030

Chart on South Korea - Market size and forecast 2025-2030 ($ million)
Data Table on South Korea - Market size and forecast 2025-2030 ($ million)
Chart on South Korea - Year-over-year growth 2025-2030 (%)
Data Table on South Korea - Year-over-year growth 2025-2030 (%)

12.5.5 Australia - Market size and forecast 2025-2030

Chart on Australia - Market size and forecast 2025-2030 ($ million)
Data Table on Australia - Market size and forecast 2025-2030 ($ million)
Chart on Australia - Year-over-year growth 2025-2030 (%)
Data Table on Australia - Year-over-year growth 2025-2030 (%)

12.5.6 Indonesia - Market size and forecast 2025-2030

Chart on Indonesia - Market size and forecast 2025-2030 ($ million)
Data Table on Indonesia - Market size and forecast 2025-2030 ($ million)
Chart on Indonesia - Year-over-year growth 2025-2030 (%)
Data Table on Indonesia - Year-over-year growth 2025-2030 (%)

12.6 South America - Market size and forecast 2025-2030

Chart on South America - Market size and forecast 2025-2030 ($ million)
Data Table on South America - Market size and forecast 2025-2030 ($ million)
Chart on South America - Year-over-year growth 2025-2030 (%)
Data Table on South America - Year-over-year growth 2025-2030 (%)
Chart on Regional Comparison - South America
Data Table on Regional Comparison - South America

12.6.1 Brazil - Market size and forecast 2025-2030

Chart on Brazil - Market size and forecast 2025-2030 ($ million)
Data Table on Brazil - Market size and forecast 2025-2030 ($ million)
Chart on Brazil - Year-over-year growth 2025-2030 (%)
Data Table on Brazil - Year-over-year growth 2025-2030 (%)

12.6.2 Argentina - Market size and forecast 2025-2030

Chart on Argentina - Market size and forecast 2025-2030 ($ million)
Data Table on Argentina - Market size and forecast 2025-2030 ($ million)
Chart on Argentina - Year-over-year growth 2025-2030 (%)
Data Table on Argentina - Year-over-year growth 2025-2030 (%)

12.6.3 Chile - Market size and forecast 2025-2030

Chart on Chile - Market size and forecast 2025-2030 ($ million)
Data Table on Chile - Market size and forecast 2025-2030 ($ million)
Chart on Chile - Year-over-year growth 2025-2030 (%)
Data Table on Chile - Year-over-year growth 2025-2030 (%)

12.7 Middle East and Africa - Market size and forecast 2025-2030

Chart on Middle East and Africa - Market size and forecast 2025-2030 ($ million)
Data Table on Middle East and Africa - Market size and forecast 2025-2030 ($ million)
Chart on Middle East and Africa - Year-over-year growth 2025-2030 (%)
Data Table on Middle East and Africa - Year-over-year growth 2025-2030 (%)
Chart on Regional Comparison - Middle East and Africa
Data Table on Regional Comparison - Middle East and Africa

12.7.1 Saudi Arabia - Market size and forecast 2025-2030

Chart on Saudi Arabia - Market size and forecast 2025-2030 ($ million)
Data Table on Saudi Arabia - Market size and forecast 2025-2030 ($ million)
Chart on Saudi Arabia - Year-over-year growth 2025-2030 (%)
Data Table on Saudi Arabia - Year-over-year growth 2025-2030 (%)

12.7.2 UAE - Market size and forecast 2025-2030

Chart on UAE - Market size and forecast 2025-2030 ($ million)
Data Table on UAE - Market size and forecast 2025-2030 ($ million)
Chart on UAE - Year-over-year growth 2025-2030 (%)
Data Table on UAE - Year-over-year growth 2025-2030 (%)

12.7.3 South Africa - Market size and forecast 2025-2030

Chart on South Africa - Market size and forecast 2025-2030 ($ million)
Data Table on South Africa - Market size and forecast 2025-2030 ($ million)
Chart on South Africa - Year-over-year growth 2025-2030 (%)
Data Table on South Africa - Year-over-year growth 2025-2030 (%)

12.7.4 Israel - Market size and forecast 2025-2030

Chart on Israel - Market size and forecast 2025-2030 ($ million)
Data Table on Israel - Market size and forecast 2025-2030 ($ million)
Chart on Israel - Year-over-year growth 2025-2030 (%)
Data Table on Israel - Year-over-year growth 2025-2030 (%)

12.7.5 Turkey - Market size and forecast 2025-2030

Chart on Turkey - Market size and forecast 2025-2030 ($ million)
Data Table on Turkey - Market size and forecast 2025-2030 ($ million)
Chart on Turkey - Year-over-year growth 2025-2030 (%)
Data Table on Turkey - Year-over-year growth 2025-2030 (%)

12.8 Market opportunity by geography

Market opportunity by geography ($ million)
Data Tables on Market opportunity by geography ($ million)

13. Drivers, Challenges, and Opportunity

13.1 Market drivers

Rapid digitalization of restaurant operations and workflow automation
Growing focus on enhancing customer experience and service consistency
Expansion of online ordering, delivery services, and omnichannel dining models

13.2 Market challenges

High implementation costs and budget constraints for small restaurants
Integration complexity with existing systems and third-party platforms
Data security concerns and resistance to technological change

13.3 Impact of drivers and challenges

Impact of drivers and challenges in 2025 and 2030

13.4 Market opportunities

Increasing adoption of cloud-based and subscription-oriented software platforms
Rising integration of advanced analytics and AI capabilities
Expansion of contactless, self-service, and digital ordering capabilities

14. Competitive Landscape

14.1 Overview

14.2

Overview on criticality of inputs and factors of differentiation

14.3 Landscape disruption

Overview on factors of disruption

14.4 Industry risks

Impact of key risks on business

15. Competitive Analysis

15.1 Companies profiled

Companies covered

15.2 Company ranking index

15.3 Market positioning of companies

Matrix on companies position and classification

15.4 Block Inc.

Block Inc. - Overview
Block Inc. - Business segments
Block Inc. - Key news
Block Inc. - Key offerings
Block Inc. - Segment focus
SWOT

15.5 Fiserv Inc.

Fiserv Inc. - Overview
Fiserv Inc. - Business segments
Fiserv Inc. - Key news
Fiserv Inc. - Key offerings
Fiserv Inc. - Segment focus
SWOT

15.6 Gofrugal Technologies Ltd.

Gofrugal Technologies Ltd. - Overview
Gofrugal Technologies Ltd. - Product / Service
Gofrugal Technologies Ltd. - Key offerings
SWOT

15.7 i3 Verticals Inc.

i3 Verticals Inc. - Overview
i3 Verticals Inc. - Business segments
i3 Verticals Inc. - Key offerings
i3 Verticals Inc. - Segment focus
SWOT

15.8 Jolt Software Inc.

Jolt Software Inc. - Overview
Jolt Software Inc. - Product / Service
Jolt Software Inc. - Key offerings
SWOT

15.9 Lavu Inc.

Lavu Inc. - Overview
Lavu Inc. - Product / Service
Lavu Inc. - Key offerings
SWOT

15.10 Lightspeed Commerce Inc.

Lightspeed Commerce Inc. - Overview
Lightspeed Commerce Inc. - Product / Service
Lightspeed Commerce Inc. - Key offerings
SWOT

15.11 NCR Payment Solutions LLC

NCR Payment Solutions LLC - Overview
NCR Payment Solutions LLC - Business segments
NCR Payment Solutions LLC - Key offerings
NCR Payment Solutions LLC - Segment focus
SWOT

15.12 OpenTable Inc.

OpenTable Inc. - Overview
OpenTable Inc. - Product / Service
OpenTable Inc. - Key offerings
SWOT

15.13 Oracle Corp.

Oracle Corp. - Overview
Oracle Corp. - Business segments
Oracle Corp. - Key news
Oracle Corp. - Key offerings
Oracle Corp. - Segment focus
SWOT

15.14 PAR Technology Corp.

PAR Technology Corp. - Overview
PAR Technology Corp. - Business segments
PAR Technology Corp. - Key offerings
PAR Technology Corp. - Segment focus
SWOT

15.15 Restaurant365 LLC

Restaurant365 LLC - Overview
Restaurant365 LLC - Product / Service
Restaurant365 LLC - Key offerings
SWOT

15.16 Shift4 Payments Inc.

Shift4 Payments Inc. - Overview
Shift4 Payments Inc. - Business segments
Shift4 Payments Inc. - Key offerings
Shift4 Payments Inc. - Segment focus
SWOT

15.17 Toast Inc.

Toast Inc. - Overview
Toast Inc. - Product / Service
Toast Inc. - Key offerings
SWOT

15.18 TouchBistro Inc.

TouchBistro Inc. - Overview
TouchBistro Inc. - Product / Service
TouchBistro Inc. - Key offerings
SWOT

16. Appendix

16.1 Scope of the report

Market definition
Objectives
Notes and caveats

16.2 Inclusions and exclusions checklist

Inclusions checklist
Exclusions checklist

16.3 Currency conversion rates for US$

16.4 Research methodology

16.5 Data procurement

Information sources

16.6 Data validation

16.7 Validation techniques employed for market sizing

16.8 Data synthesis

16.9 360 degree market analysis

16.10 List of abbreviations

Research Methodology

Technavio presents a detailed picture of the market by way of study, synthesis, and summation of data from multiple sources. The analysts have presented the various facets of the market with a particular focus on identifying the key industry influencers. The data thus presented is comprehensive, reliable, and the result of extensive research, both primary and secondary.

INFORMATION SOURCES

Primary sources

  • Manufacturers and suppliers
  • Channel partners
  • Industry experts
  • Strategic decision makers

Secondary sources

  • Industry journals and periodicals
  • Government data
  • Financial reports of key industry players
  • Historical data
  • Press releases

DATA ANALYSIS

Data Synthesis

  • Collation of data
  • Estimation of key figures
  • Analysis of derived insights

Data Validation

  • Triangulation with data models
  • Reference against proprietary databases
  • Corroboration with industry experts

REPORT WRITING

Qualitative

  • Market drivers
  • Market challenges
  • Market trends
  • Five forces analysis

Quantitative

  • Market size and forecast
  • Market segmentation
  • Geographical insights
  • Competitive landscape

Interested in this report?

Get your sample now to see our research methodology and insights!

Download Now

Frequently Asked Questions

Restaurant Management Software market growth will increase by USD 9117.3 million during 2026-2030.

The Restaurant Management Software market is expected to grow at a CAGR of 19.4% during 2026-2030.

Restaurant Management Software market is segmented by Deployment (On-premises, Cloud based) End-user (Quick service restaurant, Full-service restaurant, Institutional) Type (Front end software, Accounting and cash flow, Purchasing and inventory management, Others)

Block Inc., Cozy Infosystems Inc., Fiserv Inc., Fourth Enterprises LLC, Gofrugal Technologies Ltd., i3 Verticals Inc., Jolt Software Inc., Lavu Inc., Lightspeed Commerce Inc., NCR Payment Solutions LLC, OpenTable Inc., Oracle Corp., PAR Technology Corp., Restaurant365 LLC, Shift4 Payments Inc., Technoheaven Pvt., Toast Inc., TouchBistro Inc. are a few of the key vendors in the Restaurant Management Software market.

North America will register the highest growth rate of 49.9% among the other regions. Therefore, the Restaurant Management Software market in North America is expected to garner significant business opportunities for the vendors during the forecast period.

US, Canada, Mexico, Germany, UK, France, Italy, Spain, The Netherlands, China, Japan, India, South Korea, Australia, Indonesia, Brazil, Argentina, Chile, Saudi Arabia, UAE, South Africa, Israel, Turkey

  • Rapid digitalization of restaurant operations and workflow automation is the driving factor this market.

The Restaurant Management Software market vendors should focus on grabbing business opportunities from the Deployment segment as it accounted for the largest market share in the base year.