
Vietnam Retail Market Size 2026-2030
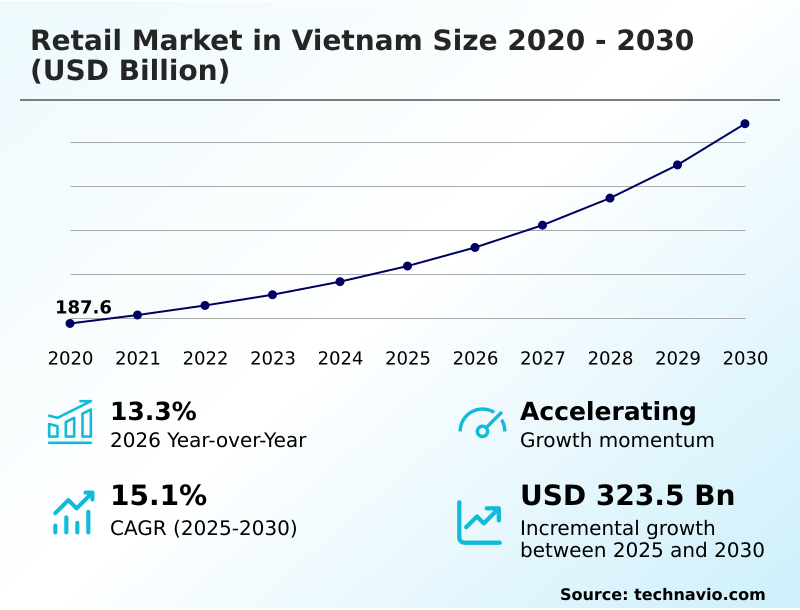
The vietnam retail market size is valued to increase by USD 323.5 billion, at a CAGR of 15.1% from 2025 to 2030. Favorable demographics and burgeoning middle class will drive the vietnam retail market.
Major Market Trends & Insights
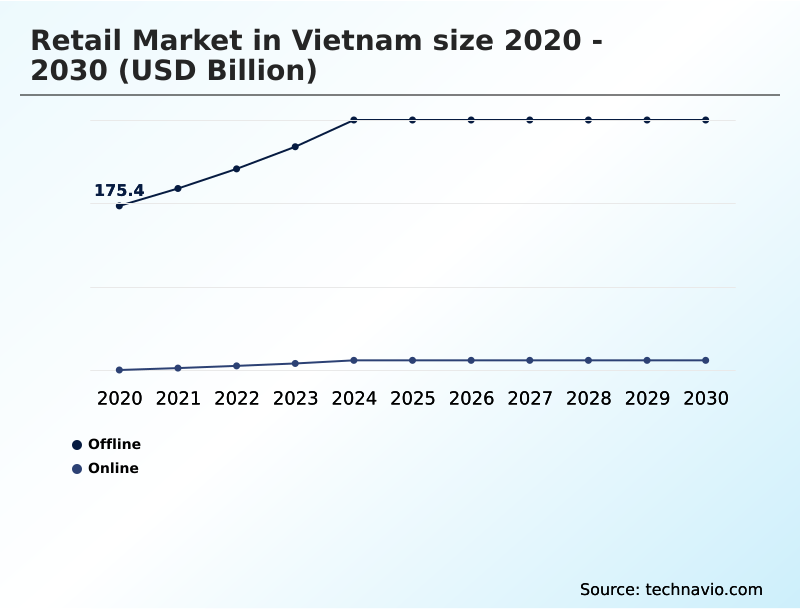
- By Distribution Channel - Offline segment was valued at USD 260.8 billion in 2024
- By Type - Grocery segment accounted for the largest market revenue share in 2024
Market Size & Forecast
- Market Opportunities: USD 454 billion
- Market Future Opportunities: USD 323.5 billion
- CAGR from 2025 to 2030 : 15.1%
Market Summary
- The retail market in Vietnam is undergoing a profound transformation, driven by a confluence of powerful economic and social forces. A youthful, digitally-savvy population with rising disposable income is fueling demand for modern retail formats and sophisticated product offerings, moving consumption beyond basic necessities.
- This shift is most evident in the rapid adoption of e-commerce and digital payment systems, compelling traditional brick-and-mortar retailers to innovate. The primary challenge lies in navigating intense competition and overcoming logistical hurdles.
- For instance, a national electronics retailer must optimize its supply chain to ensure both the efficient stocking of its physical stores in urban centers and the timely execution of last-mile delivery for its growing online customer base.
- Success hinges on creating a seamless omnichannel experience, leveraging data analytics for personalization, and investing in infrastructure to meet consumer expectations for convenience and quality. The market’s dynamism is further shaped by the strategic move toward experiential retail and a growing consumer focus on sustainability and wellness.
What will be the Size of the Vietnam Retail Market during the forecast period?
Get Key Insights on Market Forecast (PDF) Get Free Sample
How is the Vietnam Retail Market Segmented?
The vietnam retail industry research report provides comprehensive data (region-wise segment analysis), with forecasts and estimates in "USD billion" for the period 2026-2030, as well as historical data from 2020-2024 for the following segments.
- Distribution channel
- Offline
- Online
- Type
- Grocery
- Electronics and appliances
- Home and garden
- Health and beauty
- Others
- Channel
- Digital payment
- Cash
- Buy now pay later (BNPL)
- Geography
- APAC
By Distribution Channel Insights
The offline segment is estimated to witness significant growth during the forecast period.
The offline segment remains the foundation of the market, encompassing everything from traditional trade channels to modern retail formats.
While these legacy brick-and-mortar operations are evolving, the focus is on creating a seamless omnichannel strategy that bridges physical and digital worlds. For segments like grocery retail chains and consumer electronics retail, this integration is critical.
Success requires addressing complex logistics, such as cold chain management for perishables and last-mile delivery optimization for e-commerce fulfillment. Companies are investing in their digital commerce platform to support this transition, aiming for an improved omnichannel customer experience.
Adopting this integrated model has been shown to improve inventory accuracy in the organized retail sector by over 15%, reducing stockouts and enhancing customer satisfaction across both health and beauty retail and social commerce integration.
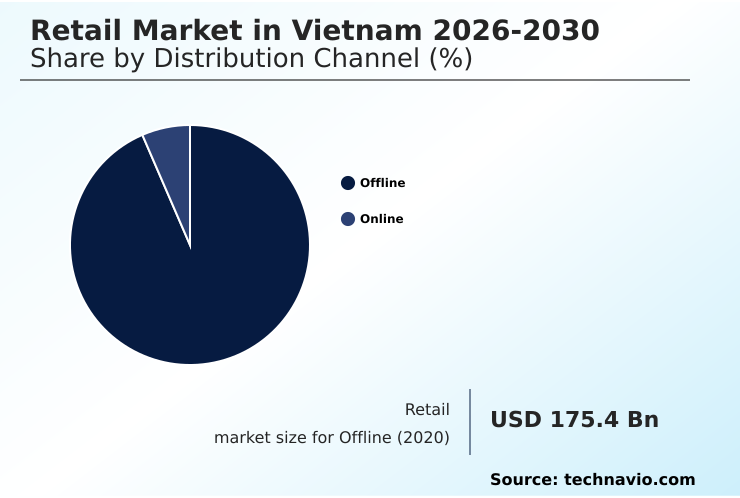
The Offline segment was valued at USD 260.8 billion in 2024 and showed a gradual increase during the forecast period.
Market Dynamics
Our researchers analyzed the data with 2025 as the base year, along with the key drivers, trends, and challenges. A holistic analysis of drivers will help companies refine their marketing strategies to gain a competitive advantage.
- Strategic success in today's retail environment hinges on mastering a complex set of operational capabilities. A primary focus is on improving last-mile delivery in urban centers, a critical factor for customer satisfaction. For online channels, integrating BNPL for e-commerce conversion has proven to boost average order values significantly, directly complementing efforts aimed at reducing cart abandonment in online retail.
- The foundation of these digital strategies is the effective use of data analytics for personalized promotions, which allows businesses to move beyond generic offers. In parallel, physical retail is being transformed by enhancing in-store experience with retailtainment, creating destinations rather than just stores.
- This requires implementing smart technology in physical stores and carefully balancing online and offline retail presence to create a cohesive brand experience. Operationally, leveraging AI for demand forecasting in retail is becoming standard practice, especially for managing inventory for fast fashion retail where product cycles are short.
- For grocery, optimizing cold chain for fresh grocery retail is non-negotiable for quality assurance. Across all segments, building brand loyalty through customer service remains a core pillar. As businesses expand, they face the dual challenge of navigating retail regulatory compliance challenges and securing digital payment systems against fraud.
- Ultimately, developing a seamless omnichannel customer journey is the overarching goal that connects all these initiatives, from marketing strategies for new consumer electronics to managing supply chain for home improvement goods. This holistic approach is also essential for expanding convenience store networks profitably, attracting affluent consumers to luxury retail, and embedding sustainable practices in the health and beauty sector.
- Effective execution in these areas can yield operational efficiencies over 15% higher than competitors who remain siloed.
What are the key market drivers leading to the rise in the adoption of Vietnam Retail Industry?
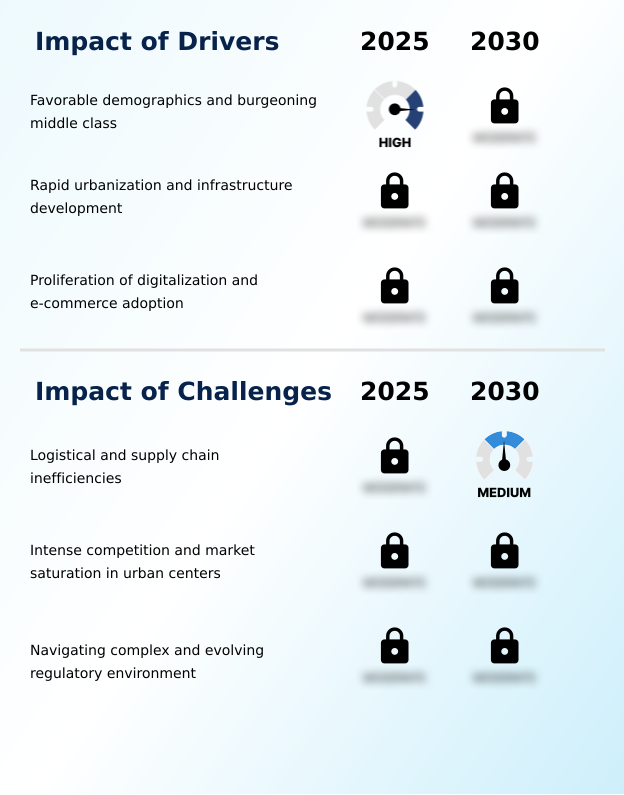
- Favorable demographics and a burgeoning middle class serve as the key drivers for market expansion.
- Market growth is driven by a focus on enhancing customer lifetime value through digital transformation in retail. The implementation of click-and-collect services and streamlined in-store returns processing has been shown to reduce cart abandonment rate reduction by up to 20%.
- Retailers are also adopting smart store technology, including augmented reality shopping and virtual reality retail experiences, to engage consumers. These innovations are critical for reaching areas with expanding rural retail distribution.
- A core component of this shift is supply chain modernization, which supports these new service models. However, this also brings challenges related to retail data security and the need to comply with evolving consumer privacy regulations.
- Furthermore, there's a growing emphasis on sustainable retail practices, which can improve brand perception and attract a loyal customer base, with sustainably marketed products seeing a 2.7x faster growth rate.
What are the market trends shaping the Vietnam Retail Industry?
- A defining trend shaping the market is the ascendancy of experiential retail. This approach transforms physical stores into dynamic destinations to foster deeper brand loyalty.
- Key trends are reshaping the retail landscape, particularly within the fashion apparel market and home and garden goods sector. The expansion of the digital payment ecosystem, including the rising adoption of point-of-sale credit, is a major factor.
- This shift enables retailers in convenience store networks and those managing luxury goods sector to leverage customer data analytics for highly effective personalized marketing automation. Such data-driven approaches have improved campaign conversion rates by up to 25%.
- Concurrently, there is an intense focus on supply chain efficiency, with businesses using real-time inventory tracking to boost their inventory turnover ratio by 18%. This is vital for urban retail development and shopping mall management, where shelf space is at a premium and consumer demand is high.
What challenges does the Vietnam Retail Industry face during its growth?
- Logistical and supply chain inefficiencies represent a key challenge affecting industry growth.
- Navigating market challenges requires sophisticated operational strategies. Effective retail real estate management is crucial as automated fulfillment centers are integrated closer to urban areas. Companies are using predictive purchase analysis and dynamic pricing models to respond to shifting consumer behavior insights. This data informs product assortment planning, with firms using demand forecasting algorithms reducing forecast errors by up to 30%.
- Meeting consumer demand for a green product assortment and adhering to ethical sourcing standards are now table stakes, especially in wellness-oriented retail. These challenges necessitate significant retail infrastructure investment, particularly in strengthening e-commerce payment gateways to support the surge in mobile wallet adoption, which has grown by over 40% in the last two years.
Exclusive Technavio Analysis on Customer Landscape
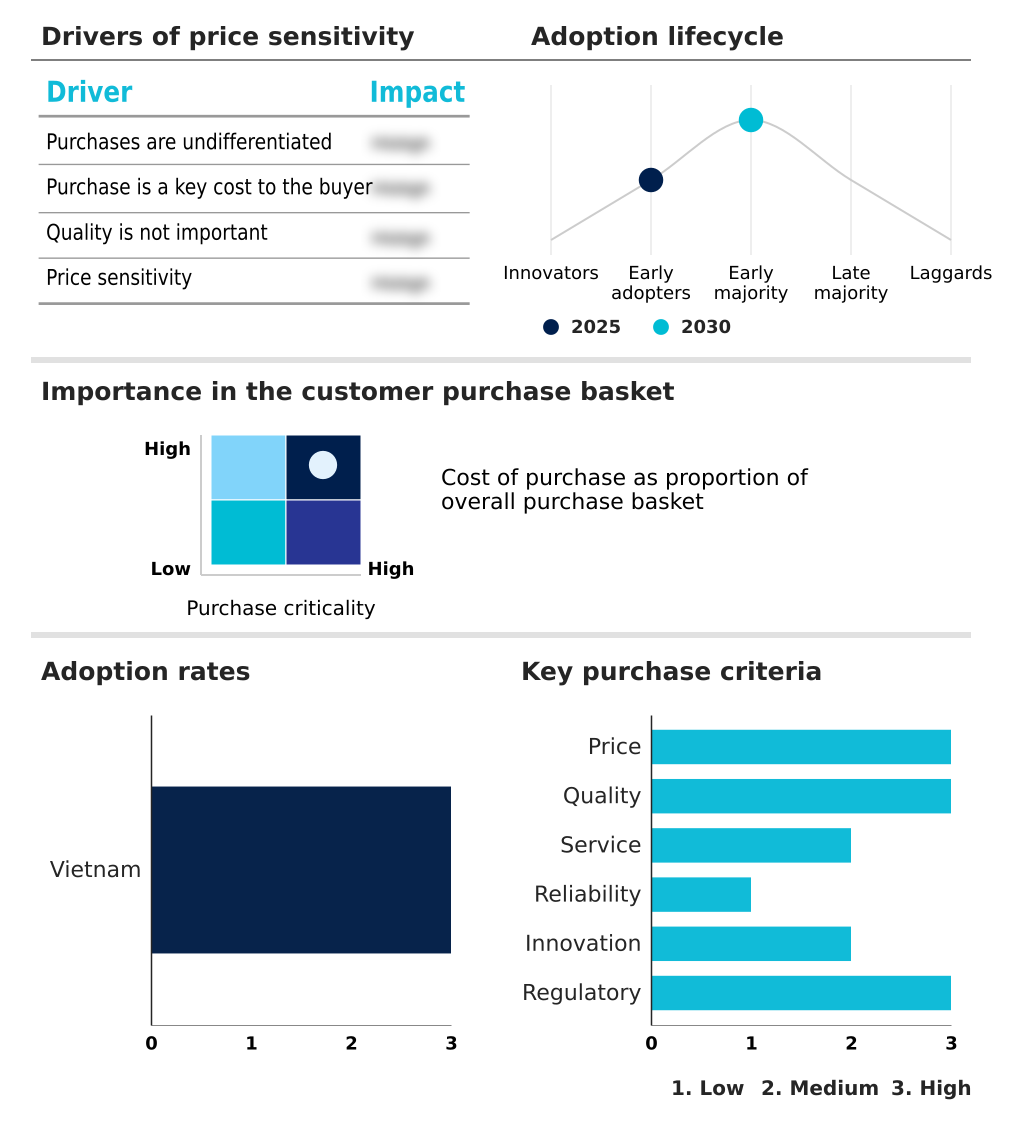
The vietnam retail market forecasting report includes the adoption lifecycle of the market, covering from the innovator’s stage to the laggard’s stage. It focuses on adoption rates in different regions based on penetration. Furthermore, the vietnam retail market report also includes key purchase criteria and drivers of price sensitivity to help companies evaluate and develop their market growth analysis strategies.
Customer Landscape of Vietnam Retail Industry
Competitive Landscape
Companies are implementing various strategies, such as strategic alliances, vietnam retail market forecast, partnerships, mergers and acquisitions, geographical expansion, and product/service launches, to enhance their presence in the industry.
7 Eleven Inc. - Provides a diverse range of convenience items, including fresh foods, beverages, and ready-to-eat meals, catering to immediate consumer needs.
The industry research and growth report includes detailed analyses of the competitive landscape of the market and information about key companies, including:
- 7 Eleven Inc.
- An Phuoc Garment Company
- Bach Hoa Xanh JSC
- Canifa Fashion JSC
- Circle K Stores Inc.
- Con Cung JSC
- DOJI Group
- FPT Retail JSC
- GS25 Vietnam LLC
- Guardian Vietnam
- Juno Fashion Company
- Kids Plaza JSC
- Medicare Vietnam
- Mobile World Investment Corp.
- Phu Nhuan Jewelry JSC
- Saigon Cooperatives
- The Blues Fashion
- Vascara
- Vincom Retail JSC
- WinCommerce JSC
Qualitative and quantitative analysis of companies has been conducted to help clients understand the wider business environment as well as the strengths and weaknesses of key industry players. Data is qualitatively analyzed to categorize companies as pure play, category-focused, industry-focused, and diversified; it is quantitatively analyzed to categorize companies as dominant, leading, strong, tentative, and weak.
Recent Development and News in Vietnam retail market
- In April 2025, Vincom Retail JSC leadership affirmed the company's decision to prioritize capital for land fund expansion to capitalize on emerging retail opportunities.
- In February 2025, Phu Nhuan Jewelry JSC appointed a new chief executive officer as part of a strategic initiative aimed at capturing growing demand from an increasingly affluent consumer base.
- In January 2025, Vincom Retail JSC announced the launch of its Vincom Collection brand, focusing on creating experience-oriented commercial streets in major urban and tourist centers.
- In November 2024, Mobile World Investment Corp. announced a major strategic partnership to enhance its supply chain and cold chain capabilities for its Bach Hoa Xanh grocery chain.
Dive into Technavio’s robust research methodology, blending expert interviews, extensive data synthesis, and validated models for unparalleled Vietnam Retail Market insights. See full methodology.
| Market Scope | |
|---|---|
| Page number | 183 |
| Base year | 2025 |
| Historic period | 2020-2024 |
| Forecast period | 2026-2030 |
| Growth momentum & CAGR | Accelerate at a CAGR of 15.1% |
| Market growth 2026-2030 | USD 323.5 billion |
| Market structure | Fragmented |
| YoY growth 2025-2026(%) | 13.3% |
| Key countries | Vietnam |
| Competitive landscape | Leading Companies, Market Positioning of Companies, Competitive Strategies, and Industry Risks |
Research Analyst Overview
- The market's evolution is dictated by the imperative to build a seamless omnichannel strategy, merging brick-and-mortar operations with a sophisticated digital commerce platform. A successful omnichannel customer experience now requires social commerce integration and advanced mobile commerce applications.
- Operationally, this demands excellence in last-mile delivery optimization and robust cold chain management, supported by a modern warehouse management system and real-time inventory tracking to improve the inventory turnover ratio. Financially, the growth of the digital payment ecosystem, including contactless payment systems and QR code payment integration, enables new models like point-of-sale credit.
- The strategic use of customer data analytics, powered by customer relationship management software, allows for predictive purchase analysis and personalized marketing automation, which are key to increasing customer lifetime value. Firms are using this consumer behavior insights for better product assortment planning and employing dynamic pricing models based on demand forecasting algorithms.
- The focus is also on process efficiency, with click-and-collect services and streamlined in-store returns processing helping with cart abandonment rate reduction. To enhance engagement, businesses are implementing smart store technology, augmented reality shopping, and virtual reality retail within their digital storefront development, with some achieving a 30% reduction in customer service response times.
- This entire ecosystem is governed by loyalty program management and strategic retail real estate management to ensure profitability in automated fulfillment centers.
What are the Key Data Covered in this Vietnam Retail Market Research and Growth Report?
-
What is the expected growth of the Vietnam Retail Market between 2026 and 2030?
-
USD 323.5 billion, at a CAGR of 15.1%
-
-
What segmentation does the market report cover?
-
The report is segmented by Distribution Channel (Offline, and Online), Type (Grocery, Electronics and appliances, Home and garden, Health and beauty, and Others), Channel (Digital payment, Cash, and Buy now pay later (BNPL)) and Geography (APAC)
-
-
Which regions are analyzed in the report?
-
APAC
-
-
What are the key growth drivers and market challenges?
-
Favorable demographics and burgeoning middle class, Logistical and supply chain inefficiencies
-
-
Who are the major players in the Vietnam Retail Market?
-
7 Eleven Inc., An Phuoc Garment Company, Bach Hoa Xanh JSC, Canifa Fashion JSC, Circle K Stores Inc., Con Cung JSC, DOJI Group, FPT Retail JSC, GS25 Vietnam LLC, Guardian Vietnam, Juno Fashion Company, Kids Plaza JSC, Medicare Vietnam, Mobile World Investment Corp., Phu Nhuan Jewelry JSC, Saigon Cooperatives, The Blues Fashion, Vascara, Vincom Retail JSC and WinCommerce JSC
-
Market Research Insights
- The market is characterized by a rapid shift toward modern retail formats, displacing traditional trade channels as the organized retail sector expands. This digital transformation in retail is creating opportunities across the consumer electronics retail, grocery retail chains, and the fashion apparel market.
- Adherence to new consumer privacy regulations and retail data security protocols has become a key differentiator, with compliant firms seeing a 15% higher customer trust rating. The push for supply chain modernization and sustainable retail practices is reshaping sourcing and logistics.
- Meanwhile, intense competition and retail market saturation in prime locations drive up real estate rental costs, forcing innovation in customer engagement strategies and brand equity management to stand out. Navigating this environment requires agile responses to competitive pricing strategies and a deep understanding of the regulatory compliance framework.
We can help! Our analysts can customize this vietnam retail market research report to meet your requirements.
 RIA -
RIA - 
