Thailand Retail Market Size 2025-2029
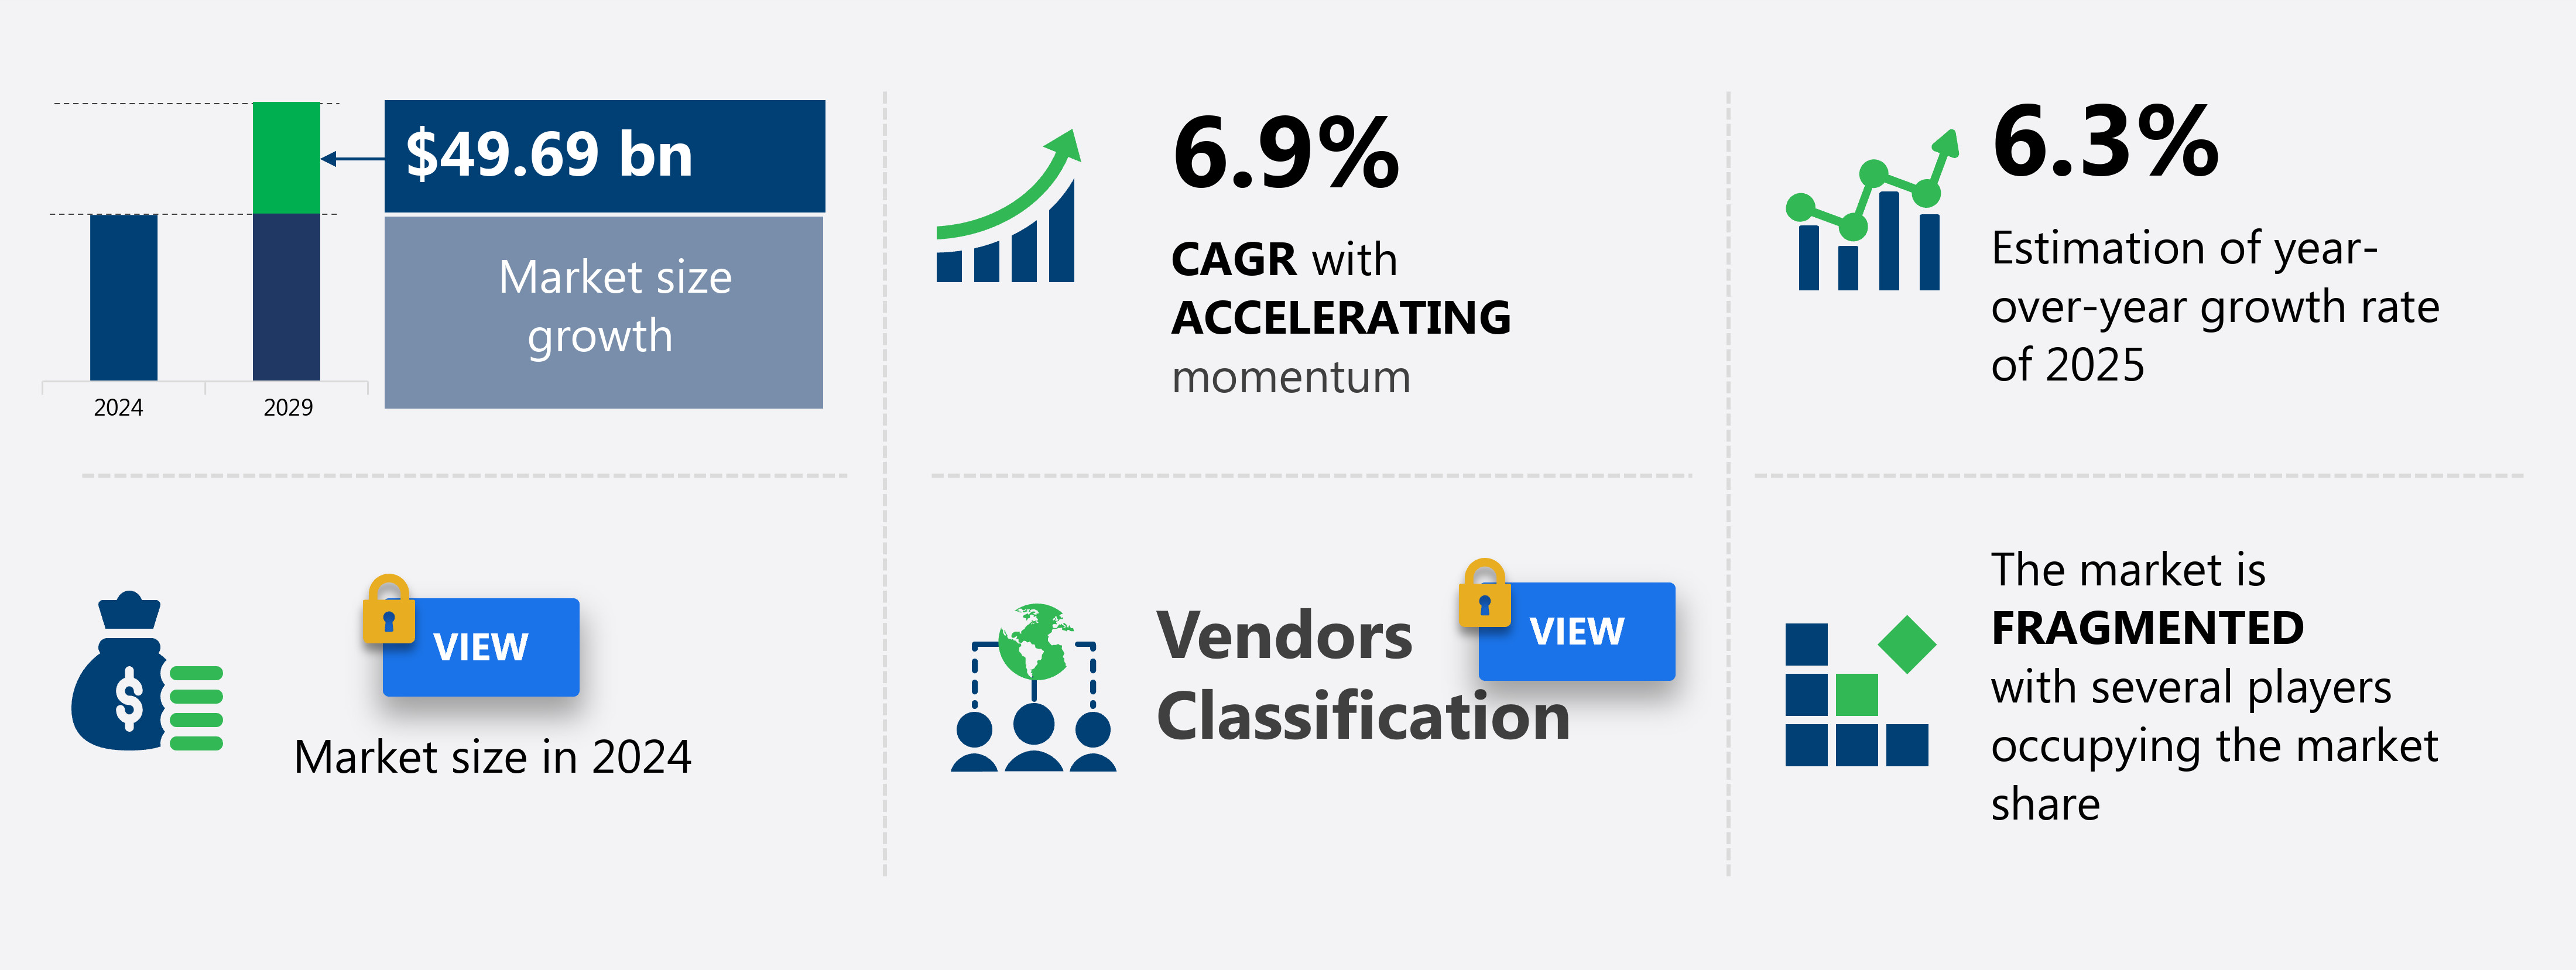
The Thailand retail market size is forecast to increase by USD 49.69 billion at a CAGR of 6.9% between 2024 and 2029.
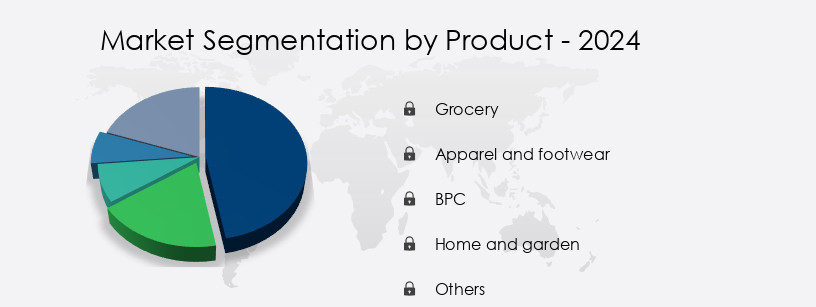
- The Retail Market in Thailand is segmented by product (grocery, apparel and footwear, BPC, home and garden, others), distribution channel (offline, online), pricing scheme (cash, digital payment, buy now pay later), and geography (APAC: Thailand). This segmentation reflects the market's growth, driven by increasing demand for grocery and BPC products, a shift toward online channels, and the rising adoption of digital payment and buy now pay later schemes in Thailand.
- The market is experiencing significant growth, driven primarily by the increasing demand for convenience food products. This trend is influenced by the busy lifestyles and hectic schedules of consumers, who seek quick and easy meal solutions. Additionally, the surge in sales through online distribution channels is further fueling market expansion. However, this market landscape is not without challenges. The proliferation of counterfeit products poses a significant threat to both consumers and legitimate retailers. These counterfeit goods not only undermine brand reputation but also compromise consumer safety.
- Retailers must navigate this issue by implementing robust anti-counterfeit measures and collaborating with authorities to protect their brands and maintain consumer trust. To capitalize on market opportunities and effectively manage challenges, retailers must stay agile and responsive, focusing on innovation, quality, and customer experience.
What will be the size of the Thailand Retail Market during the forecast period?
Explore in-depth regional segment analysis with market size data - historical 2019-2023 and forecasts 2025-2029 - in the full report.
Request Free Sample
- In the dynamic Thai retail market, personalized recommendations and retail marketing automation are driving customer engagement, with digital wallets and mobile payments simplifying transactions. Inventory optimization and supply chain optimization ensure stock availability, while sustainable packaging and the circular economy align with eco-conscious consumers' preferences. Social commerce and location-based marketing expand reach, and retail analytics software provides valuable insights. Mobile POS, multi-channel marketing, and customer journey optimization enhance the shopping experience.
- Data privacy and e-commerce security are essential considerations, with price optimization ensuring competitiveness. Voice assistants, big data analytics, virtual try-on, and customer service automation further enhance the retail landscape. Cloud-based retail solutions and smart shopping enable seamless operations, and live shopping offers real-time interaction, revolutionizing retail trends.
How is this market segmented?
The market research report provides comprehensive data (region-wise segment analysis), with forecasts and estimates in "USD billion" for the period 2025-2029, as well as historical data from 2019-2023 for the following segments.
- Product
- Grocery
- Apparel and footwear
- BPC
- Home and garden
- Others
- Distribution Channel
- Offline
- Online
- Pricing Scheme
- Cash
- Digital payment
- Buy now pay later
- Geography
- APAC
- Thailand
- APAC
By Product Insights
The grocery segment is estimated to witness significant growth during the forecast period.
In Thailand's dynamic retail market, various sectors experience significant growth. The grocery segment, a major contributor to sales, witnesses robust expansion due to increasing consumer numbers and the entry of both domestic and international retailers. Convenience stores, in particular, thrive due to the rising preference for purchasing daily grocery requirements from nearby shops. Hypermarkets, supermarkets, and other retail outlets also expand rapidly, catering to consumers seeking a wide range of household groceries under one roof. Digital signage and retail technology enhance the shopping experience, while ethical sourcing and retail compliance ensure transparency and sustainability. Retail automation, machine learning, and predictive analytics streamline retail operations and sales forecasting.
Customer journey mapping and segmentation, along with personalized customer experiences, boost customer engagement. Retail disruption comes from disruptive technologies like mobile apps, virtual reality, augmented reality, and e-commerce platforms. Omnichannel retailing, logistics and distribution, and digital marketing services create seamless shopping experiences. Inventory management software, online payment gateways, and employee scheduling tools optimize retail operations. Retail security, loss prevention, and fraud detection ensure business continuity and customer trust. Staff training, in-store technology, and rfid technology improve operational efficiency. Smart shelves, shopper insights, and retail signage cater to evolving shopping habits. Emerging technologies like artificial intelligence, point-of-sale systems, visual merchandising, and interactive kiosks further enrich the retail landscape.
Supply chain management, business intelligence, and data analytics provide valuable insights for strategic decision-making. Barcode scanning and retail analytics streamline operations and enhance customer experiences. Retail disruption continues as retailers adapt to changing consumer preferences and market trends. The future of retail in Thailand lies in embracing technology, focusing on customer experience, and ensuring ethical and sustainable business practices.
The Grocery segment was valued at USD 72.73 billion in 2019 and showed a gradual increase during the forecast period.
Market Dynamics
The Thailand Retail Market is experiencing dynamic growth, propelled by the surge in Thailand E-commerce and evolving Thai Consumer Spending Habits. Businesses are increasingly adopting Omnichannel Retail Thailand strategies, integrating physical and digital touchpoints to cater to modern shoppers. The widespread adoption of Digital Payment Thailand solutions and the integration of AI in Thai Retail are revolutionizing operations. Luxury Retail Thailand in Bangkok Shopping Malls continues to attract high-value consumers and tourists. Meanwhile, Convenience Stores Thailand remain a cornerstone, adapting alongside the rapid expansion of Online Grocery Thailand. Innovations in Retail Automation Thailand are enhancing efficiency. Understanding the preferences of Thai Gen Z Consumers and the shift towards Sustainable Retail Thailand are crucial. The market is also benefiting from Cross-border E-commerce Thailand and a recovering Tourism Impact Thailand Retail. Leveraging Retail Technology Thailand, particularly Data Analytics Retail Thailand, is key for informed decisions. The rise of Mobile Commerce Thailand reflects broader Retail Trends Thailand, all contributing to a positive Thai Retail Market Forecast.
Our researchers analyzed the data with 2024 as the base year, along with the key drivers, trends, and challenges. A holistic analysis of drivers will help companies refine their marketing strategies to gain a competitive advantage.
What are the Thailand Retail Market market drivers leading to the rise in adoption of the Industry?
- The increasing preference for convenient food solutions is the primary market motivator, driven by consumers' busy lifestyles and the growing trend toward ready-to-eat or ready-to-heat meals.
- In Thailand's retail sector, consumer behavior is evolving as a result of digital advancements and changing lifestyles. Convenience is a significant factor influencing purchasing decisions, leading to the increasing popularity of delivery services for various retail categories. Retail technology plays a crucial role in enhancing retail operations, from digital signage and inventory management software to retail automation and sales forecasting. Moreover, ethical sourcing and green retailing are becoming essential components of retail compliance, resonating with consumers' growing concerns for sustainability. Customer journey mapping is another area of focus for retailers, aiming to provide a seamless shopping experience and improve customer satisfaction.
- Retail technology continues to transform the industry, with retailers adopting innovative solutions to streamline processes, optimize resources, and stay competitive. The Thai retail market is experiencing dynamic changes driven by consumer preferences, technological advancements, and regulatory requirements. Retailers must stay informed and adapt to these trends to cater to the evolving needs of their customers and maintain a competitive edge.
What are the Thailand Retail Market market trends shaping the Industry?
- The surge in sales through online distribution channels is a notable market trend. This trend signifies a significant shift towards e-commerce and digital marketing in today's business landscape.
- In Thailand's retail market, online sales have experienced significant growth, with both established and private retailers effectively selling products through digital channels. The elimination of physical stores and associated costs, such as merchandise, salespeople, and inventory, has led retailers to prioritize online sales. Additionally, the increasing penetration of the internet and smartphones in Thailand provides an opportunity for retailers to expand their reach. Consumers, particularly working women, nuclear families, and those with busy lifestyles, are increasingly choosing online shopping for its time-saving and convenient nature, especially for daily FMCG needs. To enhance the customer experience, retailers are implementing disruptive technologies such as online payment gateways, machine learning for customer segmentation and personalized marketing, and point-of-sale systems.
- Store management tools, including employee scheduling and visual merchandising, are also being adopted to optimize operations. Virtual reality and omnichannel retailing are emerging trends, offering immersive shopping experiences and seamless integration of online and offline channels. Furthermore, supply chain management and business intelligence tools are essential for retailers to gain insights into market trends and customer behavior, enabling informed decision-making and competitive advantage.
How does Thailand Retail Market market faces challenges face during its growth?
- The proliferation of counterfeit products poses a significant threat to industry growth, requiring vigilant measures to mitigate this challenge and ensure consumer trust in authentic goods remains intact.
- In Thailand's dynamic retail market, emerging technologies are transforming shopping habits and enhancing the customer experience. Retailers are increasingly adopting advanced solutions like barcode scanning, mobile apps, and AI-driven predictive analytics to gain shopper insights and personalize marketing efforts. Loyalty programs and digital marketing services are also becoming essential tools for retailers to engage customers and build brand loyalty. However, the market faces challenges, including the prevalence of counterfeit products. These fake items, available both online and offline, are adversely affecting sales for major retailers and damaging the reputation of genuine manufacturers. To combat this issue, retailers are investing in retail security measures, such as smart shelves and AI-powered surveillance systems.
- Data analytics plays a crucial role in the Thai retail sector, enabling businesses to make informed decisions and optimize operations. By analyzing customer behavior and market trends, retailers can tailor their offerings and pricing strategies to meet consumer demands effectively. Overall, the Thai retail market is an exciting and competitive space, with retailers continually seeking innovative solutions to meet evolving customer needs and stay ahead of the competition.
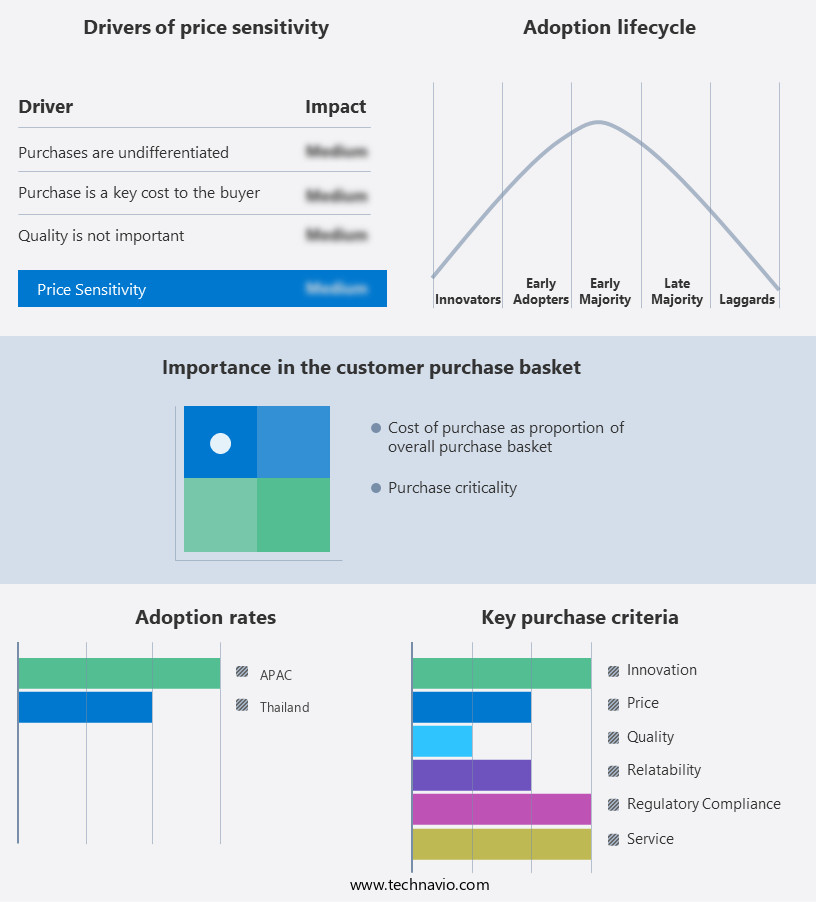
Exclusive Thailand Retail Market Customer Landscape
The market forecasting report includes the adoption lifecycle of the market, covering from the innovator's stage to the laggard's stage. It focuses on adoption rates in different regions based on penetration. Furthermore, the report also includes key purchase criteria and drivers of price sensitivity to help companies evaluate and develop their market growth analysis strategies.
Customer Landscape
Key Companies & Market Insights
Companies are implementing various strategies, such as strategic alliances, market forecast partnerships, mergers and acquisitions, geographical expansion, and product/service launches, to enhance their presence in the market.
The market research and growth report includes detailed analyses of the competitive landscape of the market and information about key companies, including:
- AS Watson Group
- AEON CO. LTD.
- Berli Jucker Public Co. Ltd.
- Central Retail Corp.
- Charoen Pokphand Group Co. Ltd.
- CJ Express Group Co. Ltd.
- Foodland Supermarket Co. Ltd.
- Home Product Center Public Co. Ltd.
- Mitsukoshi
- Rimping Supermarket
- Robinsons Retail Holdings Inc.
- Seven and i Holdings Co. Ltd.
- SPAR International
- Tesco Plc
- The Mall Group Co. Ltd.
- Villa Market JP Co. Ltd.
Qualitative and quantitative analysis of companies has been conducted to help clients understand the wider business environment as well as the strengths and weaknesses of key market players. Data is qualitatively analyzed to categorize companies as pure play, category-focused, industry-focused, and diversified; it is quantitatively analyzed to categorize companies as dominant, leading, strong, tentative, and weak.
Recent Development and News in Retail Market In Thailand
- In February 2023, Central Group, Thailand's largest retailer, announced a strategic partnership with Alibaba Group's Lazada to strengthen their e-commerce presence and expand their reach to a wider customer base (Central Group Press Release). This collaboration aims to leverage Lazada's digital expertise and Central Group's retail experience to provide a seamless shopping experience for customers, both online and offline.
- In March 2024, CP All Public Company Limited, the operator of 7-Eleven convenience stores in Thailand, completed the acquisition of a 51% stake in Tesco Lotus, a major supermarket chain in Thailand, from Tesco PLC for approximately THB 120 billion (Reuters). This deal marked a significant consolidation in the Thai retail sector, creating a formidable force in the market and enabling CP All to expand its product offerings and reach.
- In May 2024, the Thai government launched the "Thailand 4.0" policy, which focuses on promoting innovation, technology, and entrepreneurship in various sectors, including retail (Thai Government Press Release). Under this policy, the government plans to invest in digital infrastructure, support the growth of e-commerce, and encourage the adoption of automation and robotics in retail stores.
- In January 2025, Big C Supercenter, Thailand's second-largest supermarket chain, announced the implementation of RFID technology in its stores to enhance inventory management and improve the shopping experience for customers (Big C Supercenter Press Release). This technological advancement enables real-time tracking of stock levels and automates the checkout process, making shopping more efficient and convenient for customers.
Research Analyst Overview
In the dynamic retail market of Thailand, various sectors continue to evolve as emerging technologies and consumer behaviors shape the industry. Barcode scanning and inventory management software streamline operations, while loyalty programs and data analytics provide valuable insights into customer preferences. Retailers embrace digital signage and visual merchandising to enhance the shopping experience, with mobile apps and online payment gateways enabling seamless transactions. Emerging technologies, such as predictive analytics, artificial intelligence, and machine learning, are revolutionizing sales forecasting and customer segmentation. Retailers implement smart shelves and RFID technology for efficient stock management and loss prevention. Shopping habits are influenced by the integration of mobile commerce, augmented reality, and virtual reality into retail.
Retail security remains a priority, with advanced fraud detection and staff training essential for preventing losses. Store design and layout are optimized for the customer journey, with interactive kiosks and digital marketing services used to engage shoppers. Retailers navigate the complexities of retail compliance, supply chain management, and business intelligence to stay competitive. Retail automation and retail technology continue to disrupt traditional retail models, with disruptive technologies such as point-of-sale systems and digital transformation shaping the future of the industry. Ethical sourcing and sustainability are increasingly important considerations for retailers, as consumers demand transparency and accountability. The retail landscape in Thailand remains a vibrant and ever-changing environment, with ongoing innovation and adaptation to market dynamics.
Retailers must stay informed and adaptable to remain competitive and meet the evolving needs of their customers.
Dive into Technavio's robust research methodology, blending expert interviews, extensive data synthesis, and validated models for unparalleled Retail Market in Thailand insights. See full methodology.
|
Market Scope |
|
|
Report Coverage |
Details |
|
Page number |
173 |
|
Base year |
2024 |
|
Historic period |
2019-2023 |
|
Forecast period |
2025-2029 |
|
Growth momentum & CAGR |
Accelerate at a CAGR of 6.9% |
|
Market growth 2025-2029 |
USD 49.69 billion |
|
Market structure |
Fragmented |
|
YoY growth 2024-2025(%) |
6.3 |
|
Competitive landscape |
Leading Companies, Market Positioning of Companies, Competitive Strategies, and Industry Risks |
What are the Key Data Covered in this Market Research Report?
- CAGR of the market during the forecast period
- Detailed information on factors that will drive the market growth and forecasting between 2025 and 2029
- Precise estimation of the size of the market and its contribution of the market in focus to the parent market
- Accurate predictions about upcoming market growth and trends and changes in consumer behaviour
- Growth of the market across Thailand
- Thorough analysis of the market's competitive landscape and detailed information about companies
- Comprehensive analysis of factors that will challenge the growth of market companies
We can help! Our analysts can customize this market research report to meet your requirements Get in touch


