APAC Returnable Transport Packaging Market Analysis - Size and Forecast 2024-2028

APAC Returnable Transport Packaging Market Analysis - Size and Forecast 2024-2028

Published: Nov 2023 156 Pages SKU: IRTNTR46681

Market Overview at a Glance

$1.40 B
Market Opportunity
8.87%
CAGR
8.21
YoY growth 2023-2024(%)

APAC Returnable Transport Packaging Market Size 2024-2028 

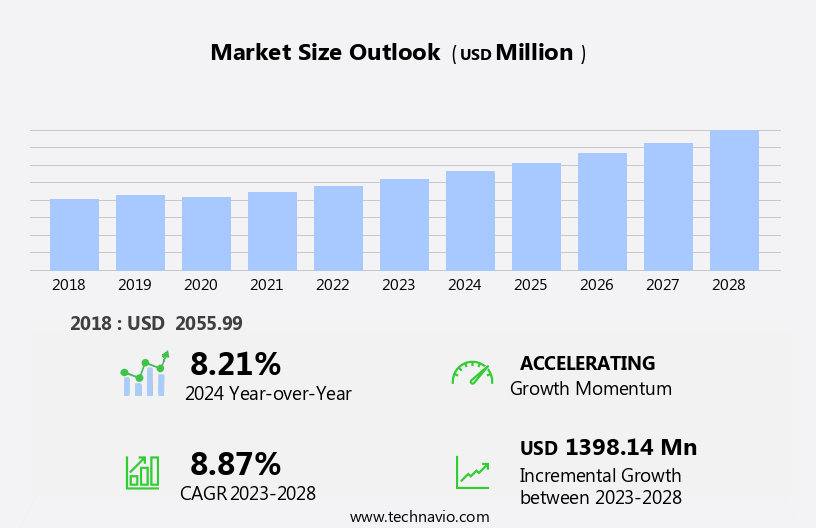
The APAC returnable transport packaging market size is forecast to increase by USD 1.4 billion at a CAGR of 8.87% between 2023 and 2028.

  • In the Asia-Pacific (APAC) region, the returnable transport packaging (RTP) market is experiencing significant growth. Key factors driving this expansion include the long-term cost savings for buyers, who benefit from the reusability of RTP, and the burgeoning e-commerce sector. The e-commerce industry's rapid growth in APAC presents a substantial opportunity for RTP market growth, as the need for efficient and durable packaging solutions increases. Additionally, RTP offers advantages such as lower handling costs and reduced product damage, making it an attractive option for businesses in the region.  Asset management and reverse logistics play a crucial role in the RTP market, ensuring the durability and standardization of reusable packaging. Overall, the combination of these factors is fueling the growth of the RTP market in APAC.

What will be the size of the APAC Returnable Transport Packaging Market during the forecast period?

Returnable Transport Packaging Market in APAC Size

 Request Free Sample

  • The Returnable Transport Packaging (RTP) market in the Asia Pacific (APAC) region is experiencing significant growth due to the increasing demand for sustainable logistics solutions in the transport, manufacturing, and distribution sectors. RTP, including pallets, containers, crates, totes, IBCs, drums, bins, and bulk containers, plays a crucial role in the circular economy by promoting reverse logistics and cost savings through reuse. The implementation of RFID technology for tracking and efficient management of RTP assets is a key trend driving market growth. The APAC region's vast manufacturing industry and the need for efficient distribution networks further boost the demand for RTP.
  • Sustainability considerations are also a significant factor, as businesses seek to reduce their carbon footprint and minimize waste in the supply chain. The RTP market in APAC offers numerous opportunities for cost savings and improved efficiency. The use of reusable packaging reduces the need for constant procurement and disposal, leading to substantial cost savings. Additionally, the efficient management of RTP assets through RFID technology and reverse logistics initiatives can streamline operations and improve overall supply chain performance. Thus, the market is poised for continued growth due to the increasing demand for sustainable logistics solutions, the need for cost savings, and the implementation of RFID technology for efficient management of RTP assets.

How is this market segmented and which is the largest segment?

The market research report provides comprehensive data (region-wise segment analysis), with forecasts and estimates in "USD billion" for the period 2024-2028, as well as historical data from 2018-2022 for the following segments.

  • Product
    • Containers
    • Pallets
    • Drums and barrels
    • Others
  • End-user
    • Food and beverage industry
    • Manufacturing industry
    • Retail industry
  • Geography
    • APAC
      • China
      • India
      • Japan
      • South Korea

By Product Insights

  • The containers segment is estimated to witness significant growth during the forecast period. The Returnable Transport Packaging (RTP) market in APAC is primarily driven by the logistics and supply chain sectors, with a focus on sustainability and cost savings. Reusable packaging solutions, such as pallets, containers, crates, totes, IBCs, drums, and bins, are integral to the circular economy and reverse logistics processes. Bulk containers are commonly used in agriculture, manufacturing, and distribution industries for efficient handling and transportation. The use of RFID tracking and traceability systems enhances asset tracking and regulatory compliance.
  • Sustainability is a key consideration, with plastic, metal, and wood packaging options offering varying benefits in terms of durability and environmental impact. The retail sector, particularly in countries like China and India with large e-commerce markets and growing middle classes, is a significant demand driver for RTP. The need for efficient and cost-effective packaging solutions in the context of increasing logistics and supply chain complexities is a major trend. Regulations governing packaging waste and green logistics are also influencing market growth. Overall, the RTP market in APAC is expected to continue its expansion, driven by the need for sustainable, cost-effective, and efficient packaging solutions in various industries.

Returnable Transport Packaging Market in APAC Size

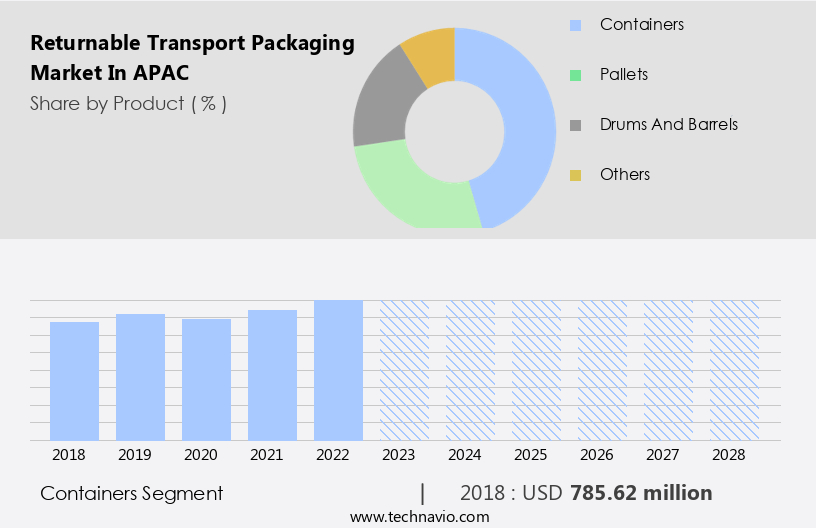
Get a glance at the market share of various segments Request Free Sample

  • The containers segment was valued at  USD 785.62 million in 2018 and showed a gradual increase during the forecast period.

Market Dynamics

Our researchers analyzed the data with 2023 as the base year, along with the key drivers, trends, and challenges. A holistic analysis of drivers will help companies refine their marketing strategies to gain a competitive advantage.

What are the key market drivers leading to the rise in adoption of APAC Returnable Transport Packaging Market?

  • Long-term cost-saving opportunities for buyers is the key driver of the market. In the Asia Pacific (APAC) region, the market for returnable transport packaging (RTP) solutions has gained significant traction due to their numerous advantages in logistics and supply chain management. These solutions, which include pallets, containers, crates, totes, IBCs, drums, bins, and bulk containers, are primarily manufactured using lightweight materials, such as plastic, to reduce transportation costs. The increasing demand for RTP in developing countries, like India, where most transportation is done via road, is a result of their space-saving benefits during transit. The implementation of returnable transport packaging solutions contributes to sustainability by reducing packaging waste and promoting a circular economy. Asset management and reverse logistics play crucial roles in optimizing the use of these reusable packaging solutions. The long-term cost savings and efficiency gains from using RTP are substantial, with an average lifespan ranging between 15 and 20 years. 
  • The adoption of RTP is not only beneficial for manufacturing and distribution industries but also for sectors like agriculture. The use of RTP in various forms, such as pallets and totes, facilitates efficient handling and transportation. The integration of technologies like RFID, tracking, and traceability further enhances the asset tracking capabilities of RTP, ensuring regulatory compliance and standardization. RTP solutions are available for rental or pooling, offering flexibility to businesses while minimizing their capital investment. The materials used in RTP manufacturing can vary, with plastic, metal, and wood being common choices. The durability and strength of these materials ensure that RTP can withstand the rigors of transportation and handling. The shift towards green logistics and the growing emphasis on sustainability have further fueled the demand for RTP in the APAC region. The regulations governing the use of packaging materials are becoming increasingly stringent, making RTP an attractive alternative to disposable packaging. The adoption of RTP is expected to continue its upward trend during the forecast period, offering substantial cost savings and efficiency gains to businesses.

What are the market trends shaping the APAC Returnable Transport Packaging Market?

  • Increased adoption of returnable transport packaging is the upcoming trend in the market. In the Asia Pacific (APAC) region, the market for Returnable Transport Packaging (RTP) is experiencing significant growth due to various factors. Sustainability is a primary driver, as RTP solutions, including pallets, containers, crates, totes, IBCs, drums, and bins, contribute to the circular economy by reducing packaging waste. Compared to disposable packaging, RTP emits 28%-30% less carbon dioxide, making it an eco-friendly choice for logistics and supply chain operations. RTP offers cost savings through asset management and reverse logistics. The initial investment is higher, but the repeated use of these assets results in long-term efficiency and cost savings. RTP is more durable and stable than disposable packaging, minimizing the risk of damage during handling and transportation.
  • RTP is essential in industries such as agriculture, manufacturing, and distribution, where bulk containers and pallets are commonly used. The use of RTP aligns with the principles of green logistics, promoting a more sustainable approach to logistics and supply chain operations. RTP comes in various materials, including plastic, metal, and wood, catering to different handling and transportation requirements. The standardization and regulations surrounding RTP ensure consistent quality and safety. RTP solutions, such as pallets and containers, can be rented or pooled, providing flexibility for businesses. Advancements in technology, such as RFID and tracking, enable better asset tracking and traceability, enhancing the overall efficiency and effectiveness of RTP in the APAC market.

What challenges does APAC Returnable Transport Packaging Market face during the growth?

  • Fluctuating raw material prices is a key challenge affecting the market growth. In the dynamic returnable transport packaging (RTP) market in Asia Pacific, the use of sustainable packaging solutions, such as reusable pallets, containers, crates, totes, IBCs, drums, and bins, is a significant trend. These packaging solutions are essential for efficient logistics and supply chain operations, particularly in sectors like agriculture, manufacturing, and distribution. The primary raw materials for RTP production are plastic and metal, with plastic accounting for a substantial market share due to its durability, standardization, and ease of handling. However, the cost of raw materials, particularly plastic, is a critical challenge due to the volatility of crude oil prices and high demand from export-centric industries.
  • This price instability can impact the overall cost savings and efficiency of RTP asset management and reverse logistics in the circular economy. Sustainability is a key focus in the RTP industry, with regulations promoting green logistics and the reduction of packaging waste. RFID tracking and traceability systems ensure optimal asset tracking and efficient handling during transportation. Wood is another material used in RTP production, offering advantages in terms of cost and environmental sustainability. Regulations and standardization are crucial factors in the RTP market, ensuring the safe and effective use of these packaging solutions in various industries.

Exclusive APAC Returnable Transport Packaging Market Customer Landscape

The market forecasting report includes the adoption lifecycle of the market, market growth and forecasting, covering from the innovator's stage to the laggard's stage. It focuses on adoption rates in different regions based on penetration. Furthermore, the report also includes key purchase criteria and drivers of price sensitivity to help companies evaluate and develop their market growth analysis strategies.
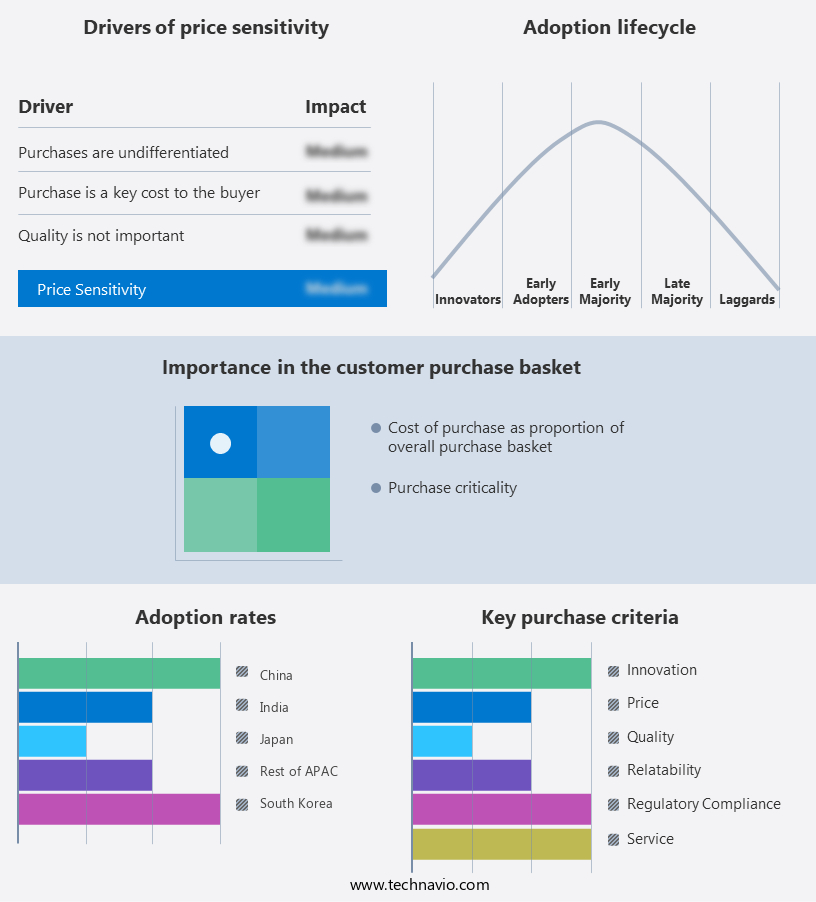
Returnable Transport Packaging Market in APAC Share by Geography

 Customer Landscape

Key Companies & Market Insights

Companies are implementing various strategies, such as strategic alliances, market forecast partnerships, mergers and acquisitions, geographical expansion, and product/service launches, to enhance their presence in the market.

The market research and growth report includes detailed analyses of the competitive landscape of the market and information about key companies, including:

  • Amatech Inc.
  • Balmer Lawrie and Co. Ltd.
  • Berry Global Inc.
  • Brambles Ltd.
  • Bulk Lift International LLC
  • BWAY Corp.
  • CABKA Group GmbH
  • CORDSTRAP BV
  • Craemer GmbH
  • DS Smith Plc
  • Greif Inc.
  • IFCO SYSTEMS GmbH
  • Myers Industries Inc.
  • Rehrig Pacific Co.
  • Schoeller Allibert Services B.V.
  • SCHUTZ GmbH and Co. KGaA
  • Tank Holding Corp.
  • The Supreme Industries Ltd.
  • Time Technoplast Ltd.
  • TranPak Inc.

Qualitative and quantitative analysis of companies has been conducted to help clients understand the wider business environment as well as the strengths and weaknesses of key market players. Data is qualitatively analyzed to categorize companies as pure play, category-focused, industry-focused, and diversified; it is quantitatively analyzed to categorize companies as dominant, leading, strong, tentative, and weak.

Research Analyst Overview

The Returnable Transport Packaging (RTP) market in APAC is a significant sector, encompassing various logistics and supply chain applications. This market caters to the demand for sustainable and cost-effective packaging solutions in industries such as automotive, electronics, pharmaceuticals, and food and beverage. Key players in this market include those that manufacture and supply RTP solutions, such as pallets, containers, and reusable bulk containers. These companies prioritize innovation and technology to create durable and lightweight packaging solutions. The market is driven by factors like increasing globalization, the growing e-commerce industry, and the need for efficient and sustainable supply chain solutions.

Additionally, governments in the APAC region are implementing regulations to reduce waste and promote the use of reusable packaging. The RTP market in APAC is expected to grow at a steady pace due to the increasing demand for just-in-time delivery and the need for efficient and cost-effective logistics solutions. The market is also influenced by factors like the rising trend of automation in manufacturing and the increasing adoption of Industry 4.0 technologies. Thus, the market is a dynamic and growing sector, driven by various factors and applications. Companies in this market focus on innovation and sustainability to cater to the evolving needs of industries and consumers.

Market Scope

Report Coverage

Details

Page number

156

Base year

2023

Historic period

2018-2022

Forecast period

2024-2028

Growth momentum & CAGR

Accelerate at a CAGR of 8.87%

Market growth 2024-2028

USD 1.4 billion

Market structure

Fragmented

YoY growth 2023-2024(%)

8.21

Competitive landscape

Leading Companies, Market Positioning of Companies, Competitive Strategies, and Industry Risks

Request Free Sample

What are the Key Data Covered in this Market Research Report?

  • CAGR of the market during the forecast period
  • Detailed information on factors that will drive the market growth and forecasting between 2024 and 2028
  • Precise estimation of the size of the market  and its contribution of the market in focus to the parent market
  • Accurate predictions about upcoming market growth and trends and changes in consumer behaviour
  • Growth of the market across APAC
  • Thorough analysis of the market's competitive landscape and detailed information about companies
  • Comprehensive analysis of factors that will challenge the growth of market companies

We can help! Our analysts can customize this market research report to meet your requirements Get in touch

1 Executive Summary

  • 1.1 Market overview
    • Exhibit 01: Executive Summary – Chart on Market Overview
    • Exhibit 02: Executive Summary – Data Table on Market Overview
    • Exhibit 03: Executive Summary – Chart on Country Market Characteristics
    • Exhibit 04: Executive Summary – Chart on Market by Geography
    • Exhibit 05: Executive Summary – Chart on Market Segmentation by Product
    • Exhibit 06: Executive Summary – Chart on Market Segmentation by End-user
    • Exhibit 07: Executive Summary – Chart on Incremental Growth
    • Exhibit 08: Executive Summary – Data Table on Incremental Growth
    • Exhibit 09: Executive Summary – Chart on Vendor Market Positioning

2 Market Landscape

  • 2.1 Market ecosystem
    • Exhibit 10: Parent market
    • Exhibit 11: Market Characteristics

3 Market Sizing

  • 3.1 Market definition
    • Exhibit 12: Offerings of vendors included in the market definition
  • 3.2 Market segment analysis
    • Exhibit 13: Market segments
  • 3.3 Market size 2023
    • 3.4 Market outlook: Forecast for 2023-2028
      • Exhibit 14: Chart on APAC - Market size and forecast 2023-2028 ($ million)
      • Exhibit 15: Data Table on Regional - Market size and forecast 2023-2028 ($ million)
      • Exhibit 16: Chart on APAC: Year-over-year growth 2023-2028 (%)
      • Exhibit 17: Data Table on Regional - Market size and forecast 2023-2028 ($ million)

    4 Historic Market Size

    • 4.1 Returnable transport packaging market in APAC 2018 - 2022
      • Exhibit 18: Historic Market Size – Data Table on returnable transport packaging market in APAC 2018 - 2022 ($ million)
    • 4.2 Product Segment Analysis 2018 - 2022
      • Exhibit 19: Historic Market Size – Product Segment 2018 - 2022 ($ million)
    • 4.3 End-user Segment Analysis 2018 - 2022
      • Exhibit 20: Historic Market Size – End-user Segment 2018 - 2022 ($ million)
    • 4.4 Geography Segment Analysis 2018 - 2022
      • Exhibit 21: Historic Market Size – Geography Segment 2018 - 2022 ($ million)

    5 Five Forces Analysis

    • 5.1 Five forces summary
      • Exhibit 22: Five forces analysis - Comparison between 2023 and 2028
    • 5.2 Bargaining power of buyers
      • Exhibit 23: Chart on Bargaining power of buyers – Impact of key factors 2023 and 2028
    • 5.3 Bargaining power of suppliers
      • Exhibit 24: Bargaining power of suppliers – Impact of key factors in 2023 and 2028
    • 5.4 Threat of new entrants
      • Exhibit 25: Threat of new entrants – Impact of key factors in 2023 and 2028
    • 5.5 Threat of substitutes
      • Exhibit 26: Threat of substitutes – Impact of key factors in 2023 and 2028
    • 5.6 Threat of rivalry
      • Exhibit 27: Threat of rivalry – Impact of key factors in 2023 and 2028
    • 5.7 Market condition
      • Exhibit 28: Chart on Market condition - Five forces 2023 and 2028

    6 Market Segmentation by Product

    • 6.1 Market segments
      • Exhibit 29: Chart on Product - Market share 2023-2028 (%)
      • Exhibit 30: Data Table on Product - Market share 2023-2028 (%)
    • 6.2 Comparison by Product
      • Exhibit 31: Chart on Comparison by Product
      • Exhibit 32: Data Table on Comparison by Product
    • 6.3 Containers - Market size and forecast 2023-2028
      • Exhibit 33: Chart on Containers - Market size and forecast 2023-2028 ($ million)
      • Exhibit 34: Data Table on Containers - Market size and forecast 2023-2028 ($ million)
      • Exhibit 35: Chart on Containers - Year-over-year growth 2023-2028 (%)
      • Exhibit 36: Data Table on Containers - Year-over-year growth 2023-2028 (%)
    • 6.4 Pallets - Market size and forecast 2023-2028
      • Exhibit 37: Chart on Pallets - Market size and forecast 2023-2028 ($ million)
      • Exhibit 38: Data Table on Pallets - Market size and forecast 2023-2028 ($ million)
      • Exhibit 39: Chart on Pallets - Year-over-year growth 2023-2028 (%)
      • Exhibit 40: Data Table on Pallets - Year-over-year growth 2023-2028 (%)
    • 6.5 Drums and barrels - Market size and forecast 2023-2028
      • Exhibit 41: Chart on Drums and barrels - Market size and forecast 2023-2028 ($ million)
      • Exhibit 42: Data Table on Drums and barrels - Market size and forecast 2023-2028 ($ million)
      • Exhibit 43: Chart on Drums and barrels - Year-over-year growth 2023-2028 (%)
      • Exhibit 44: Data Table on Drums and barrels - Year-over-year growth 2023-2028 (%)
    • 6.6 Others - Market size and forecast 2023-2028
      • Exhibit 45: Chart on Others - Market size and forecast 2023-2028 ($ million)
      • Exhibit 46: Data Table on Others - Market size and forecast 2023-2028 ($ million)
      • Exhibit 47: Chart on Others - Year-over-year growth 2023-2028 (%)
      • Exhibit 48: Data Table on Others - Year-over-year growth 2023-2028 (%)
    • 6.7 Market opportunity by Product
      • Exhibit 49: Market opportunity by Product ($ million)
      • Exhibit 50: Data Table on Market opportunity by Product ($ million)

    7 Market Segmentation by End-user

    • 7.1 Market segments
      • Exhibit 51: Chart on End-user - Market share 2023-2028 (%)
      • Exhibit 52: Data Table on End-user - Market share 2023-2028 (%)
    • 7.2 Comparison by End-user
      • Exhibit 53: Chart on Comparison by End-user
      • Exhibit 54: Data Table on Comparison by End-user
    • 7.3 Food and beverage industry - Market size and forecast 2023-2028
      • Exhibit 55: Chart on Food and beverage industry - Market size and forecast 2023-2028 ($ million)
      • Exhibit 56: Data Table on Food and beverage industry - Market size and forecast 2023-2028 ($ million)
      • Exhibit 57: Chart on Food and beverage industry - Year-over-year growth 2023-2028 (%)
      • Exhibit 58: Data Table on Food and beverage industry - Year-over-year growth 2023-2028 (%)
    • 7.4 Manufacturing industry - Market size and forecast 2023-2028
      • Exhibit 59: Chart on Manufacturing industry - Market size and forecast 2023-2028 ($ million)
      • Exhibit 60: Data Table on Manufacturing industry - Market size and forecast 2023-2028 ($ million)
      • Exhibit 61: Chart on Manufacturing industry - Year-over-year growth 2023-2028 (%)
      • Exhibit 62: Data Table on Manufacturing industry - Year-over-year growth 2023-2028 (%)
    • 7.5 Retail industry - Market size and forecast 2023-2028
      • Exhibit 63: Chart on Retail industry - Market size and forecast 2023-2028 ($ million)
      • Exhibit 64: Data Table on Retail industry - Market size and forecast 2023-2028 ($ million)
      • Exhibit 65: Chart on Retail industry - Year-over-year growth 2023-2028 (%)
      • Exhibit 66: Data Table on Retail industry - Year-over-year growth 2023-2028 (%)
    • 7.6 Market opportunity by End-user
      • Exhibit 67: Market opportunity by End-user ($ million)
      • Exhibit 68: Data Table on Market opportunity by End-user ($ million)

    8 Customer Landscape

    • 8.1 Customer landscape overview
      • Exhibit 69: Analysis of price sensitivity, lifecycle, customer purchase basket, adoption rates, and purchase criteria

    9 Geographic Landscape

    • 9.1 Geographic segmentation
      • Exhibit 70: Chart on Market share by geography - 2023-2028 (%)
      • Exhibit 71: Data Table on Market share by geography - 2023-2028 (%)
    • 9.2 Geographic comparison
      • Exhibit 72: Chart on Geographic comparison
      • Exhibit 73: Data Table on Geographic comparison
    • 9.3 China - Market size and forecast 2023-2028
      • Exhibit 74: Chart on China - Market size and forecast 2023-2028 ($ million)
      • Exhibit 75: Data Table on China - Market size and forecast 2023-2028 ($ million)
      • Exhibit 76: Chart on China - Year-over-year growth 2023-2028 (%)
      • Exhibit 77: Data Table on China - Year-over-year growth 2023-2028 (%)
    • 9.4 Japan - Market size and forecast 2023-2028
      • Exhibit 78: Chart on Japan - Market size and forecast 2023-2028 ($ million)
      • Exhibit 79: Data Table on Japan - Market size and forecast 2023-2028 ($ million)
      • Exhibit 80: Chart on Japan - Year-over-year growth 2023-2028 (%)
      • Exhibit 81: Data Table on Japan - Year-over-year growth 2023-2028 (%)
    • 9.5 India - Market size and forecast 2023-2028
      • Exhibit 82: Chart on India - Market size and forecast 2023-2028 ($ million)
      • Exhibit 83: Data Table on India - Market size and forecast 2023-2028 ($ million)
      • Exhibit 84: Chart on India - Year-over-year growth 2023-2028 (%)
      • Exhibit 85: Data Table on India - Year-over-year growth 2023-2028 (%)
    • 9.6 South Korea - Market size and forecast 2023-2028
      • Exhibit 86: Chart on South Korea - Market size and forecast 2023-2028 ($ million)
      • Exhibit 87: Data Table on South Korea - Market size and forecast 2023-2028 ($ million)
      • Exhibit 88: Chart on South Korea - Year-over-year growth 2023-2028 (%)
      • Exhibit 89: Data Table on South Korea - Year-over-year growth 2023-2028 (%)
    • 9.7 Rest of APAC - Market size and forecast 2023-2028
      • Exhibit 90: Chart on Rest of APAC - Market size and forecast 2023-2028 ($ million)
      • Exhibit 91: Data Table on Rest of APAC - Market size and forecast 2023-2028 ($ million)
      • Exhibit 92: Chart on Rest of APAC - Year-over-year growth 2023-2028 (%)
      • Exhibit 93: Data Table on Rest of APAC - Year-over-year growth 2023-2028 (%)
    • 9.8 Market opportunity by geography
      • Exhibit 94: Market opportunity by geography ($ million)
      • Exhibit 95: Data Table on Market opportunity by geography ($ million)

    10 Drivers, Challenges, and Trends

    • 10.1 Market drivers
      • 10.2 Market challenges
        • 10.3 Impact of drivers and challenges
          • Exhibit 96: Impact of drivers and challenges in 2023 and 2028
        • 10.4 Market trends

          11 Vendor Landscape

          • 11.1 Overview
            • 11.2 Vendor landscape
              • Exhibit 97: Overview on Criticality of inputs and Factors of differentiation
            • 11.3 Landscape disruption
              • Exhibit 98: Overview on factors of disruption
            • 11.4 Industry risks
              • Exhibit 99: Impact of key risks on business

            12 Vendor Analysis

            • 12.1 Vendors covered
              • Exhibit 100: Vendors covered
            • 12.2 Market positioning of vendors
              • Exhibit 101: Matrix on vendor position and classification
            • 12.3 Balmer Lawrie and Co. Ltd.
              • Exhibit 102: Balmer Lawrie and Co. Ltd. - Overview
              • Exhibit 103: Balmer Lawrie and Co. Ltd. - Business segments
              • Exhibit 104: Balmer Lawrie and Co. Ltd. - Key offerings
              • Exhibit 105: Balmer Lawrie and Co. Ltd. - Segment focus
            • 12.4 Berry Global Inc.
              • Exhibit 106: Berry Global Inc. - Overview
              • Exhibit 107: Berry Global Inc. - Business segments
              • Exhibit 108: Berry Global Inc. - Key news
              • Exhibit 109: Berry Global Inc. - Key offerings
              • Exhibit 110: Berry Global Inc. - Segment focus
            • 12.5 Brambles Ltd.
              • Exhibit 111: Brambles Ltd. - Overview
              • Exhibit 112: Brambles Ltd. - Business segments
              • Exhibit 113: Brambles Ltd. - Key offerings
              • Exhibit 114: Brambles Ltd. - Segment focus
            • 12.6 BWAY Corp.
              • Exhibit 115: BWAY Corp. - Overview
              • Exhibit 116: BWAY Corp. - Product / Service
              • Exhibit 117: BWAY Corp. - Key offerings
            • 12.7 CABKA Group GmbH
              • Exhibit 118: CABKA Group GmbH - Overview
              • Exhibit 119: CABKA Group GmbH - Product / Service
              • Exhibit 120: CABKA Group GmbH - Key offerings
            • 12.8 CORDSTRAP BV
              • Exhibit 121: CORDSTRAP BV - Overview
              • Exhibit 122: CORDSTRAP BV - Product / Service
              • Exhibit 123: CORDSTRAP BV - Key offerings
            • 12.9 Craemer GmbH
              • Exhibit 124: Craemer GmbH - Overview
              • Exhibit 125: Craemer GmbH - Product / Service
              • Exhibit 126: Craemer GmbH - Key offerings
            • 12.10 DS Smith Plc
              • Exhibit 127: DS Smith Plc - Overview
              • Exhibit 128: DS Smith Plc - Business segments
              • Exhibit 129: DS Smith Plc - Key news
              • Exhibit 130: DS Smith Plc - Key offerings
              • Exhibit 131: DS Smith Plc - Segment focus
            • 12.11 Greif Inc.
              • Exhibit 132: Greif Inc. - Overview
              • Exhibit 133: Greif Inc. - Business segments
              • Exhibit 134: Greif Inc. - Key offerings
              • Exhibit 135: Greif Inc. - Segment focus
            • 12.12 IFCO SYSTEMS GmbH
              • Exhibit 136: IFCO SYSTEMS GmbH - Overview
              • Exhibit 137: IFCO SYSTEMS GmbH - Product / Service
              • Exhibit 138: IFCO SYSTEMS GmbH - Key offerings
            • 12.13 Schoeller Allibert Services B.V.
              • Exhibit 139: Schoeller Allibert Services B.V. - Overview
              • Exhibit 140: Schoeller Allibert Services B.V. - Product / Service
              • Exhibit 141: Schoeller Allibert Services B.V. - Key offerings
            • 12.14 SCHUTZ GmbH and Co. KGaA
              • Exhibit 142: SCHUTZ GmbH and Co. KGaA - Overview
              • Exhibit 143: SCHUTZ GmbH and Co. KGaA - Product / Service
              • Exhibit 144: SCHUTZ GmbH and Co. KGaA - Key offerings
            • 12.15 The Supreme Industries Ltd.
              • Exhibit 145: The Supreme Industries Ltd. - Overview
              • Exhibit 146: The Supreme Industries Ltd. - Business segments
              • Exhibit 147: The Supreme Industries Ltd. - Key offerings
              • Exhibit 148: The Supreme Industries Ltd. - Segment focus
            • 12.16 Time Technoplast Ltd.
              • Exhibit 149: Time Technoplast Ltd. - Overview
              • Exhibit 150: Time Technoplast Ltd. - Product / Service
              • Exhibit 151: Time Technoplast Ltd. - Key offerings
            • 12.17 TranPak Inc.
              • Exhibit 152: TranPak Inc. - Overview
              • Exhibit 153: TranPak Inc. - Product / Service
              • Exhibit 154: TranPak Inc. - Key offerings

            13 Appendix

            • 13.1 Scope of the report
              • 13.2 Inclusions and exclusions checklist
                • Exhibit 155: Inclusions checklist
                • Exhibit 156: Exclusions checklist
              • 13.3 Currency conversion rates for US$
                • Exhibit 157: Currency conversion rates for US$
              • 13.4 Research methodology
                • Exhibit 158: Research methodology
                • Exhibit 159: Validation techniques employed for market sizing
                • Exhibit 160: Information sources
              • 13.5 List of abbreviations
                • Exhibit 161: List of abbreviations

              Research Methodology

              Technavio presents a detailed picture of the market by way of study, synthesis, and summation of data from multiple sources. The analysts have presented the various facets of the market with a particular focus on identifying the key industry influencers. The data thus presented is comprehensive, reliable, and the result of extensive research, both primary and secondary.

              INFORMATION SOURCES

              Primary sources

              • Manufacturers and suppliers
              • Channel partners
              • Industry experts
              • Strategic decision makers

              Secondary sources

              • Industry journals and periodicals
              • Government data
              • Financial reports of key industry players
              • Historical data
              • Press releases

              DATA ANALYSIS

              Data Synthesis

              • Collation of data
              • Estimation of key figures
              • Analysis of derived insights

              Data Validation

              • Triangulation with data models
              • Reference against proprietary databases
              • Corroboration with industry experts

              REPORT WRITING

              Qualitative

              • Market drivers
              • Market challenges
              • Market trends
              • Five forces analysis

              Quantitative

              • Market size and forecast
              • Market segmentation
              • Geographical insights
              • Competitive landscape

              Interested in this report?

              Get your sample now to see our research methodology and insights!

              Download Now

              Frequently Asked Questions

              Returnable Transport Packagingin APAC market growth will increase by $ 1398.14 mn during 2024-2028.

              The Returnable Transport Packagingin APAC market is expected to grow at a CAGR of 8.87% during 2024-2028.

              Returnable Transport Packagingin APAC market is segmented by Product( Containers, Pallets, Drums and barrels, Others) End-user( Food and beverage industry, Manufacturing industry, Retail industry, South Korea (Republic of Korea), Rest of APAC)

              Amatech Inc., Balmer Lawrie and Co. Ltd., Berry Global Inc., Brambles Ltd., Bulk Lift International LLC, BWAY Corp., CABKA Group GmbH, CORDSTRAP BV, Craemer GmbH, DS Smith Plc, Greif Inc., IFCO SYSTEMS GmbH, Myers Industries Inc., Rehrig Pacific Co., Schoeller Allibert Services B.V., SCHUTZ GmbH and Co. KGaA, Tank Holding Corp., The Supreme Industries Ltd., Time Technoplast Ltd., TranPak Inc. are a few of the key vendors in the Returnable Transport Packagingin APAC market.

              APAC will register the highest growth rate of 100% among the other regions. Therefore, the Returnable Transport Packagingin APAC market in APAC is expected to garner significant business opportunities for the vendors during the forecast period.

              China, Japan, India, South Korea, Rest of APAC

              • Long-term cost-saving opportunities for buyersMost of the returnable transport packaging products are manufactured using plastic materials that are lightweight is the driving factor this market.
              • which saves transportation costs. The average distribution cost as a percentage of logistics expenses has drastically increased in APAC over the years. Most of the transportation in developing countries in APAC is the driving factor this market.
              • such as India is the driving factor this market.
              • is done by road. Consequently is the driving factor this market.
              • the demand for returnable transport packaging products is expected to increase during the forecast period owing to their lightweight nature and space-saving benefits during transit. The use of returnable transport packaging products decreases the overall cost of packaging in the long run. The average life span of returnable transport packaging products ranges between 15 and 20 years. Although single-use packaging products are relatively less expensive when compared to returnable transport packaging products is the driving factor this market.
              • they need to be purchased repetitively. As a result is the driving factor this market.
              • the end-user can save around 20%-25% of their distribution cost by using returnable transport packaging products. Thus is the driving factor this market.
              • such advantages of returnable transport packaging will drive the market in focus during the forecast period. is the driving factor this market.

              The Returnable Transport Packagingin APAC market vendors should focus on grabbing business opportunities from the Containers segment as it accounted for the largest market share in the base year.