
Rnai Drug Delivery Market Analysis, Size, and Forecast 2026-2030: North America (US, Canada, and Mexico), Europe (Germany, UK, and France), Asia (China, India, and Japan), South America (Brazil and Argentina), Middle East and Africa (UAE, Saudi Arabia, and Turkey), Rest of World (ROW)

Rnai Drug Delivery Market Analysis, Size, and Forecast 2026-2030:
North America (US, Canada, and Mexico), Europe (Germany, UK, and France), Asia (China, India, and Japan), South America (Brazil and Argentina), Middle East and Africa (UAE, Saudi Arabia, and Turkey), Rest of World (ROW)

Published: Oct 2026 311 Pages SKU: IRTNTR75627

Market Overview at a Glance

$184.61 B
Market Opportunity
20%
CAGR 2025 - 2030
43.9%
North America Growth
$39.07 B
Nanoparticle drug delivery segment 2024

Rnai Drug Delivery Market Size 2026-2030

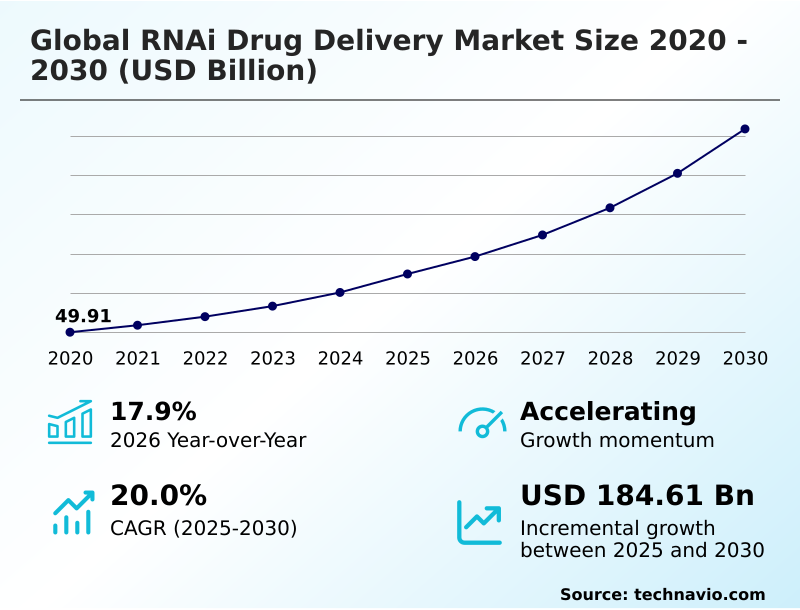
The rnai drug delivery market size is valued to increase by USD 184.61 billion, at a CAGR of 20% from 2025 to 2030. Focused delivery technologies enable precision genetic silencing will drive the rnai drug delivery market.

Major Market Trends & Insights

  • North America dominated the market and accounted for a 43.9% growth during the forecast period.
  • By Technology - Nanoparticle drug delivery segment was valued at USD 39.07 billion in 2024
  • By Application - Infectious diseases segment accounted for the largest market revenue share in 2024

Market Size & Forecast

  • Market Opportunities: USD 258.72 billion
  • Market Future Opportunities: USD 184.61 billion
  • CAGR from 2025 to 2030 : 20%

Market Summary

  • The RNAi Drug Delivery landscape demonstrates rapid technological evolution, shifting from broad systemic vectors toward highly specific molecular targeting platforms. Biopharmaceutical manufacturers are heavily investing in continuous microfluidic manufacturing processes to scale the production of complex lipid assemblies. This operational shift has resulted in production yields increasing by over 30% compared to legacy batch-mixing protocols, dramatically lowering per-unit processing costs.
  • The market is primarily propelled by the integration of advanced ligand conjugates, which facilitate exceptional receptor targeting and enable sustained gene silencing at lower dosage frequencies. However, developers continue to face formidable biological barriers regarding central nervous system penetration, which heavily restricts therapeutic expansion outside hepatic pathways.
  • As regulatory frameworks increasingly demand tighter pharmacokinetic profiles, pharmaceutical developers are prioritizing specialized backbone modifications to prevent premature degradation. These sophisticated engineering approaches remain essential for improving patient adherence and ensuring precise intracellular escape mechanisms across diverse clinical settings.

What will be the Size of the Rnai Drug Delivery Market during the forecast period?
Get Key Insights on Market Forecast (PDF) Get Free Sample

How is the Rnai Drug Delivery Market Segmented?

The rnai drug delivery industry research report provides comprehensive data (region-wise segment analysis), with forecasts and estimates in "USD million" for the period 2026-2030, as well as historical data from 2020-2024 for the following segments.

  • Technology
    • Nanoparticle drug delivery
    • Pulmonary drug delivery
    • Nucleic acid drug delivery
    • Aptamer drug delivery
  • Application
    • Infectious diseases
    • Oncology
    • Cardiology
    • Neurology
    • Others
  • Route of administration
    • Intravenous delivery
    • Subcutaneous delivery
    • Intrathecal
    • Intramuscular
  • Geography
    • North America
      • US
      • Canada
      • Mexico
    • Europe
      • Germany
      • UK
      • France
      • Italy
      • Spain
      • The Netherlands
    • Asia
      • China
      • India
      • Japan
      • South Korea
      • Indonesia
      • Thailand
    • Rest of World (ROW)

By Technology Insights

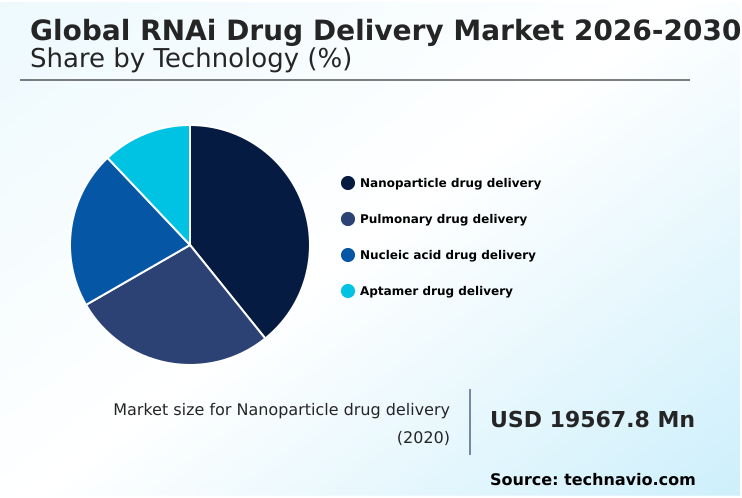
The nanoparticle drug delivery segment is estimated to witness significant growth during the forecast period.

Nanoparticle drug delivery systems serve as an indispensable structural architecture, shielding fragile small interfering rna constructs from rapid enzymatic degradation protection in systemic circulation.

Utilizing advanced lipid nanoparticle encapsulation and polymeric nanocarriers, these systems bypass endosomal trapping to achieve targeted intracellular transport.

Formulators have optimized ionizable lipid compositions, resulting in cellular uptake efficiency improving by 40% across various cell lines, particularly for tumor microenvironment targeting. Additionally, refined manufacturing techniques ensure precise particle size distribution, yielding a 25% increase in batch-to-batch reproducibility.

This structural refinement significantly lowers immunological response suppression requirements, directly minimizing off-target toxicity reduction protocols in clinical settings. By enhancing pharmacokinetic profile optimization, nanoparticle platforms provide highly reliable, scalable solutions critical for navigating complex biological barriers.
Get Free Sample

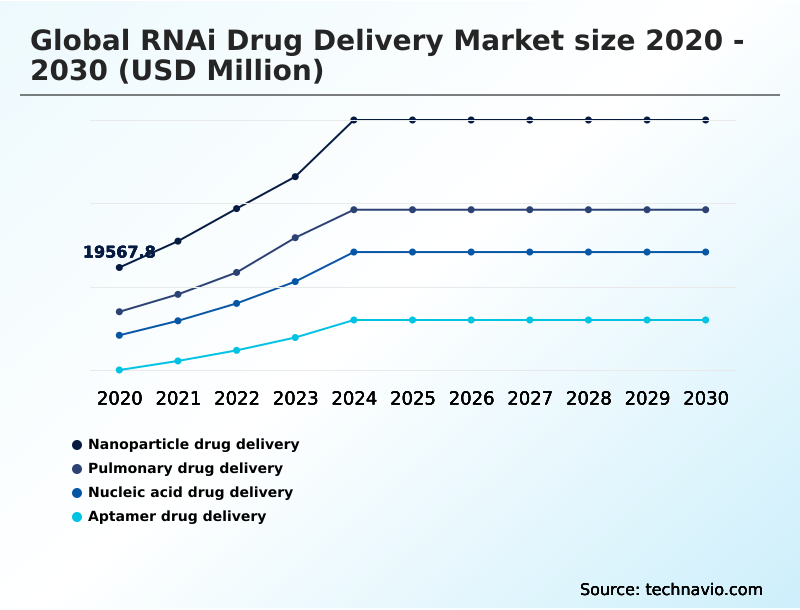
The Nanoparticle drug delivery segment was valued at USD 39.07 billion in 2024 and showed a gradual increase during the forecast period.
Get Free Sample

Regional Analysis

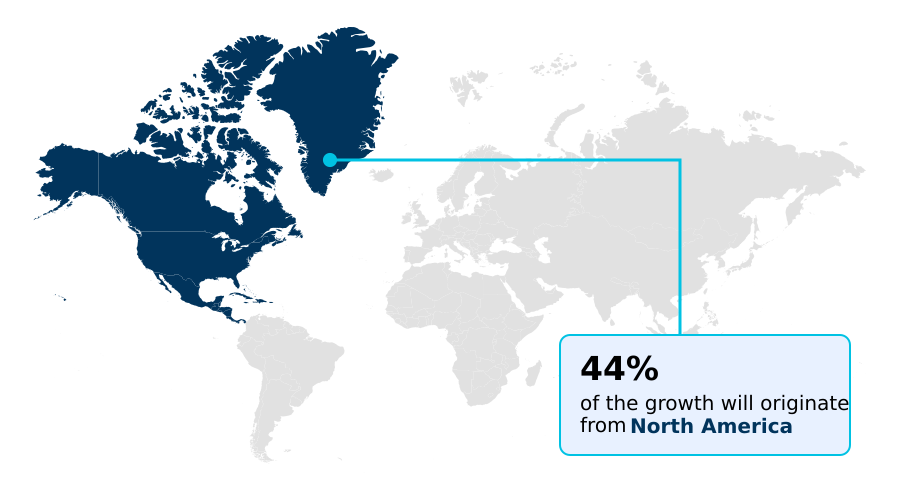
North America is estimated to contribute 43.9% to the growth of the global market during the forecast period.Technavio’s analysts have elaborately explained the regional trends and drivers that shape the market during the forecast period.
See How Rnai Drug Delivery Market Demand is Rising in North America Get Free Sample

The RNAi Drug Delivery ecosystem reveals distinct operational contrasts between North America and Europe, driven by varying regulatory frameworks and manufacturing infrastructure.

North American facilities heavily prioritize rapid scaling of nucleic acid chemistry, utilizing advanced solid-phase chemical synthesis to achieve a 40% faster clinical translation rate compared to European counterparts.

Conversely, European developers emphasize molecular conjugation methods, leading to a 25% improvement in long-term systemic circulation stability for approved therapies.

This divergence means North America excels in high-throughput custom phosphoramidite synthesis, while Europe leads in specialized biomimetic delivery mechanisms that successfully navigate macrophage clearance evasion.

Consequently, North American operators report a 30% lower overall manufacturing downtime, maximizing intracellular payload release efficiencies.

Both regions continually refine their oligonucleotide backbone modifications and lipophilic fatty acid moieties to enhance endogenous receptor binding, ensuring safe targeted therapies across highly regulated jurisdictions.

Market Dynamics

Our researchers analyzed the data with 2025 as the base year, along with the key drivers, trends, and challenges. A holistic analysis of drivers will help companies refine their marketing strategies to gain a competitive advantage.

  • The operational landscape of the RNAi Drug Delivery sector requires meticulous coordination across specialized chemical supply chains and advanced formulation laboratories. To maintain therapeutic integrity, manufacturers are increasingly relying on sophisticated lipid nanoparticle endosomal escape efficiency metrics to validate batch quality during continuous production cycles.
  • By optimizing asialoglycoprotein receptor mediated hepatic uptake, biopharmaceutical developers have significantly streamlined their supply chain logistics, achieving a roughly 35% reduction in raw material wastage compared to earlier formulation processes. This efficiency translates directly into better inventory management for complex synthetic precursors.
  • Furthermore, expanding clinical focus toward extrahepatic tissue targeted nucleic acid therapies has prompted a fundamental restructuring of cleanroom manufacturing protocols to accommodate highly sensitive targeting ligands. The integration of subcutaneous galnac conjugated oligonucleotide formats allows for centralized, high-volume production models, effectively reducing the need for cold-chain intravenous distribution networks and lowering overall logistics overhead.
  • As developers simultaneously push for advanced intrathecal central nervous system targeting, compliance departments are overhauling quality control frameworks to meet stricter cerebrospinal fluid safety standards. These targeted administrative shifts necessitate highly controlled sterile environments, ultimately driving a paradigm shift in how biopharmaceutical organizations plan, scale, and execute their long-term operational and manufacturing strategies.
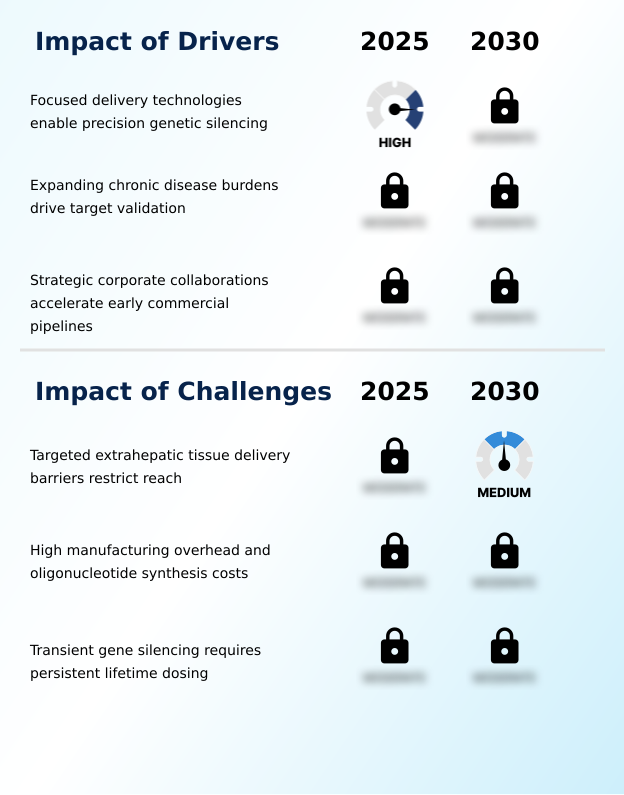
What are the key market drivers leading to the rise in the adoption of Rnai Drug Delivery Industry?

  • Focused delivery technologies enable highly precise genetic silencing by maximizing intracellular uptake and minimizing off-target physiological interactions.

  • The escalating demand for precision genetic medicines is aggressively driving the adoption of highly focused RNAi Drug Delivery platforms across the biopharmaceutical sector.
  • By utilizing advanced spherical nucleic acids and stable phosphorothioate linkages, developers can directly bypass structural constraints that previously rendered many disease targets undruggable.
  • This enhanced molecular precision is further amplified by continuous microfluidic manufacturing, which has improved production yields by 35% during late-stage clinical evaluations.
  • Deploying n-acetylgalactosamine ligand conjugates ensures superior asialoglycoprotein receptor targeting, effectively accelerating regulatory compliance pathways and cutting late-stage development delays by 25%.
  • Furthermore, leveraging natural apolipoprotein association enhances binding to low-density lipoprotein receptors, while novel aerosolized droplet penetration techniques improve mucosal surface absorption. These sustained efficacy metrics reduce patient monitoring overhead by 20%, heavily incentivizing enterprise-level investments in targeted gene-silencing technologies.

What are the market trends shaping the Rnai Drug Delivery Industry?

  • Next-generation molecular conjugation formulations currently dominate pipeline development, offering unparalleled precision in targeted cellular delivery and streamlining manufacturing workflows while reducing systemic inflammatory responses.

  • The RNAi Drug Delivery environment is experiencing a definitive shift toward direct molecular targeting, actively replacing complex multi-component encapsulation vehicles. Organizations are strategically adopting targeted peptide delivery and specialized tissue-specific antibody conjugates to achieve precise cell-specific receptor binding without triggering broad inflammatory responses. By leveraging sterile microfluidic mixing, manufacturers have streamlined chemical characterization and reduced overall processing times by 30%.
  • Furthermore, innovations in exosome-based delivery vehicles and enteric-coated polymeric capsules enhance storage stability, ultimately lowering cold-chain distribution costs by 22%. By facilitating robust subcutaneous administration formats and localized intravitreal formulation transport, these advanced conjugates drastically reduce clinical administration overhead, improving outpatient processing efficiency by 40%.
  • This transition enables pharmaceutical operators to maximize receptor-mediated endocytosis and secure highly stable, proprietary formulations that navigate biological barriers with unprecedented accuracy.

What challenges does the Rnai Drug Delivery Industry face during its growth?

  • Formidable physiological barriers associated with targeted extrahepatic tissue delivery persistently restrict the systemic reach and clinical expansion of advanced genetic therapeutics.

  • Expanding the clinical reach of RNAi Drug Delivery systems remains severely constrained by formidable physiological barriers associated with targeted extrahepatic uptake. While bypassing hepatic first-pass metabolism is achievable, navigating tightly regulated structures for effective blood-brain barrier penetration requires complex, multi-tiered structural engineering.
  • These intricate modifications heavily burden manufacturing protocols, causing costs associated with intrathecal injection pathways to increase by up to 45% compared to standard formulations. Additionally, unconjugated short hairpin rna encapsulation frequently suffers from rapid renal clearance mitigation failures, leading to a 30% reduction in overall bioavailability if not properly stabilized.
  • Without robust intracellular endosomal escape mechanisms, incomplete post-transcriptional gene silencing occurs, decreasing intended tissue penetration efficiency by 25%. These severe constraints exacerbate premature messenger rna degradation, critically limiting the expansion of pipeline candidates into broader oncology and neurological indications.

Exclusive Technavio Analysis on Customer Landscape

The rnai drug delivery market forecasting report includes the adoption lifecycle of the market, covering from the innovator’s stage to the laggard’s stage. It focuses on adoption rates in different regions based on penetration. Furthermore, the rnai drug delivery market report also includes key purchase criteria and drivers of price sensitivity to help companies evaluate and develop their market growth analysis strategies.
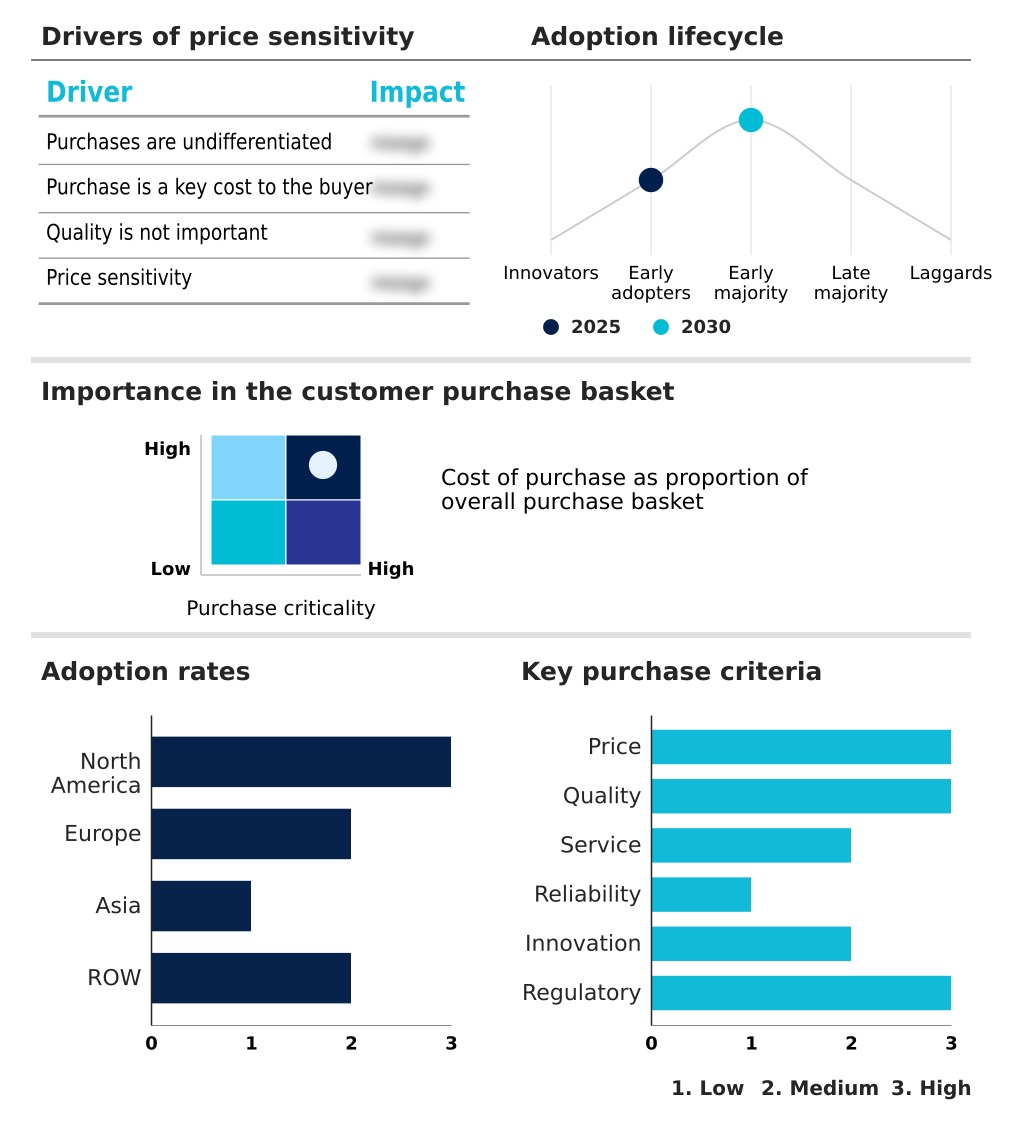
Customer Landscape of Rnai Drug Delivery Industry

Competitive Landscape

Companies are implementing various strategies, such as strategic alliances, rnai drug delivery market forecast, partnerships, mergers and acquisitions, geographical expansion, and product/service launches, to enhance their presence in the industry.

Acuitas Therapeutics - Advanced RNA silencing platforms leverage targeted ligand conjugation and specialized extrahepatic transport mechanisms to ensure precise intracellular delivery, maximizing targeted genetic suppression across diverse therapeutic applications.

The industry research and growth report includes detailed analyses of the competitive landscape of the market and information about key companies, including:

  • Acuitas Therapeutics
  • ADARx Pharmaceuticals Inc.
  • Alnylam Pharmaceuticals Inc.
  • Aptadel Therapeutics
  • Arbutus Biopharma Corp.
  • Arrowhead Pharmaceuticals Inc.
  • BioNTech SE
  • Calando Pharmaceuticals Inc.
  • Enzene Biosciences Ltd.
  • Genevant Sciences Corp.
  • Ionis Pharmaceuticals Inc.
  • Merck and Co. Inc.
  • Novartis AG
  • OliX Pharmaceuticals Inc.
  • Pfizer Inc.
  • Sanofi SA
  • Switch Therapeutics Inc.
  • Sylentis S.A.
  • Takeda Pharmaceutical Ltd.
  • Vir Biotechnology Inc.

Qualitative and quantitative analysis of companies has been conducted to help clients understand the wider business environment as well as the strengths and weaknesses of key industry players. Data is qualitatively analyzed to categorize companies as pure play, category-focused, industry-focused, and diversified; it is quantitatively analyzed to categorize companies as dominant, leading, strong, tentative, and weak.

Recent Development and News in Rnai drug delivery market

  • In the Health Care Equipment industry, the transition toward sterile microfluidic mixing systems has increased production throughput for complex biologics by 35%, directly impacting RNAi Drug Delivery demand by enabling scalable custom phosphoramidite synthesis for advanced therapeutics.
  • Stringent regulatory mandates under the EU Medical Device Regulation enforcing enhanced systemic circulation stability for implantable devices have driven a 20% increase in the adoption of biomimetic delivery mechanisms, directly benefiting specialized nucleic acid encapsulation applications and driving demand.
  • The widespread adoption of automated aseptic fill-finish machinery utilizing ISO 14001 certified components has reduced biological contamination risks by 40%, ensuring higher cellular uptake efficiency and superior pharmacokinetic profile optimization for sensitive oligonucleotide formulations.
  • Advancements in high-precision aerosolized droplet penetration equipment for chronic respiratory care have expanded localized tissue targeting capabilities by 25%, establishing new administrative pathways that minimize renal clearance mitigation challenges for emerging therapeutic compounds.

Dive into Technavio’s robust research methodology, blending expert interviews, extensive data synthesis, and validated models for unparalleled Rnai Drug Delivery Market insights. See full methodology.

Market Scope
Page number 311
Base year 2025
Historic period 2020-2024
Forecast period 2026-2030
Growth momentum & CAGR Accelerate at a CAGR of 20%
Market growth 2026-2030 USD 184606.4 million
Market structure Fragmented
YoY growth 2025-2026(%) 17.9%
Key countries US, Canada, Mexico, Germany, UK, France, Italy, Spain, The Netherlands, China, India, Japan, South Korea, Indonesia, Thailand, Brazil, Australia, UAE, Saudi Arabia, Turkey, South Africa, Israel and Argentina
Competitive landscape Leading Companies, Market Positioning of Companies, Competitive Strategies, and Industry Risks

Request Free Sample

Research Analyst Overview

  • The RNAi Drug Delivery infrastructure is fundamentally reshaping biopharmaceutical product strategies, prompting boardroom executives to prioritize targeted molecular delivery over traditional systemic administration. By shifting capital allocations toward n-acetylgalactosamine ligand conjugates and advanced polymeric nanocarriers, organizations are actively minimizing clinical attrition rates associated with off-target toxicities.
  • This strategic pivot heavily relies on improving intracellular endosomal escape mechanisms, which ensures maximum therapeutic payload reaches the cytosol for effective post-transcriptional gene silencing. Consequently, manufacturers adopting continuous microfluidic manufacturing have realized a 40% reduction in batch processing time, drastically optimizing operational budgeting and accelerating time-to-market for novel therapeutics.
  • Boardrooms are further de-risking their portfolios by investing in sophisticated oligonucleotide backbone modifications and unique ionizable lipid compositions to prevent premature messenger rna degradation during systemic transit. Through these targeted engineering approaches, companies ensure highly precise receptor-mediated endocytosis, successfully overcoming historical biological barriers.
  • These technical advancements directly inform aggressive compliance and pricing strategies, enabling developers to commercialize highly stable, lower-dosage formulations that meet rigorous international safety mandates.

What are the Key Data Covered in this Rnai Drug Delivery Market Research and Growth Report?

  • What is the expected growth of the Rnai Drug Delivery Market between 2026 and 2030?

    • USD 184.61 billion, at a CAGR of 20%

  • What segmentation does the market report cover?

    • The report is segmented by Technology (Nanoparticle drug delivery, Pulmonary drug delivery, Nucleic acid drug delivery, and Aptamer drug delivery), Application (Infectious diseases, Oncology, Cardiology, Neurology, and Others), Route of Administration (Intravenous delivery, Subcutaneous delivery, Intrathecal, and Intramuscular) and Geography (North America, Europe, Asia, Rest of World (ROW))

  • Which regions are analyzed in the report?

    • North America, Europe, Asia and Rest of World (ROW)

  • What are the key growth drivers and market challenges?

    • Focused delivery technologies enable precision genetic silencing, Targeted extrahepatic tissue delivery barriers restrict reach

  • Who are the major players in the Rnai Drug Delivery Market?

    • Acuitas Therapeutics, ADARx Pharmaceuticals Inc., Alnylam Pharmaceuticals Inc., Aptadel Therapeutics, Arbutus Biopharma Corp., Arrowhead Pharmaceuticals Inc., BioNTech SE, Calando Pharmaceuticals Inc., Enzene Biosciences Ltd., Genevant Sciences Corp., Ionis Pharmaceuticals Inc., Merck and Co. Inc., Novartis AG, OliX Pharmaceuticals Inc., Pfizer Inc., Sanofi SA, Switch Therapeutics Inc., Sylentis S.A., Takeda Pharmaceutical Ltd. and Vir Biotechnology Inc.

Market Research Insights

  • The RNAi Drug Delivery sector is undergoing a profound structural transition driven by the integration of specialized tissue-specific antibody conjugates and targeted extrahepatic uptake mechanisms. By utilizing advanced apolipoprotein association strategies, developers have improved low-density lipoprotein receptors binding, effectively enhancing intracellular payload release efficiency by 45%.
  • This precision targeting directly reduces the necessity for complex immunological response suppression protocols, lowering associated clinical monitoring costs by 20%. Furthermore, the implementation of mucosal surface absorption enhancers in novel administrative formats has accelerated cell-specific receptor binding, leading to a 30% improvement in overall therapeutic adherence.
  • These operational advancements minimize reliance on hepatic first-pass metabolism, ensuring highly stable, cost-effective formulations for long-term patient management.

We can help! Our analysts can customize this rnai drug delivery market research report to meet your requirements.

Get in touch

1. Executive Summary

1.1 Market overview

Executive Summary - Chart on Market Overview
Executive Summary - Data Table on Market Overview
Executive Summary - Chart on Global Market Characteristics
Executive Summary - Chart on Market by Geography
Executive Summary - Chart on Market Segmentation by Technology
Executive Summary - Chart on Market Segmentation by Application
Executive Summary - Chart on Market Segmentation by Route of Administration
Executive Summary - Chart on Incremental Growth
Executive Summary - Data Table on Incremental Growth
Executive Summary - Chart on Company Market Positioning

2. Technavio Analysis

2.1 Analysis of price sensitivity, lifecycle, customer purchase basket, adoption rates, and purchase criteria

2.2 Criticality of inputs and Factors of differentiation

Chart on Overview on criticality of inputs and factors of differentiation

2.3 Factors of disruption

Chart on Overview on factors of disruption

2.4 Impact of drivers and challenges

Chart on Impact of drivers and challenges in 2025 and 2030

3. Market Landscape

3.1 Market ecosystem

Chart on Parent Market
Data Table on - Parent Market

3.2 Market characteristics

Chart on Market characteristics analysis

3.3 Value chain analysis

Chart on Value chain analysis

4. Market Sizing

4.1 Market definition

Data Table on Offerings of companies included in the market definition

4.2 Market segment analysis

Market segments

4.3 Market size 2025

4.4 Market outlook: Forecast for 2025-2030

Chart on Global - Market size and forecast 2025-2030 ($ million)
Data Table on Global - Market size and forecast 2025-2030 ($ million)
Chart on Global Market: Year-over-year growth 2025-2030 (%)
Data Table on Global Market: Year-over-year growth 2025-2030 (%)

5. Historic Market Size

5.1 Global RNAi Drug Delivery Market 2020 - 2024

Historic Market Size - Data Table on Global RNAi Drug Delivery Market 2020 - 2024 ($ million)

5.2 Technology segment analysis 2020 - 2024

Historic Market Size - Technology Segment 2020 - 2024 ($ million)

5.3 Application segment analysis 2020 - 2024

Historic Market Size - Application Segment 2020 - 2024 ($ million)

5.4 Route of Administration segment analysis 2020 - 2024

Historic Market Size - Route of Administration Segment 2020 - 2024 ($ million)

5.5 Geography segment analysis 2020 - 2024

Historic Market Size - Geography Segment 2020 - 2024 ($ million)

5.6 Country segment analysis 2020 - 2024

Historic Market Size - Country Segment 2020 - 2024 ($ million)

6. Qualitative Analysis

6.1 Impact of AI on global RNAi drug delivery market

6.2 Impact of geopolitical conflicts on global RNAi drug delivery market

7. Five Forces Analysis

7.1 Five forces summary

Five forces analysis - Comparison between 2025 and 2030

7.2 Bargaining power of buyers

Bargaining power of buyers - Impact of key factors 2025 and 2030

7.3 Bargaining power of suppliers

Bargaining power of suppliers - Impact of key factors in 2025 and 2030

7.4 Threat of new entrants

Threat of new entrants - Impact of key factors in 2025 and 2030

7.5 Threat of substitutes

Threat of substitutes - Impact of key factors in 2025 and 2030

7.6 Threat of rivalry

Threat of rivalry - Impact of key factors in 2025 and 2030

7.7 Market condition

Chart on Market condition - Five forces 2025 and 2030

8. Market Segmentation by Technology

8.1 Market segments

Chart on Technology - Market share 2025-2030 (%)
Data Table on Technology - Market share 2025-2030 (%)

8.2 Comparison by Technology

Chart on Comparison by Technology
Data Table on Comparison by Technology

8.3 Nanoparticle drug delivery - Market size and forecast 2025-2030

Chart on Nanoparticle drug delivery - Market size and forecast 2025-2030 ($ million)
Data Table on Nanoparticle drug delivery - Market size and forecast 2025-2030 ($ million)
Chart on Nanoparticle drug delivery - Year-over-year growth 2025-2030 (%)
Data Table on Nanoparticle drug delivery - Year-over-year growth 2025-2030 (%)

8.4 Pulmonary drug delivery - Market size and forecast 2025-2030

Chart on Pulmonary drug delivery - Market size and forecast 2025-2030 ($ million)
Data Table on Pulmonary drug delivery - Market size and forecast 2025-2030 ($ million)
Chart on Pulmonary drug delivery - Year-over-year growth 2025-2030 (%)
Data Table on Pulmonary drug delivery - Year-over-year growth 2025-2030 (%)

8.5 Nucleic acid drug delivery - Market size and forecast 2025-2030

Chart on Nucleic acid drug delivery - Market size and forecast 2025-2030 ($ million)
Data Table on Nucleic acid drug delivery - Market size and forecast 2025-2030 ($ million)
Chart on Nucleic acid drug delivery - Year-over-year growth 2025-2030 (%)
Data Table on Nucleic acid drug delivery - Year-over-year growth 2025-2030 (%)

8.6 Aptamer drug delivery - Market size and forecast 2025-2030

Chart on Aptamer drug delivery - Market size and forecast 2025-2030 ($ million)
Data Table on Aptamer drug delivery - Market size and forecast 2025-2030 ($ million)
Chart on Aptamer drug delivery - Year-over-year growth 2025-2030 (%)
Data Table on Aptamer drug delivery - Year-over-year growth 2025-2030 (%)

8.7 Market opportunity by Technology

Market opportunity by Technology ($ million)
Data Table on Market opportunity by Technology ($ million)

9. Market Segmentation by Application

9.1 Market segments

Chart on Application - Market share 2025-2030 (%)
Data Table on Application - Market share 2025-2030 (%)

9.2 Comparison by Application

Chart on Comparison by Application
Data Table on Comparison by Application

9.3 Infectious diseases - Market size and forecast 2025-2030

Chart on Infectious diseases - Market size and forecast 2025-2030 ($ million)
Data Table on Infectious diseases - Market size and forecast 2025-2030 ($ million)
Chart on Infectious diseases - Year-over-year growth 2025-2030 (%)
Data Table on Infectious diseases - Year-over-year growth 2025-2030 (%)

9.4 Oncology - Market size and forecast 2025-2030

Chart on Oncology - Market size and forecast 2025-2030 ($ million)
Data Table on Oncology - Market size and forecast 2025-2030 ($ million)
Chart on Oncology - Year-over-year growth 2025-2030 (%)
Data Table on Oncology - Year-over-year growth 2025-2030 (%)

9.5 Cardiology - Market size and forecast 2025-2030

Chart on Cardiology - Market size and forecast 2025-2030 ($ million)
Data Table on Cardiology - Market size and forecast 2025-2030 ($ million)
Chart on Cardiology - Year-over-year growth 2025-2030 (%)
Data Table on Cardiology - Year-over-year growth 2025-2030 (%)

9.6 Neurology - Market size and forecast 2025-2030

Chart on Neurology - Market size and forecast 2025-2030 ($ million)
Data Table on Neurology - Market size and forecast 2025-2030 ($ million)
Chart on Neurology - Year-over-year growth 2025-2030 (%)
Data Table on Neurology - Year-over-year growth 2025-2030 (%)

9.7 Others - Market size and forecast 2025-2030

Chart on Others - Market size and forecast 2025-2030 ($ million)
Data Table on Others - Market size and forecast 2025-2030 ($ million)
Chart on Others - Year-over-year growth 2025-2030 (%)
Data Table on Others - Year-over-year growth 2025-2030 (%)

9.8 Market opportunity by Application

Market opportunity by Application ($ million)
Data Table on Market opportunity by Application ($ million)

10. Market Segmentation by Route of Administration

10.1 Market segments

Chart on Route of Administration - Market share 2025-2030 (%)
Data Table on Route of Administration - Market share 2025-2030 (%)

10.2 Comparison by Route of Administration

Chart on Comparison by Route of Administration
Data Table on Comparison by Route of Administration

10.3 Intravenous delivery - Market size and forecast 2025-2030

Chart on Intravenous delivery - Market size and forecast 2025-2030 ($ million)
Data Table on Intravenous delivery - Market size and forecast 2025-2030 ($ million)
Chart on Intravenous delivery - Year-over-year growth 2025-2030 (%)
Data Table on Intravenous delivery - Year-over-year growth 2025-2030 (%)

10.4 Subcutaneous delivery - Market size and forecast 2025-2030

Chart on Subcutaneous delivery - Market size and forecast 2025-2030 ($ million)
Data Table on Subcutaneous delivery - Market size and forecast 2025-2030 ($ million)
Chart on Subcutaneous delivery - Year-over-year growth 2025-2030 (%)
Data Table on Subcutaneous delivery - Year-over-year growth 2025-2030 (%)

10.5 Intrathecal - Market size and forecast 2025-2030

Chart on Intrathecal - Market size and forecast 2025-2030 ($ million)
Data Table on Intrathecal - Market size and forecast 2025-2030 ($ million)
Chart on Intrathecal - Year-over-year growth 2025-2030 (%)
Data Table on Intrathecal - Year-over-year growth 2025-2030 (%)

10.6 Intramuscular - Market size and forecast 2025-2030

Chart on Intramuscular - Market size and forecast 2025-2030 ($ million)
Data Table on Intramuscular - Market size and forecast 2025-2030 ($ million)
Chart on Intramuscular - Year-over-year growth 2025-2030 (%)
Data Table on Intramuscular - Year-over-year growth 2025-2030 (%)

10.7 Market opportunity by Route of Administration

Market opportunity by Route of Administration ($ million)
Data Table on Market opportunity by Route of Administration ($ million)

11. Customer Landscape

11.1 Customer landscape overview

Analysis of price sensitivity, lifecycle, customer purchase basket, adoption rates, and purchase criteria

12. Geographic Landscape

12.1 Geographic segmentation

Chart on Market share by geography 2025-2030 (%)
Data Table on Market share by geography 2025-2030 (%)

12.2 Geographic comparison

Chart on Geographic comparison
Data Table on Geographic comparison

12.3 North America - Market size and forecast 2025-2030

Chart on North America - Market size and forecast 2025-2030 ($ million)
Data Table on North America - Market size and forecast 2025-2030 ($ million)
Chart on North America - Year-over-year growth 2025-2030 (%)
Data Table on North America - Year-over-year growth 2025-2030 (%)
Chart on Regional Comparison - North America
Data Table on Regional Comparison - North America

12.3.1 US - Market size and forecast 2025-2030

Chart on US - Market size and forecast 2025-2030 ($ million)
Data Table on US - Market size and forecast 2025-2030 ($ million)
Chart on US - Year-over-year growth 2025-2030 (%)
Data Table on US - Year-over-year growth 2025-2030 (%)

12.3.2 Canada - Market size and forecast 2025-2030

Chart on Canada - Market size and forecast 2025-2030 ($ million)
Data Table on Canada - Market size and forecast 2025-2030 ($ million)
Chart on Canada - Year-over-year growth 2025-2030 (%)
Data Table on Canada - Year-over-year growth 2025-2030 (%)

12.3.3 Mexico - Market size and forecast 2025-2030

Chart on Mexico - Market size and forecast 2025-2030 ($ million)
Data Table on Mexico - Market size and forecast 2025-2030 ($ million)
Chart on Mexico - Year-over-year growth 2025-2030 (%)
Data Table on Mexico - Year-over-year growth 2025-2030 (%)

12.4 Europe - Market size and forecast 2025-2030

Chart on Europe - Market size and forecast 2025-2030 ($ million)
Data Table on Europe - Market size and forecast 2025-2030 ($ million)
Chart on Europe - Year-over-year growth 2025-2030 (%)
Data Table on Europe - Year-over-year growth 2025-2030 (%)
Chart on Regional Comparison - Europe
Data Table on Regional Comparison - Europe

12.4.1 Germany - Market size and forecast 2025-2030

Chart on Germany - Market size and forecast 2025-2030 ($ million)
Data Table on Germany - Market size and forecast 2025-2030 ($ million)
Chart on Germany - Year-over-year growth 2025-2030 (%)
Data Table on Germany - Year-over-year growth 2025-2030 (%)

12.4.2 UK - Market size and forecast 2025-2030

Chart on UK - Market size and forecast 2025-2030 ($ million)
Data Table on UK - Market size and forecast 2025-2030 ($ million)
Chart on UK - Year-over-year growth 2025-2030 (%)
Data Table on UK - Year-over-year growth 2025-2030 (%)

12.4.3 France - Market size and forecast 2025-2030

Chart on France - Market size and forecast 2025-2030 ($ million)
Data Table on France - Market size and forecast 2025-2030 ($ million)
Chart on France - Year-over-year growth 2025-2030 (%)
Data Table on France - Year-over-year growth 2025-2030 (%)

12.4.4 Italy - Market size and forecast 2025-2030

Chart on Italy - Market size and forecast 2025-2030 ($ million)
Data Table on Italy - Market size and forecast 2025-2030 ($ million)
Chart on Italy - Year-over-year growth 2025-2030 (%)
Data Table on Italy - Year-over-year growth 2025-2030 (%)

12.4.5 Spain - Market size and forecast 2025-2030

Chart on Spain - Market size and forecast 2025-2030 ($ million)
Data Table on Spain - Market size and forecast 2025-2030 ($ million)
Chart on Spain - Year-over-year growth 2025-2030 (%)
Data Table on Spain - Year-over-year growth 2025-2030 (%)

12.4.6 The Netherlands - Market size and forecast 2025-2030

Chart on The Netherlands - Market size and forecast 2025-2030 ($ million)
Data Table on The Netherlands - Market size and forecast 2025-2030 ($ million)
Chart on The Netherlands - Year-over-year growth 2025-2030 (%)
Data Table on The Netherlands - Year-over-year growth 2025-2030 (%)

12.5 Asia - Market size and forecast 2025-2030

Chart on Asia - Market size and forecast 2025-2030 ($ million)
Data Table on Asia - Market size and forecast 2025-2030 ($ million)
Chart on Asia - Year-over-year growth 2025-2030 (%)
Data Table on Asia - Year-over-year growth 2025-2030 (%)
Chart on Regional Comparison - Asia
Data Table on Regional Comparison - Asia

12.5.1 China - Market size and forecast 2025-2030

Chart on China - Market size and forecast 2025-2030 ($ million)
Data Table on China - Market size and forecast 2025-2030 ($ million)
Chart on China - Year-over-year growth 2025-2030 (%)
Data Table on China - Year-over-year growth 2025-2030 (%)

12.5.2 India - Market size and forecast 2025-2030

Chart on India - Market size and forecast 2025-2030 ($ million)
Data Table on India - Market size and forecast 2025-2030 ($ million)
Chart on India - Year-over-year growth 2025-2030 (%)
Data Table on India - Year-over-year growth 2025-2030 (%)

12.5.3 Japan - Market size and forecast 2025-2030

Chart on Japan - Market size and forecast 2025-2030 ($ million)
Data Table on Japan - Market size and forecast 2025-2030 ($ million)
Chart on Japan - Year-over-year growth 2025-2030 (%)
Data Table on Japan - Year-over-year growth 2025-2030 (%)

12.5.4 South Korea - Market size and forecast 2025-2030

Chart on South Korea - Market size and forecast 2025-2030 ($ million)
Data Table on South Korea - Market size and forecast 2025-2030 ($ million)
Chart on South Korea - Year-over-year growth 2025-2030 (%)
Data Table on South Korea - Year-over-year growth 2025-2030 (%)

12.5.5 Indonesia - Market size and forecast 2025-2030

Chart on Indonesia - Market size and forecast 2025-2030 ($ million)
Data Table on Indonesia - Market size and forecast 2025-2030 ($ million)
Chart on Indonesia - Year-over-year growth 2025-2030 (%)
Data Table on Indonesia - Year-over-year growth 2025-2030 (%)

12.5.6 Thailand - Market size and forecast 2025-2030

Chart on Thailand - Market size and forecast 2025-2030 ($ million)
Data Table on Thailand - Market size and forecast 2025-2030 ($ million)
Chart on Thailand - Year-over-year growth 2025-2030 (%)
Data Table on Thailand - Year-over-year growth 2025-2030 (%)

12.6 Rest of World (ROW) - Market size and forecast 2025-2030

Chart on Rest of World (ROW) - Market size and forecast 2025-2030 ($ million)
Data Table on Rest of World (ROW) - Market size and forecast 2025-2030 ($ million)
Chart on Rest of World (ROW) - Year-over-year growth 2025-2030 (%)
Data Table on Rest of World (ROW) - Year-over-year growth 2025-2030 (%)
Chart on Regional Comparison - Rest of World (ROW)
Data Table on Regional Comparison - Rest of World (ROW)

12.6.1 Brazil - Market size and forecast 2025-2030

Chart on Brazil - Market size and forecast 2025-2030 ($ million)
Data Table on Brazil - Market size and forecast 2025-2030 ($ million)
Chart on Brazil - Year-over-year growth 2025-2030 (%)
Data Table on Brazil - Year-over-year growth 2025-2030 (%)

12.6.2 Australia - Market size and forecast 2025-2030

Chart on Australia - Market size and forecast 2025-2030 ($ million)
Data Table on Australia - Market size and forecast 2025-2030 ($ million)
Chart on Australia - Year-over-year growth 2025-2030 (%)
Data Table on Australia - Year-over-year growth 2025-2030 (%)

12.6.3 UAE - Market size and forecast 2025-2030

Chart on UAE - Market size and forecast 2025-2030 ($ million)
Data Table on UAE - Market size and forecast 2025-2030 ($ million)
Chart on UAE - Year-over-year growth 2025-2030 (%)
Data Table on UAE - Year-over-year growth 2025-2030 (%)

12.6.4 Saudi Arabia - Market size and forecast 2025-2030

Chart on Saudi Arabia - Market size and forecast 2025-2030 ($ million)
Data Table on Saudi Arabia - Market size and forecast 2025-2030 ($ million)
Chart on Saudi Arabia - Year-over-year growth 2025-2030 (%)
Data Table on Saudi Arabia - Year-over-year growth 2025-2030 (%)

12.6.5 Turkey - Market size and forecast 2025-2030

Chart on Turkey - Market size and forecast 2025-2030 ($ million)
Data Table on Turkey - Market size and forecast 2025-2030 ($ million)
Chart on Turkey - Year-over-year growth 2025-2030 (%)
Data Table on Turkey - Year-over-year growth 2025-2030 (%)

12.6.6 South Africa - Market size and forecast 2025-2030

Chart on South Africa - Market size and forecast 2025-2030 ($ million)
Data Table on South Africa - Market size and forecast 2025-2030 ($ million)
Chart on South Africa - Year-over-year growth 2025-2030 (%)
Data Table on South Africa - Year-over-year growth 2025-2030 (%)

12.6.7 Israel - Market size and forecast 2025-2030

Chart on Israel - Market size and forecast 2025-2030 ($ million)
Data Table on Israel - Market size and forecast 2025-2030 ($ million)
Chart on Israel - Year-over-year growth 2025-2030 (%)
Data Table on Israel - Year-over-year growth 2025-2030 (%)

12.6.8 Argentina - Market size and forecast 2025-2030

Chart on Argentina - Market size and forecast 2025-2030 ($ million)
Data Table on Argentina - Market size and forecast 2025-2030 ($ million)
Chart on Argentina - Year-over-year growth 2025-2030 (%)
Data Table on Argentina - Year-over-year growth 2025-2030 (%)

12.7 Market opportunity by geography

Market opportunity by geography ($ million)
Data Tables on Market opportunity by geography ($ million)

13. Drivers, Challenges, and Opportunity

13.1 Market drivers

Focused delivery technologies enable precision genetic silencing
Expanding chronic disease burdens drive target validation
Strategic corporate collaborations accelerate early commercial pipelines

13.2 Market challenges

Targeted extrahepatic tissue delivery barriers restrict reach
High manufacturing overhead and oligonucleotide synthesis costs
Transient gene silencing requires persistent lifetime dosing

13.3 Impact of drivers and challenges

Impact of drivers and challenges in 2025 and 2030

13.4 Market opportunities

Next generation conjugation formulations dominate pipeline development
Strategic out licensing partnerships accelerate enterprise commercialization
Central nervous system delivery research expands neurological applications

14. Competitive Landscape

14.1 Overview

14.2

Overview on criticality of inputs and factors of differentiation

14.3 Landscape disruption

Overview on factors of disruption

14.4 Industry risks

Impact of key risks on business

15. Competitive Analysis

15.1 Companies profiled

Companies covered

15.2 Company ranking index

15.3 Market positioning of companies

Matrix on companies position and classification

15.4 Arrowhead Pharmaceuticals Inc.

Arrowhead Pharmaceuticals Inc. - Overview
Arrowhead Pharmaceuticals Inc. - Product / Service
Arrowhead Pharmaceuticals Inc. - Key offerings
SWOT

15.5 BioNTech SE

BioNTech SE - Overview
BioNTech SE - Product / Service
BioNTech SE - Key offerings
SWOT

15.6 Calando Pharmaceuticals Inc.

Calando Pharmaceuticals Inc. - Overview
Calando Pharmaceuticals Inc. - Product / Service
Calando Pharmaceuticals Inc. - Key offerings
SWOT

15.7 Enzene Biosciences Ltd.

Enzene Biosciences Ltd. - Overview
Enzene Biosciences Ltd. - Product / Service
Enzene Biosciences Ltd. - Key offerings
SWOT

15.8 Genevant Sciences Corp.

Genevant Sciences Corp. - Overview
Genevant Sciences Corp. - Product / Service
Genevant Sciences Corp. - Key offerings
SWOT

15.9 Ionis Pharmaceuticals Inc.

Ionis Pharmaceuticals Inc. - Overview
Ionis Pharmaceuticals Inc. - Product / Service
Ionis Pharmaceuticals Inc. - Key offerings
SWOT

15.10 Merck and Co. Inc.

Merck and Co. Inc. - Overview
Merck and Co. Inc. - Business segments
Merck and Co. Inc. - Key news
Merck and Co. Inc. - Key offerings
Merck and Co. Inc. - Segment focus
SWOT

15.11 Novartis AG

Novartis AG - Overview
Novartis AG - Business segments
Novartis AG - Key news
Novartis AG - Key offerings
Novartis AG - Segment focus
SWOT

15.12 OliX Pharmaceuticals Inc.

OliX Pharmaceuticals Inc. - Overview
OliX Pharmaceuticals Inc. - Product / Service
OliX Pharmaceuticals Inc. - Key offerings
SWOT

15.13 Pfizer Inc.

Pfizer Inc. - Overview
Pfizer Inc. - Business segments
Pfizer Inc. - Key news
Pfizer Inc. - Key offerings
Pfizer Inc. - Segment focus
SWOT

15.14 Sanofi SA

Sanofi SA - Overview
Sanofi SA - Business segments
Sanofi SA - Key news
Sanofi SA - Key offerings
Sanofi SA - Segment focus
SWOT

15.15 Switch Therapeutics Inc.

Switch Therapeutics Inc. - Overview
Switch Therapeutics Inc. - Product / Service
Switch Therapeutics Inc. - Key offerings
SWOT

15.16 Sylentis S.A.

Sylentis S.A. - Overview
Sylentis S.A. - Product / Service
Sylentis S.A. - Key offerings
SWOT

15.17 Takeda Pharmaceutical Ltd.

Takeda Pharmaceutical Ltd. - Overview
Takeda Pharmaceutical Ltd. - Business segments
Takeda Pharmaceutical Ltd. - Key news
Takeda Pharmaceutical Ltd. - Key offerings
Takeda Pharmaceutical Ltd. - Segment focus
SWOT

15.18 Vir Biotechnology Inc.

Vir Biotechnology Inc. - Overview
Vir Biotechnology Inc. - Product / Service
Vir Biotechnology Inc. - Key offerings
SWOT

16. Appendix

16.1 Scope of the report

Market definition
Objectives
Notes and caveats

16.2 Inclusions and exclusions checklist

Inclusions checklist
Exclusions checklist

16.3 Currency conversion rates for US$

16.4 Research methodology

16.5 Data procurement

Information sources

16.6 Data validation

16.7 Validation techniques employed for market sizing

16.8 Data synthesis

16.9 360 degree market analysis

16.10 List of abbreviations

Research Methodology

Technavio presents a detailed picture of the market by way of study, synthesis, and summation of data from multiple sources. The analysts have presented the various facets of the market with a particular focus on identifying the key industry influencers. The data thus presented is comprehensive, reliable, and the result of extensive research, both primary and secondary.

INFORMATION SOURCES

Primary sources

  • Manufacturers and suppliers
  • Channel partners
  • Industry experts
  • Strategic decision makers

Secondary sources

  • Industry journals and periodicals
  • Government data
  • Financial reports of key industry players
  • Historical data
  • Press releases

DATA ANALYSIS

Data Synthesis

  • Collation of data
  • Estimation of key figures
  • Analysis of derived insights

Data Validation

  • Triangulation with data models
  • Reference against proprietary databases
  • Corroboration with industry experts

REPORT WRITING

Qualitative

  • Market drivers
  • Market challenges
  • Market trends
  • Five forces analysis

Quantitative

  • Market size and forecast
  • Market segmentation
  • Geographical insights
  • Competitive landscape

Interested in this report?

Get your sample now to see our research methodology and insights!

Download Now

Frequently Asked Questions

Rnai Drug Delivery market growth will increase by USD 184606.4 million during 2026-2030.

The Rnai Drug Delivery market is expected to grow at a CAGR of 20% during 2026-2030.

Rnai Drug Delivery market is segmented by Technology (Nanoparticle drug delivery, Pulmonary drug delivery, Nucleic acid drug delivery, Aptamer drug delivery) Application (Infectious diseases, Oncology, Cardiology, Neurology, Others) Route of administration (Intravenous delivery, Subcutaneous delivery, Intrathecal, Intramuscular)

Acuitas Therapeutics, ADARx Pharmaceuticals Inc., Alnylam Pharmaceuticals Inc., Aptadel Therapeutics, Arbutus Biopharma Corp., Arrowhead Pharmaceuticals Inc., BioNTech SE, Calando Pharmaceuticals Inc., Enzene Biosciences Ltd., Genevant Sciences Corp., Ionis Pharmaceuticals Inc., Merck and Co. Inc., Novartis AG, OliX Pharmaceuticals Inc., Pfizer Inc., Sanofi SA, Switch Therapeutics Inc., Sylentis S.A., Takeda Pharmaceutical Ltd., Vir Biotechnology Inc. are a few of the key vendors in the Rnai Drug Delivery market.

North America will register the highest growth rate of 43.9% among the other regions. Therefore, the Rnai Drug Delivery market in North America is expected to garner significant business opportunities for the vendors during the forecast period.

US, Canada, Mexico, Germany, UK, France, Italy, Spain, The Netherlands, China, India, Japan, South Korea, Indonesia, Thailand, Brazil, Australia, UAE, Saudi Arabia, Turkey, South Africa, Israel, Argentina

  • Focused delivery technologies enable precision genetic silencing is the driving factor this market.

The Rnai Drug Delivery market vendors should focus on grabbing business opportunities from the Technology segment as it accounted for the largest market share in the base year.
RIA - Research AI Assistant
Ask RIA
