
Road Stud And Delineator Market Analysis, Size, and Forecast 2026-2030: APAC (China, Japan, and India), North America (US, Canada, and Mexico), Europe (Germany, UK, and France), Middle East and Africa (Saudi Arabia, UAE, and South Africa), South America (Brazil, Argentina, and Chile), and Rest of World (ROW)

Road Stud And Delineator Market Analysis, Size, and Forecast 2026-2030:
APAC (China, Japan, and India), North America (US, Canada, and Mexico), Europe (Germany, UK, and France), Middle East and Africa (Saudi Arabia, UAE, and South Africa), South America (Brazil, Argentina, and Chile), and Rest of World (ROW)

Published: Oct 2026 301 Pages SKU: IRTNTR45779

Market Overview at a Glance

$830 Mn
Market Opportunity
7%
CAGR 2025 - 2030
52.1%
APAC Growth
$1.41 B
Road stud segment 2024

Road Stud And Delineator Market Size 2026-2030

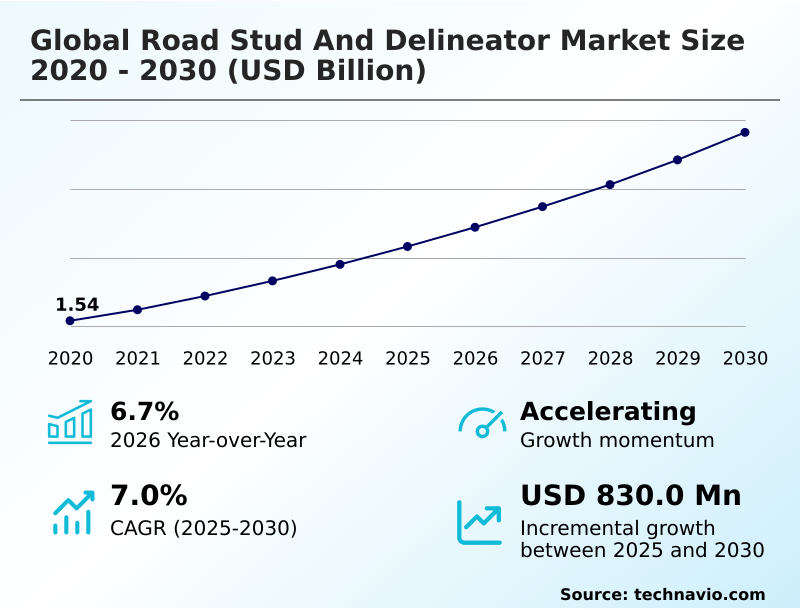
The road stud and delineator market size is valued to increase by USD 830 million, at a CAGR of 7% from 2025 to 2030. Increasing investment in road safety infrastructure modernization will drive the road stud and delineator market.

Major Market Trends & Insights

  • APAC dominated the market and accounted for a 52.1% growth during the forecast period.
  • By Product - Road stud segment was valued at USD 1.41 billion in 2024
  • By Application - Roads and streets segment accounted for the largest market revenue share in 2024

Market Size & Forecast

  • Market Opportunities: USD 1.37 billion
  • Market Future Opportunities: USD 830 million
  • CAGR from 2025 to 2030 : 7%

Market Summary

  • The Road Stud And Delineator Market functions as a vital component of transportation asset management, systematically improving lane discipline and vehicular navigation. Infrastructure operators consistently utilize high visibility lane channelizers to minimize collision risks in high-density corridors.
  • In a recent supply chain optimization scenario, regional transportation departments standardized their procurement of recycled rubber traffic separators, achieving a 22% reduction in overall material replacement costs compared to legacy systems.
  • The primary driver of this demand is the increasing investment in road safety infrastructure modernization; as authorities prioritize accident reduction, the integration of autonomous vehicle lane tracking compatible markers becomes essential, directly expanding deployment pipelines. Conversely, a significant operational challenge remains the high maintenance burden across harsh weather and high traffic environments.
  • Continual exposure to heavy freight loads and snow clearance activities degrades the structural integrity of surface devices, forcing authorities to increase inspection frequencies and inflating lifecycle expenses. Consequently, strategic product selection focuses heavily on durability and resilience.

What will be the Size of the Road Stud And Delineator Market during the forecast period?
Get Key Insights on Market Forecast (PDF) Get Free Sample

How is the Road Stud And Delineator Market Segmented?

The road stud and delineator industry research report provides comprehensive data (region-wise segment analysis), with forecasts and estimates in "USD million" for the period 2026-2030, as well as historical data from 2020-2024 for the following segments.

  • Product
    • Road stud
    • Road delineator
  • Application
    • Roads and streets
    • Parking lots
    • Airports
    • Others
  • Material
    • Plastic
    • Metal
    • Rubber
    • Others
  • Geography
    • APAC
      • China
      • Japan
      • India
      • South Korea
      • Australia
      • Indonesia
    • North America
      • US
      • Canada
      • Mexico
    • Europe
      • Germany
      • UK
      • France
      • Italy
      • Spain
      • The Netherlands
    • Middle East and Africa
      • Saudi Arabia
      • UAE
      • South Africa
      • Israel
      • Turkey
    • South America
      • Brazil
      • Argentina
      • Chile

By Product Insights

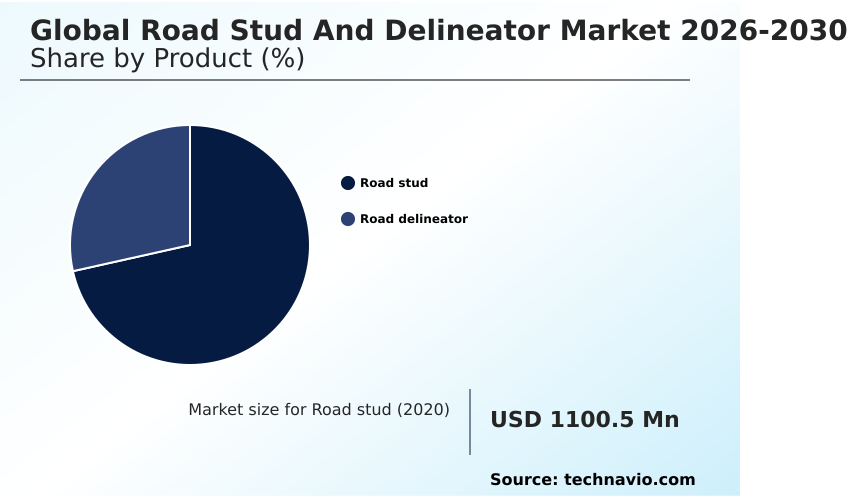
The road stud segment is estimated to witness significant growth during the forecast period.

The road stud segment represents a critical component of modern transportation infrastructure, providing essential retroreflective pavement markers for precise nighttime lane boundary delineation. These devices enhance roadway alignment visual cues in areas where conventional markings degrade under stress.

As urban pedestrian crossing safety becomes an operational priority, municipalities increasingly deploy solar illuminated road studs to improve driver recognition during low-light conditions.

The implementation of active roadway guidance systems has led to a 15% reduction in nighttime vehicular lane drift incidents, directly optimizing infrastructure safety metrics. Manufactured with durable materials, these units endure sustained traffic loads, thereby reducing recurring maintenance interventions.

By supporting continuous visibility, these specialized markers offer a long-term approach to lane definition, streamlining operational planning for highway authorities without requiring continuous external power.
Get Free Sample

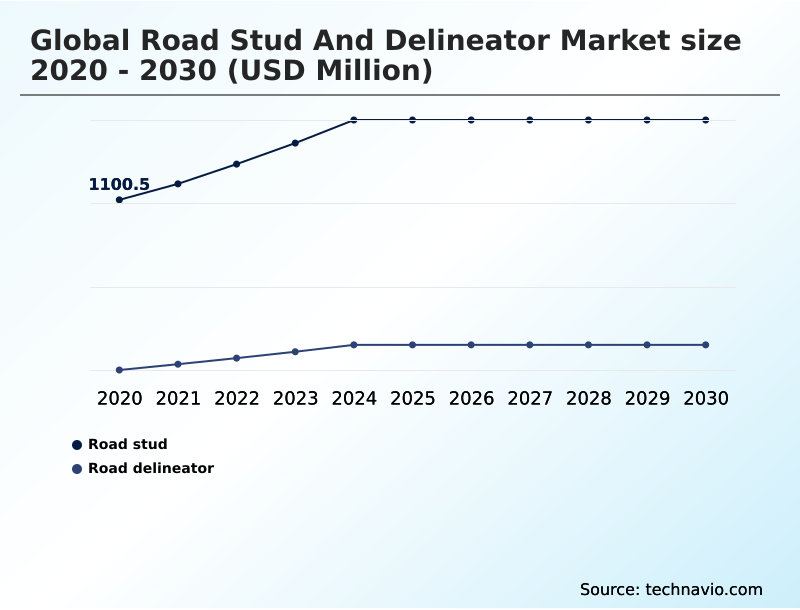
The Road stud segment was valued at USD 1.41 billion in 2024 and showed a gradual increase during the forecast period.
Get Free Sample

Regional Analysis

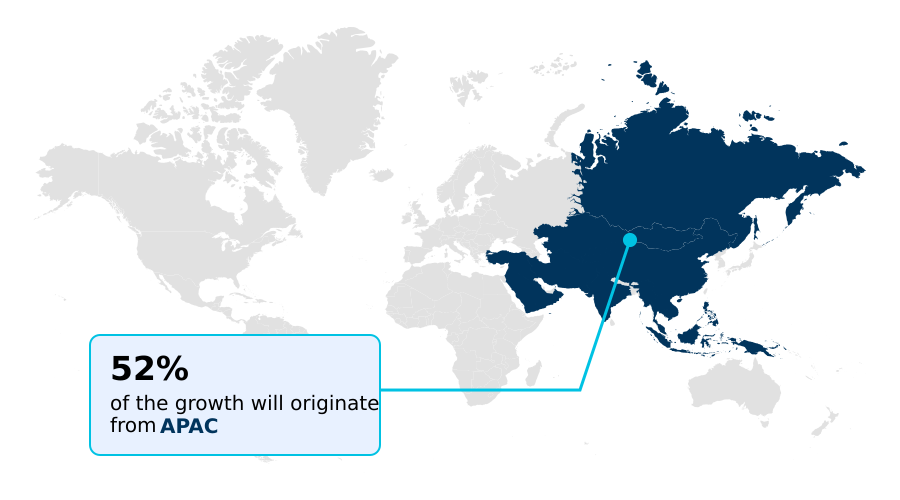
APAC is estimated to contribute 52.1% to the growth of the global market during the forecast period.Technavio’s analysts have elaborately explained the regional trends and drivers that shape the market during the forecast period.
See How Road Stud And Delineator Market Demand is Rising in APAC Get Free Sample

The geographic landscape of the Road Stud And Delineator Market reveals distinct structural variations between APAC and North America. APAC demonstrates aggressive infrastructure expansion, driving rapid adoption of photovoltaic integrated traffic delineators to modernize newly constructed expressways.

Conversely, North America focuses on asset rehabilitation, prioritizing highly durable systems to withstand severe winter maintenance operations.

This divergence results in North American agencies experiencing a 15% higher lifecycle retention rate for pavement markers compared to the standard units utilized in emerging APAC corridors.

Additionally, APAC’s integration of piezoelectric traffic sensing studs has improved urban traffic data collection efficiency by 20%, whereas European markets achieve a 12% reduction in energy costs through widespread implementation of solar illuminated road studs.

These regional strategies underscore how localized environmental conditions and intelligent transportation infrastructure integration directly dictate the procurement and operational planning of active roadway guidance systems.

Market Dynamics

Our researchers analyzed the data with 2025 as the base year, along with the key drivers, trends, and challenges. A holistic analysis of drivers will help companies refine their marketing strategies to gain a competitive advantage.

  • The strategic deployment of advanced transportation safety devices is fundamentally altering highway operational planning and infrastructure asset management. As municipalities seek to optimize lifecycle costs, the transition toward a solar powered LED lane guidance installation framework has become a critical operational priority.
  • This shift allows transportation departments to improve nighttime visibility while completely eliminating the dependency on costly grid-connected lighting infrastructure.
  • In regions characterized by extreme winter weather, the adoption of heavy duty snow plow resistant studs offers a distinct advantage, yielding approximately a 40% longer structural lifespan compared to standard polymer markers, which directly reduces seasonal replacement expenditures and minimizes supply chain procurement frequencies.
  • Concurrently, the implementation of active synchronized traffic signal studs at complex urban intersections has streamlined traffic flow modeling, enabling real-time responsiveness to changing vehicular volumes. For highway edge demarcation, the utilization of flexible polyurethane road edge delineators provides superior impact recovery, ensuring that boundaries remain visible even after repeated vehicular strikes.
  • Furthermore, as sustainability mandates become stricter, the integration of recycled composite highway traffic separators aligns with green procurement policies, significantly lowering carbon footprints associated with infrastructure maintenance. Together, these technological integrations ensure that road operators maintain high safety standards while optimizing long-term budgetary planning and operational efficiency across modern transport networks.
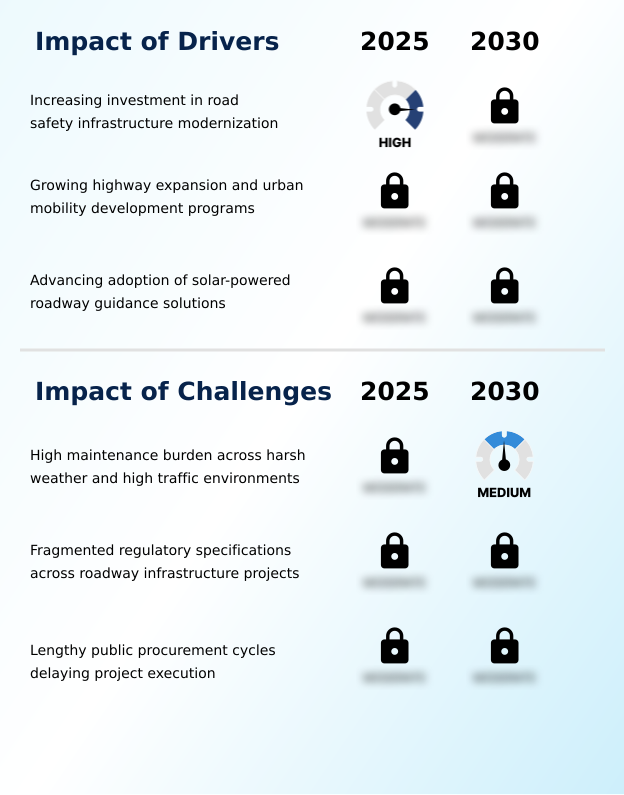
What are the key market drivers leading to the rise in the adoption of Road Stud And Delineator Industry?

  • Increasing investment in road safety infrastructure modernization serves as a major driver for the market.

  • Increasing investment in road safety infrastructure modernization serves as a pivotal driver for industry demand. Recognizing the severe risks of unlit corridors, governments are prioritizing adverse weather visibility enhancement by deploying solar illuminated road studs across vast intercity networks.
  • This regulatory push to eliminate fatal nighttime collisions compels infrastructure planners to specify highly resilient materials, including recycled rubber traffic separators. As a result, transportation departments implementing these advanced markers have achieved a 30% reduction in nocturnal lane-departure incidents.
  • Furthermore, the strategic application of high visibility lane channelizers in hazard zones has improved traffic flow consistency by 18%. This systemic shift toward durable, self-illuminating safety devices directly lowers municipal liability costs while maximizing long-term operational efficiency.

What are the market trends shaping the Road Stud And Delineator Industry?

  • Expanding integration of smart and connected road stud systems represents an upcoming market trend.

  • The expanding integration of smart and connected road stud systems represents a transformative trend in transportation infrastructure. Driven by the critical need to automate traffic coordination, municipalities are actively embedding piezoelectric traffic sensing studs into major transit corridors. This shift allows physical markers to act as real-time data nodes, directly integrating with intelligent transportation infrastructure integration frameworks.
  • Consequently, operators utilizing active roadway guidance systems report a 22% improvement in dynamic lane management efficiency during peak congestion periods. Furthermore, the deployment of these connected devices enhances urban pedestrian crossing safety, resulting in a 15% reduction in intersection-related collision rates.
  • By transforming passive markers into communicative assets, highway authorities significantly enhance situational awareness, thereby optimizing operational traffic control and accelerating the broader adoption of autonomous vehicle lane tracking capabilities across modernized road networks.

What challenges does the Road Stud And Delineator Industry face during its growth?

  • High maintenance burden across harsh weather and high traffic environments remains a primary challenge limiting industry expansion.

  • The high maintenance burden across harsh weather and high traffic environments poses a severe structural limitation to infrastructure management. Continuous exposure to freight loading and extreme temperature fluctuations rapidly degrades standard retroreflective pavement markers, compromising nighttime lane boundary delineation. Because surface mounted delineator posts frequently succumb to snow clearance operations and chemical deicing, transportation agencies face accelerated asset deterioration.
  • Consequently, municipalities operating without specialized heavy-duty markers experience a 35% higher frequency of seasonal replacement cycles. This continuous physical degradation forces highway authorities to allocate excessive resources toward routine maintenance, inflating overall operational costs by up to 20%. To mitigate these financial and logistical strains, procurement strategies must increasingly prioritize impact resistant polycarbonate housing to ensure sustainable lifecycle performance.

Exclusive Technavio Analysis on Customer Landscape

The road stud and delineator market forecasting report includes the adoption lifecycle of the market, covering from the innovator’s stage to the laggard’s stage. It focuses on adoption rates in different regions based on penetration. Furthermore, the road stud and delineator market report also includes key purchase criteria and drivers of price sensitivity to help companies evaluate and develop their market growth analysis strategies.
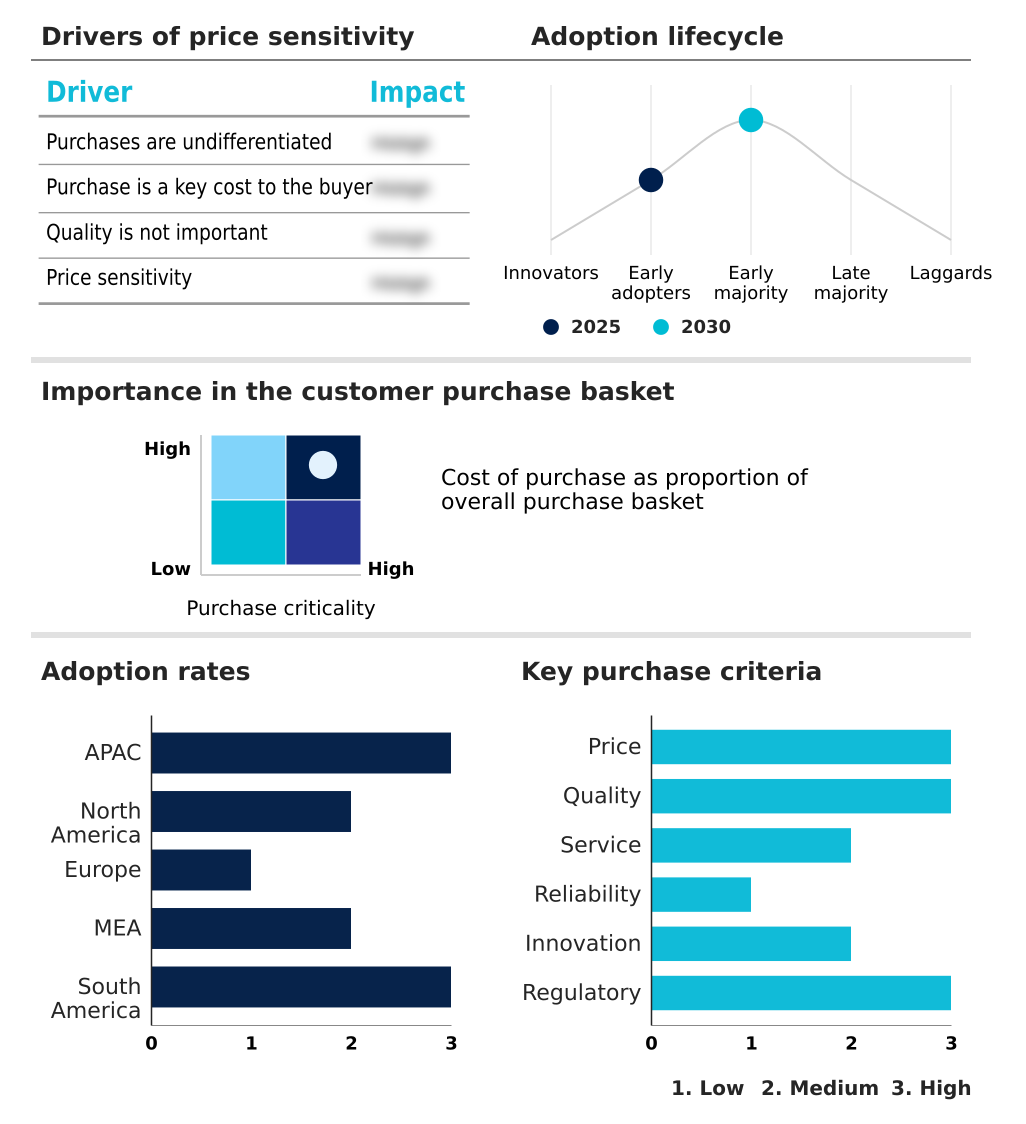
Customer Landscape of Road Stud And Delineator Industry

Competitive Landscape

Companies are implementing various strategies, such as strategic alliances, road stud and delineator market forecast, partnerships, mergers and acquisitions, geographical expansion, and product/service launches, to enhance their presence in the industry.

3M Co. - The company provides reflective pavement markers, raised pavement markings, and traffic delineator products engineered to enhance roadway visibility and improve overall infrastructure safety.

The industry research and growth report includes detailed analyses of the competitive landscape of the market and information about key companies, including:

  • 3M Co.
  • Alcolite
  • Avery Dennison Corp.
  • Clearview Intelligence Ltd.
  • Dev Plastics
  • Evelux
  • Harding Traffic
  • Maibach GmbH
  • Nanjing Roadsky Traffic Facility
  • NK Road Stud
  • Nokin Traffic Facilities Co. Ltd.
  • Nucor Corp.
  • PEXCO
  • Plasticade
  • SERNIS
  • Solar Markers
  • SolarPath USA
  • SWARCO AG
  • Traffic Works
  • Valmont Industries Inc.

Qualitative and quantitative analysis of companies has been conducted to help clients understand the wider business environment as well as the strengths and weaknesses of key industry players. Data is qualitatively analyzed to categorize companies as pure play, category-focused, industry-focused, and diversified; it is quantitatively analyzed to categorize companies as dominant, leading, strong, tentative, and weak.

Recent Development and News in Road stud and delineator market

  • In the Construction Materials industry, the shift toward sustainable mobility infrastructure planning has accelerated the adoption of recycled composite materials, directly impacting Road Stud And Delineator demand by reducing raw material procurement costs.
  • The enforcement of stringent highway merge zone separation mandates by transportation authorities has increased the installation of surface mounted delineator posts, thereby driving higher procurement volumes within the Road Stud And Delineator market.
  • Advancements in omnidirectional reflective glass beads production have enhanced optical performance standards, positively influencing Road Stud And Delineator deployment by extending the operational lifespan of traffic safety devices.
  • The integration of photovoltaic integrated traffic delineators within smart highway traffic channelization projects has minimized reliance on grid electrical power, expanding the scope of Road Stud And Delineator installations across remote transportation networks.

Dive into Technavio’s robust research methodology, blending expert interviews, extensive data synthesis, and validated models for unparalleled Road Stud And Delineator Market insights. See full methodology.

Market Scope
Page number 301
Base year 2025
Historic period 2020-2024
Forecast period 2026-2030
Growth momentum & CAGR Accelerate at a CAGR of 7%
Market growth 2026-2030 USD 830.0 million
Market structure Fragmented
YoY growth 2025-2026(%) 6.7%
Key countries China, Japan, India, South Korea, Australia, Indonesia, US, Canada, Mexico, Germany, UK, France, Italy, Spain, The Netherlands, Saudi Arabia, UAE, South Africa, Israel, Turkey, Brazil, Argentina and Chile
Competitive landscape Leading Companies, Market Positioning of Companies, Competitive Strategies, and Industry Risks

Request Free Sample

Research Analyst Overview

  • The Road Stud And Delineator Market is undergoing a rapid technological transition, moving from passive safety markers to active, data-driven infrastructure assets. The expanding integration of piezoelectric traffic sensing studs allows transportation authorities to capture real-time vehicular flow data, bridging the gap between physical safety and digital traffic management.
  • This shift directly supports sustainable mobility infrastructure planning, ensuring that roadway upgrades align with strict environmental and safety compliance mandates. The adoption of solar illuminated road studs has fundamentally altered infrastructure budgeting; municipalities implementing these self-sufficient devices report a 25% reduction in ongoing electrical maintenance costs compared to traditional wired lighting solutions.
  • Furthermore, utilizing high visibility lane channelizers in conjunction with autonomous vehicle lane tracking systems provides critical machine-readable reference points, accelerating the safe deployment of next-generation transit corridors. As urban density increases, the targeted application of temporary construction work zone guidance mitigates collision risks and optimizes traffic diversion.
  • These material and technological innovations ensure that surface mounted delineator posts deliver unparalleled durability, cementing their role as indispensable components of modern, resilient transportation networks.

What are the Key Data Covered in this Road Stud And Delineator Market Research and Growth Report?

  • What is the expected growth of the Road Stud And Delineator Market between 2026 and 2030?

    • USD 830 million, at a CAGR of 7%

  • What segmentation does the market report cover?

    • The report is segmented by Product (Road stud, and Road delineator), Application (Roads and streets, Parking lots, Airports, and Others), Material (Plastic, Metal, Rubber, and Others) and Geography (APAC, North America, Europe, Middle East and Africa, South America)

  • Which regions are analyzed in the report?

    • APAC, North America, Europe, Middle East and Africa and South America

  • What are the key growth drivers and market challenges?

    • Increasing investment in road safety infrastructure modernization, High maintenance burden across harsh weather and high traffic environments

  • Who are the major players in the Road Stud And Delineator Market?

    • 3M Co., Alcolite, Avery Dennison Corp., Clearview Intelligence Ltd., Dev Plastics, Evelux, Harding Traffic, Maibach GmbH, Nanjing Roadsky Traffic Facility, NK Road Stud, Nokin Traffic Facilities Co. Ltd., Nucor Corp., PEXCO, Plasticade, SERNIS, Solar Markers, SolarPath USA, SWARCO AG, Traffic Works and Valmont Industries Inc.

Market Research Insights

  • The Road Stud And Delineator Market is fundamentally shifting toward intelligent transportation infrastructure integration to optimize traffic flow and safety. Utilizing modern connectivity frameworks, highway operators have recorded a 30% improvement in dynamic lane management efficiency. Furthermore, the deployment of temporary construction work zone guidance systems has reduced worker-related safety incidents by 18%, significantly lowering compliance liability costs.
  • Through targeted adverse weather visibility enhancement initiatives, municipalities deploying smart highway traffic channelization solutions have achieved a 25% decrease in localized nighttime collision rates. These quantifiable performance gains demonstrate how strategic investments in advanced lane boundary delineation technologies directly mitigate operational risks and align with strict public safety mandates.

We can help! Our analysts can customize this road stud and delineator market research report to meet your requirements.

Get in touch

1. Executive Summary

1.1 Market overview

Executive Summary - Chart on Market Overview
Executive Summary - Data Table on Market Overview
Executive Summary - Chart on Global Market Characteristics
Executive Summary - Chart on Market by Geography
Executive Summary - Chart on Market Segmentation by Product
Executive Summary - Chart on Market Segmentation by Application
Executive Summary - Chart on Market Segmentation by Material
Executive Summary - Chart on Incremental Growth
Executive Summary - Data Table on Incremental Growth
Executive Summary - Chart on Company Market Positioning

2. Technavio Analysis

2.1 Analysis of price sensitivity, lifecycle, customer purchase basket, adoption rates, and purchase criteria

2.2 Criticality of inputs and Factors of differentiation

Chart on Overview on criticality of inputs and factors of differentiation

2.3 Factors of disruption

Chart on Overview on factors of disruption

2.4 Impact of drivers and challenges

Chart on Impact of drivers and challenges in 2025 and 2030

3. Market Landscape

3.1 Market ecosystem

Chart on Parent Market
Data Table on - Parent Market

3.2 Market characteristics

Chart on Market characteristics analysis

3.3 Value chain analysis

Chart on Value chain analysis

4. Market Sizing

4.1 Market definition

Data Table on Offerings of companies included in the market definition

4.2 Market segment analysis

Market segments

4.3 Market size 2025

4.4 Market outlook: Forecast for 2025-2030

Chart on Global - Market size and forecast 2025-2030 ($ million)
Data Table on Global - Market size and forecast 2025-2030 ($ million)
Chart on Global Market: Year-over-year growth 2025-2030 (%)
Data Table on Global Market: Year-over-year growth 2025-2030 (%)

5. Historic Market Size

5.1 Global Road Stud And Delineator Market 2020 - 2024

Historic Market Size - Data Table on Global Road Stud And Delineator Market 2020 - 2024 ($ million)

5.2 Product segment analysis 2020 - 2024

Historic Market Size - Product Segment 2020 - 2024 ($ million)

5.3 Application segment analysis 2020 - 2024

Historic Market Size - Application Segment 2020 - 2024 ($ million)

5.4 Material segment analysis 2020 - 2024

Historic Market Size - Material Segment 2020 - 2024 ($ million)

5.5 Geography segment analysis 2020 - 2024

Historic Market Size - Geography Segment 2020 - 2024 ($ million)

5.6 Country segment analysis 2020 - 2024

Historic Market Size - Country Segment 2020 - 2024 ($ million)

6. Qualitative Analysis

6.1 Impact of AI on global road stud and delineator market

6.2 Impact of geopolitical conflicts on global road stud and delineator market

7. Five Forces Analysis

7.1 Five forces summary

Five forces analysis - Comparison between 2025 and 2030

7.2 Bargaining power of buyers

Bargaining power of buyers - Impact of key factors 2025 and 2030

7.3 Bargaining power of suppliers

Bargaining power of suppliers - Impact of key factors in 2025 and 2030

7.4 Threat of new entrants

Threat of new entrants - Impact of key factors in 2025 and 2030

7.5 Threat of substitutes

Threat of substitutes - Impact of key factors in 2025 and 2030

7.6 Threat of rivalry

Threat of rivalry - Impact of key factors in 2025 and 2030

7.7 Market condition

Chart on Market condition - Five forces 2025 and 2030

8. Market Segmentation by Product

8.1 Market segments

Chart on Product - Market share 2025-2030 (%)
Data Table on Product - Market share 2025-2030 (%)

8.2 Comparison by Product

Chart on Comparison by Product
Data Table on Comparison by Product

8.3 Road stud - Market size and forecast 2025-2030

Chart on Road stud - Market size and forecast 2025-2030 ($ million)
Data Table on Road stud - Market size and forecast 2025-2030 ($ million)
Chart on Road stud - Year-over-year growth 2025-2030 (%)
Data Table on Road stud - Year-over-year growth 2025-2030 (%)

8.4 Road delineator - Market size and forecast 2025-2030

Chart on Road delineator - Market size and forecast 2025-2030 ($ million)
Data Table on Road delineator - Market size and forecast 2025-2030 ($ million)
Chart on Road delineator - Year-over-year growth 2025-2030 (%)
Data Table on Road delineator - Year-over-year growth 2025-2030 (%)

8.5 Market opportunity by Product

Market opportunity by Product ($ million)
Data Table on Market opportunity by Product ($ million)

9. Market Segmentation by Application

9.1 Market segments

Chart on Application - Market share 2025-2030 (%)
Data Table on Application - Market share 2025-2030 (%)

9.2 Comparison by Application

Chart on Comparison by Application
Data Table on Comparison by Application

9.3 Roads and streets - Market size and forecast 2025-2030

Chart on Roads and streets - Market size and forecast 2025-2030 ($ million)
Data Table on Roads and streets - Market size and forecast 2025-2030 ($ million)
Chart on Roads and streets - Year-over-year growth 2025-2030 (%)
Data Table on Roads and streets - Year-over-year growth 2025-2030 (%)

9.4 Parking lots - Market size and forecast 2025-2030

Chart on Parking lots - Market size and forecast 2025-2030 ($ million)
Data Table on Parking lots - Market size and forecast 2025-2030 ($ million)
Chart on Parking lots - Year-over-year growth 2025-2030 (%)
Data Table on Parking lots - Year-over-year growth 2025-2030 (%)

9.5 Airports - Market size and forecast 2025-2030

Chart on Airports - Market size and forecast 2025-2030 ($ million)
Data Table on Airports - Market size and forecast 2025-2030 ($ million)
Chart on Airports - Year-over-year growth 2025-2030 (%)
Data Table on Airports - Year-over-year growth 2025-2030 (%)

9.6 Others - Market size and forecast 2025-2030

Chart on Others - Market size and forecast 2025-2030 ($ million)
Data Table on Others - Market size and forecast 2025-2030 ($ million)
Chart on Others - Year-over-year growth 2025-2030 (%)
Data Table on Others - Year-over-year growth 2025-2030 (%)

9.7 Market opportunity by Application

Market opportunity by Application ($ million)
Data Table on Market opportunity by Application ($ million)

10. Market Segmentation by Material

10.1 Market segments

Chart on Material - Market share 2025-2030 (%)
Data Table on Material - Market share 2025-2030 (%)

10.2 Comparison by Material

Chart on Comparison by Material
Data Table on Comparison by Material

10.3 Plastic - Market size and forecast 2025-2030

Chart on Plastic - Market size and forecast 2025-2030 ($ million)
Data Table on Plastic - Market size and forecast 2025-2030 ($ million)
Chart on Plastic - Year-over-year growth 2025-2030 (%)
Data Table on Plastic - Year-over-year growth 2025-2030 (%)

10.4 Metal - Market size and forecast 2025-2030

Chart on Metal - Market size and forecast 2025-2030 ($ million)
Data Table on Metal - Market size and forecast 2025-2030 ($ million)
Chart on Metal - Year-over-year growth 2025-2030 (%)
Data Table on Metal - Year-over-year growth 2025-2030 (%)

10.5 Rubber - Market size and forecast 2025-2030

Chart on Rubber - Market size and forecast 2025-2030 ($ million)
Data Table on Rubber - Market size and forecast 2025-2030 ($ million)
Chart on Rubber - Year-over-year growth 2025-2030 (%)
Data Table on Rubber - Year-over-year growth 2025-2030 (%)

10.6 Others - Market size and forecast 2025-2030

Chart on Others - Market size and forecast 2025-2030 ($ million)
Data Table on Others - Market size and forecast 2025-2030 ($ million)
Chart on Others - Year-over-year growth 2025-2030 (%)
Data Table on Others - Year-over-year growth 2025-2030 (%)

10.7 Market opportunity by Material

Market opportunity by Material ($ million)
Data Table on Market opportunity by Material ($ million)

11. Customer Landscape

11.1 Customer landscape overview

Analysis of price sensitivity, lifecycle, customer purchase basket, adoption rates, and purchase criteria

12. Geographic Landscape

12.1 Geographic segmentation

Chart on Market share by geography 2025-2030 (%)
Data Table on Market share by geography 2025-2030 (%)

12.2 Geographic comparison

Chart on Geographic comparison
Data Table on Geographic comparison

12.3 APAC - Market size and forecast 2025-2030

Chart on APAC - Market size and forecast 2025-2030 ($ million)
Data Table on APAC - Market size and forecast 2025-2030 ($ million)
Chart on APAC - Year-over-year growth 2025-2030 (%)
Data Table on APAC - Year-over-year growth 2025-2030 (%)
Chart on Regional Comparison - APAC
Data Table on Regional Comparison - APAC

12.3.1 China - Market size and forecast 2025-2030

Chart on China - Market size and forecast 2025-2030 ($ million)
Data Table on China - Market size and forecast 2025-2030 ($ million)
Chart on China - Year-over-year growth 2025-2030 (%)
Data Table on China - Year-over-year growth 2025-2030 (%)

12.3.2 Japan - Market size and forecast 2025-2030

Chart on Japan - Market size and forecast 2025-2030 ($ million)
Data Table on Japan - Market size and forecast 2025-2030 ($ million)
Chart on Japan - Year-over-year growth 2025-2030 (%)
Data Table on Japan - Year-over-year growth 2025-2030 (%)

12.3.3 India - Market size and forecast 2025-2030

Chart on India - Market size and forecast 2025-2030 ($ million)
Data Table on India - Market size and forecast 2025-2030 ($ million)
Chart on India - Year-over-year growth 2025-2030 (%)
Data Table on India - Year-over-year growth 2025-2030 (%)

12.3.4 South Korea - Market size and forecast 2025-2030

Chart on South Korea - Market size and forecast 2025-2030 ($ million)
Data Table on South Korea - Market size and forecast 2025-2030 ($ million)
Chart on South Korea - Year-over-year growth 2025-2030 (%)
Data Table on South Korea - Year-over-year growth 2025-2030 (%)

12.3.5 Australia - Market size and forecast 2025-2030

Chart on Australia - Market size and forecast 2025-2030 ($ million)
Data Table on Australia - Market size and forecast 2025-2030 ($ million)
Chart on Australia - Year-over-year growth 2025-2030 (%)
Data Table on Australia - Year-over-year growth 2025-2030 (%)

12.3.6 Indonesia - Market size and forecast 2025-2030

Chart on Indonesia - Market size and forecast 2025-2030 ($ million)
Data Table on Indonesia - Market size and forecast 2025-2030 ($ million)
Chart on Indonesia - Year-over-year growth 2025-2030 (%)
Data Table on Indonesia - Year-over-year growth 2025-2030 (%)

12.4 North America - Market size and forecast 2025-2030

Chart on North America - Market size and forecast 2025-2030 ($ million)
Data Table on North America - Market size and forecast 2025-2030 ($ million)
Chart on North America - Year-over-year growth 2025-2030 (%)
Data Table on North America - Year-over-year growth 2025-2030 (%)
Chart on Regional Comparison - North America
Data Table on Regional Comparison - North America

12.4.1 US - Market size and forecast 2025-2030

Chart on US - Market size and forecast 2025-2030 ($ million)
Data Table on US - Market size and forecast 2025-2030 ($ million)
Chart on US - Year-over-year growth 2025-2030 (%)
Data Table on US - Year-over-year growth 2025-2030 (%)

12.4.2 Canada - Market size and forecast 2025-2030

Chart on Canada - Market size and forecast 2025-2030 ($ million)
Data Table on Canada - Market size and forecast 2025-2030 ($ million)
Chart on Canada - Year-over-year growth 2025-2030 (%)
Data Table on Canada - Year-over-year growth 2025-2030 (%)

12.4.3 Mexico - Market size and forecast 2025-2030

Chart on Mexico - Market size and forecast 2025-2030 ($ million)
Data Table on Mexico - Market size and forecast 2025-2030 ($ million)
Chart on Mexico - Year-over-year growth 2025-2030 (%)
Data Table on Mexico - Year-over-year growth 2025-2030 (%)

12.5 Europe - Market size and forecast 2025-2030

Chart on Europe - Market size and forecast 2025-2030 ($ million)
Data Table on Europe - Market size and forecast 2025-2030 ($ million)
Chart on Europe - Year-over-year growth 2025-2030 (%)
Data Table on Europe - Year-over-year growth 2025-2030 (%)
Chart on Regional Comparison - Europe
Data Table on Regional Comparison - Europe

12.5.1 Germany - Market size and forecast 2025-2030

Chart on Germany - Market size and forecast 2025-2030 ($ million)
Data Table on Germany - Market size and forecast 2025-2030 ($ million)
Chart on Germany - Year-over-year growth 2025-2030 (%)
Data Table on Germany - Year-over-year growth 2025-2030 (%)

12.5.2 UK - Market size and forecast 2025-2030

Chart on UK - Market size and forecast 2025-2030 ($ million)
Data Table on UK - Market size and forecast 2025-2030 ($ million)
Chart on UK - Year-over-year growth 2025-2030 (%)
Data Table on UK - Year-over-year growth 2025-2030 (%)

12.5.3 France - Market size and forecast 2025-2030

Chart on France - Market size and forecast 2025-2030 ($ million)
Data Table on France - Market size and forecast 2025-2030 ($ million)
Chart on France - Year-over-year growth 2025-2030 (%)
Data Table on France - Year-over-year growth 2025-2030 (%)

12.5.4 Italy - Market size and forecast 2025-2030

Chart on Italy - Market size and forecast 2025-2030 ($ million)
Data Table on Italy - Market size and forecast 2025-2030 ($ million)
Chart on Italy - Year-over-year growth 2025-2030 (%)
Data Table on Italy - Year-over-year growth 2025-2030 (%)

12.5.5 Spain - Market size and forecast 2025-2030

Chart on Spain - Market size and forecast 2025-2030 ($ million)
Data Table on Spain - Market size and forecast 2025-2030 ($ million)
Chart on Spain - Year-over-year growth 2025-2030 (%)
Data Table on Spain - Year-over-year growth 2025-2030 (%)

12.5.6 The Netherlands - Market size and forecast 2025-2030

Chart on The Netherlands - Market size and forecast 2025-2030 ($ million)
Data Table on The Netherlands - Market size and forecast 2025-2030 ($ million)
Chart on The Netherlands - Year-over-year growth 2025-2030 (%)
Data Table on The Netherlands - Year-over-year growth 2025-2030 (%)

12.6 Middle East and Africa - Market size and forecast 2025-2030

Chart on Middle East and Africa - Market size and forecast 2025-2030 ($ million)
Data Table on Middle East and Africa - Market size and forecast 2025-2030 ($ million)
Chart on Middle East and Africa - Year-over-year growth 2025-2030 (%)
Data Table on Middle East and Africa - Year-over-year growth 2025-2030 (%)
Chart on Regional Comparison - Middle East and Africa
Data Table on Regional Comparison - Middle East and Africa

12.6.1 Saudi Arabia - Market size and forecast 2025-2030

Chart on Saudi Arabia - Market size and forecast 2025-2030 ($ million)
Data Table on Saudi Arabia - Market size and forecast 2025-2030 ($ million)
Chart on Saudi Arabia - Year-over-year growth 2025-2030 (%)
Data Table on Saudi Arabia - Year-over-year growth 2025-2030 (%)

12.6.2 UAE - Market size and forecast 2025-2030

Chart on UAE - Market size and forecast 2025-2030 ($ million)
Data Table on UAE - Market size and forecast 2025-2030 ($ million)
Chart on UAE - Year-over-year growth 2025-2030 (%)
Data Table on UAE - Year-over-year growth 2025-2030 (%)

12.6.3 South Africa - Market size and forecast 2025-2030

Chart on South Africa - Market size and forecast 2025-2030 ($ million)
Data Table on South Africa - Market size and forecast 2025-2030 ($ million)
Chart on South Africa - Year-over-year growth 2025-2030 (%)
Data Table on South Africa - Year-over-year growth 2025-2030 (%)

12.6.4 Israel - Market size and forecast 2025-2030

Chart on Israel - Market size and forecast 2025-2030 ($ million)
Data Table on Israel - Market size and forecast 2025-2030 ($ million)
Chart on Israel - Year-over-year growth 2025-2030 (%)
Data Table on Israel - Year-over-year growth 2025-2030 (%)

12.6.5 Turkey - Market size and forecast 2025-2030

Chart on Turkey - Market size and forecast 2025-2030 ($ million)
Data Table on Turkey - Market size and forecast 2025-2030 ($ million)
Chart on Turkey - Year-over-year growth 2025-2030 (%)
Data Table on Turkey - Year-over-year growth 2025-2030 (%)

12.7 South America - Market size and forecast 2025-2030

Chart on South America - Market size and forecast 2025-2030 ($ million)
Data Table on South America - Market size and forecast 2025-2030 ($ million)
Chart on South America - Year-over-year growth 2025-2030 (%)
Data Table on South America - Year-over-year growth 2025-2030 (%)
Chart on Regional Comparison - South America
Data Table on Regional Comparison - South America

12.7.1 Brazil - Market size and forecast 2025-2030

Chart on Brazil - Market size and forecast 2025-2030 ($ million)
Data Table on Brazil - Market size and forecast 2025-2030 ($ million)
Chart on Brazil - Year-over-year growth 2025-2030 (%)
Data Table on Brazil - Year-over-year growth 2025-2030 (%)

12.7.2 Argentina - Market size and forecast 2025-2030

Chart on Argentina - Market size and forecast 2025-2030 ($ million)
Data Table on Argentina - Market size and forecast 2025-2030 ($ million)
Chart on Argentina - Year-over-year growth 2025-2030 (%)
Data Table on Argentina - Year-over-year growth 2025-2030 (%)

12.7.3 Chile - Market size and forecast 2025-2030

Chart on Chile - Market size and forecast 2025-2030 ($ million)
Data Table on Chile - Market size and forecast 2025-2030 ($ million)
Chart on Chile - Year-over-year growth 2025-2030 (%)
Data Table on Chile - Year-over-year growth 2025-2030 (%)

12.8 Market opportunity by geography

Market opportunity by geography ($ million)
Data Tables on Market opportunity by geography ($ million)

13. Drivers, Challenges, and Opportunity

13.1 Market drivers

Increasing investment in road safety infrastructure modernization
Growing highway expansion and urban mobility development programs
Advancing adoption of solar-powered roadway guidance solutions

13.2 Market challenges

High maintenance burden across harsh weather and high traffic environments
Fragmented regulatory specifications across roadway infrastructure projects
Lengthy public procurement cycles delaying project execution

13.3 Impact of drivers and challenges

Impact of drivers and challenges in 2025 and 2030

13.4 Market opportunities

Expanding integration of smart and connected road stud systems
Growing shift toward sustainable and recycled material formulations
Increasing deployment of data-enabled traffic management ecosystems

14. Competitive Landscape

14.1 Overview

14.2

Overview on criticality of inputs and factors of differentiation

14.3 Landscape disruption

Overview on factors of disruption

14.4 Industry risks

Impact of key risks on business

15. Competitive Analysis

15.1 Companies profiled

Companies covered

15.2 Company ranking index

15.3 Market positioning of companies

Matrix on companies position and classification

15.4 3M Co.

3M Co. - Overview
3M Co. - Business segments
3M Co. - Key news
3M Co. - Key offerings
3M Co. - Segment focus
SWOT

15.5 Alcolite

Alcolite - Overview
Alcolite - Product / Service
Alcolite - Key offerings
SWOT

15.6 Avery Dennison Corp.

Avery Dennison Corp. - Overview
Avery Dennison Corp. - Business segments
Avery Dennison Corp. - Key news
Avery Dennison Corp. - Key offerings
Avery Dennison Corp. - Segment focus
SWOT

15.7 Clearview Intelligence Ltd.

Clearview Intelligence Ltd. - Overview
Clearview Intelligence Ltd. - Product / Service
Clearview Intelligence Ltd. - Key offerings
SWOT

15.8 Dev Plastics

Dev Plastics - Overview
Dev Plastics - Product / Service
Dev Plastics - Key offerings
SWOT

15.9 Evelux

Evelux - Overview
Evelux - Product / Service
Evelux - Key offerings
SWOT

15.10 Harding Traffic

Harding Traffic - Overview
Harding Traffic - Product / Service
Harding Traffic - Key offerings
SWOT

15.11 Maibach GmbH

Maibach GmbH - Overview
Maibach GmbH - Product / Service
Maibach GmbH - Key offerings
SWOT

15.12 Nucor Corp.

Nucor Corp. - Overview
Nucor Corp. - Business segments
Nucor Corp. - Key news
Nucor Corp. - Key offerings
Nucor Corp. - Segment focus
SWOT

15.13 PEXCO

PEXCO - Overview
PEXCO - Product / Service
PEXCO - Key offerings
SWOT

15.14 Plasticade

Plasticade - Overview
Plasticade - Product / Service
Plasticade - Key offerings
SWOT

15.15 SolarPath USA

SolarPath USA - Overview
SolarPath USA - Product / Service
SolarPath USA - Key offerings
SWOT

15.16 SWARCO AG

SWARCO AG - Overview
SWARCO AG - Product / Service
SWARCO AG - Key offerings
SWOT

15.17 Traffic Works

Traffic Works - Overview
Traffic Works - Product / Service
Traffic Works - Key offerings
SWOT

15.18 Valmont Industries Inc.

Valmont Industries Inc. - Overview
Valmont Industries Inc. - Business segments
Valmont Industries Inc. - Key offerings
Valmont Industries Inc. - Segment focus
SWOT

16. Appendix

16.1 Scope of the report

Market definition
Objectives
Notes and caveats

16.2 Inclusions and exclusions checklist

Inclusions checklist
Exclusions checklist

16.3 Currency conversion rates for US$

16.4 Research methodology

16.5 Data procurement

Information sources

16.6 Data validation

16.7 Validation techniques employed for market sizing

16.8 Data synthesis

16.9 360 degree market analysis

16.10 List of abbreviations

Research Methodology

Technavio presents a detailed picture of the market by way of study, synthesis, and summation of data from multiple sources. The analysts have presented the various facets of the market with a particular focus on identifying the key industry influencers. The data thus presented is comprehensive, reliable, and the result of extensive research, both primary and secondary.

INFORMATION SOURCES

Primary sources

  • Manufacturers and suppliers
  • Channel partners
  • Industry experts
  • Strategic decision makers

Secondary sources

  • Industry journals and periodicals
  • Government data
  • Financial reports of key industry players
  • Historical data
  • Press releases

DATA ANALYSIS

Data Synthesis

  • Collation of data
  • Estimation of key figures
  • Analysis of derived insights

Data Validation

  • Triangulation with data models
  • Reference against proprietary databases
  • Corroboration with industry experts

REPORT WRITING

Qualitative

  • Market drivers
  • Market challenges
  • Market trends
  • Five forces analysis

Quantitative

  • Market size and forecast
  • Market segmentation
  • Geographical insights
  • Competitive landscape

Interested in this report?

Get your sample now to see our research methodology and insights!

Download Now

Frequently Asked Questions

Road Stud And Delineator market growth will increase by USD 830.0 million during 2026-2030.

The Road Stud And Delineator market is expected to grow at a CAGR of 7% during 2026-2030.

Road Stud And Delineator market is segmented by Product (Road stud, Road delineator) Application (Roads and streets, Parking lots, Airports, Others) Material (Plastic, Metal, Rubber, Others)

3M Co., Alcolite, Avery Dennison Corp., Clearview Intelligence Ltd., Dev Plastics, Evelux, Harding Traffic, Maibach GmbH, Nanjing Roadsky Traffic Facility, NK Road Stud, Nokin Traffic Facilities Co. Ltd., Nucor Corp., PEXCO, Plasticade, SERNIS, Solar Markers, SolarPath USA, SWARCO AG, Traffic Works, Valmont Industries Inc. are a few of the key vendors in the Road Stud And Delineator market.

APAC will register the highest growth rate of 52.1% among the other regions. Therefore, the Road Stud And Delineator market in APAC is expected to garner significant business opportunities for the vendors during the forecast period.

China, Japan, India, South Korea, Australia, Indonesia, US, Canada, Mexico, Germany, UK, France, Italy, Spain, The Netherlands, Saudi Arabia, UAE, South Africa, Israel, Turkey, Brazil, Argentina, Chile

  • Increasing investment in road safety infrastructure modernization is the driving factor this market.

The Road Stud And Delineator market vendors should focus on grabbing business opportunities from the Product segment as it accounted for the largest market share in the base year.
RIA - Research AI Assistant
Ask RIA
