Rotary Kiln Market Size 2025-2029
The rotary kiln market size is forecast to increase by USD 179.2 million, at a CAGR of 3.3% between 2024 and 2029.
- The market is driven by the expansion and installation of new steel manufacturing plants, as the demand for steel continues to grow in various sectors such as construction, automotive, and infrastructure. This trend is particularly prominent in emerging economies, where industrialization and urbanization are on the rise. Additionally, the use of alternative fuels in rotary kilns is gaining popularity as a means to reduce carbon emissions and comply with environmental regulations.
- One significant obstacle is the growing restrictions on using blast furnaces due to increasing environmental regulations, which may lead to a shift towards rotary kilns as a more sustainable alternative. Another challenge is the high capital investment required for the installation and maintenance of rotary kilns, which may deter some potential entrants from the market. Companies seeking to capitalize on market opportunities should focus on innovation, energy efficiency, and sustainability, while navigating regulatory challenges and managing costs effectively.
What will be the Size of the Rotary Kiln Market during the forecast period?

Explore in-depth regional segment analysis with market size data - historical 2019-2023 and forecasts 2025-2029 - in the full report.
Request Free Sample
- The market is experiencing significant activity and trends in waste management and circular economy sectors. The rotary kiln system continues to be a key technology for kiln modernization and innovation, driving resource recovery through advanced control systems, kiln upgrade, and digital transformation. Dry process kilns, such as rotary kilns, are gaining popularity due to their energy efficiency and reduced emissions. Vertical shaft kilns and fluidized bed technology are also advancing, offering improved process simulation and smart manufacturing capabilities. Artificial intelligence and machine learning are increasingly being integrated into kiln technology for optimization and digital twin development.
- Data analytics and kiln optimization are essential for enhancing performance and sustainability in the context of sustainable development. Remote monitoring and Internet of Things technologies enable real-time kiln maintenance and improve overall kiln operation, especially in wet process applications. Kiln design optimization and energy audit are crucial for ensuring efficient and eco-friendly operations. The integration of advanced technologies is revolutionizing the rotary kiln industry, offering new opportunities for business growth and innovation.
How is this Rotary Kiln Industry segmented?
The rotary kiln industry research report provides comprehensive data (region-wise segment analysis), with forecasts and estimates in "USD million" for the period 2025-2029, as well as historical data from 2019-2023 for the following segments.
- Application
- Cement
- Metallurgy
- Chemicals
- Others
- Product
- Cement kiln
- Metallurgy chemical kiln
- Lime kiln
- Source
- Coal-fired
- Natural gas-fired
- Alternative fuels
- Electric
- Capacity
- Medium capacity
- Large capacity
- Small capacity
- Geography
- North America
- US
- Canada
- Europe
- Germany
- Russia
- UK
- APAC
- China
- India
- Indonesia
- Japan
- South Korea
- Rest of World (ROW)
- North America
By Application Insights
The cement segment is estimated to witness significant growth during the forecast period. The market experienced significant growth in 2024, with cement as the leading application segment. The expansion of cement production worldwide, driven by an increase in construction projects, infrastructural development, and urbanization, particularly in emerging economies like India and China, is the primary factor fueling this growth. Rotary kilns play a crucial role in cement manufacturing, enabling high thermal efficiency and fuel efficiency. Process optimization and green technology are essential trends in the market, with a focus on reducing environmental impact and improving clinker quality. Environmental regulations are increasingly stringent, necessitating advanced emissions control systems and dust collection technologies.
Kiln design and process control systems are being optimized to enhance production capacity and improve product quality. Alternative fuels, such as waste and biomass, are being integrated into rotary kiln systems to enhance energy efficiency and reduce reliance on traditional fossil fuels. Material handling and mineral composition analysis are critical aspects of rotary kiln operation, ensuring consistent raw material feed and optimal kiln lining performance. Heat transfer, heat recovery, and energy management are essential components of rotary kiln design, with a focus on minimizing energy consumption and maximizing thermal efficiency. Kiln rotation and kiln speed are also crucial factors in optimizing production and improving overall process performance.
The market is dynamic, with ongoing advancements in refractory materials, particle size distribution, and material characterization. Metallurgical applications and lime production are other significant areas of application for rotary kilns, with a focus on improving process integration and reducing capital expenditures. The market is poised for continued growth, driven by the expansion of cement production and the need for sustainable, efficient, and cost-effective manufacturing processes. The integration of advanced technologies and innovative solutions is essential to meet the evolving demands of the market and address the challenges of environmental regulations, energy efficiency, and material handling.
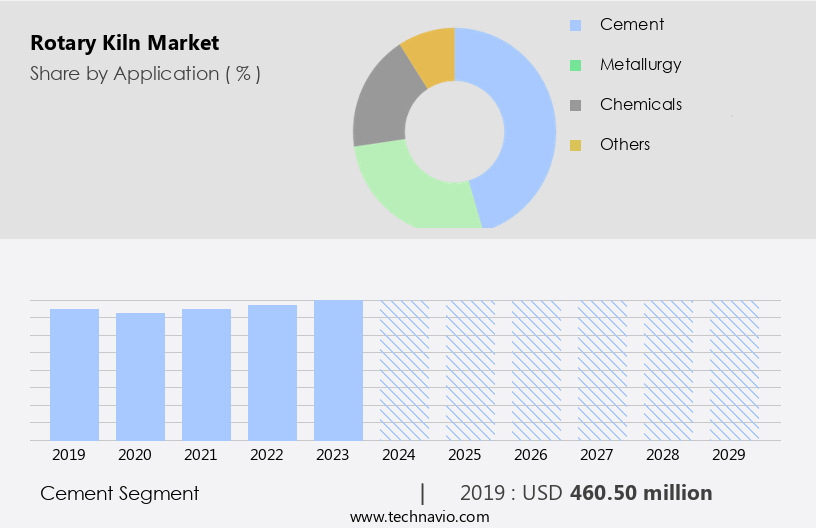
The Cement segment was valued at USD 460.50 million in 2019 and showed a gradual increase during the forecast period.
Regional Analysis
APAC is estimated to contribute 50% to the growth of the global market during the forecast period. Technavio's analysts have elaborately explained the regional trends and drivers that shape the market during the forecast period.

The market in APAC encompasses cement kilns and kilns utilized In the lime industry, primarily serving the construction sector. China, a major producer and exporter of lime in the region, is witnessing an increase in demand for ferrous and non-ferrous metals such as steel, aluminum, and copper. The applications of lime in metal production, particularly in the production of ferrous and non-ferrous metals, are driving the growth of the lime market in APAC. Moreover, the adoption of green technology and process optimization techniques in the cement industry is a key trend. These technologies aim to improve thermal and fuel efficiencies, reduce carbon emissions, and enhance product quality.
Process control systems, emissions control, and energy management are crucial components of these technologies. Environmental regulations are also influencing the market, with a focus on reducing emissions and improving energy efficiency. Waste heat utilization and material handling are other areas of focus for process optimization. The mineral composition and particle size distribution of raw materials, as well as the design and maintenance of kiln linings and refractory materials, are essential factors in optimizing the performance of rotary kilns. Capital expenditures for new kiln designs and lifecycle assessments are significant considerations for cement producers. The cement industry's operating costs are influenced by factors such as energy consumption, process integration, and material characterization.
Heat transfer and kiln rotation are critical aspects of kiln design, and heat recovery is a key area for improving energy efficiency. The market in APAC is driven by the increasing demand for cement and lime, the growth of industries such as construction and metal production, and the adoption of green technology and process optimization techniques. The market is characterized by a focus on improving thermal and fuel efficiencies, reducing carbon emissions, and enhancing product quality. Environmental regulations and material handling are also significant factors influencing the market.
Market Dynamics
Our researchers analyzed the data with 2024 as the base year, along with the key drivers, trends, and challenges. A holistic analysis of drivers will help companies refine their marketing strategies to gain a competitive advantage.
What are the Rotary Kiln market drivers leading to the rise in the adoption of Industry?
- The expansion and installation of new steel manufacturing plants serve as the primary catalyst for market growth in this sector. The market is experiencing significant growth due to the increasing demand for cement and steel in the construction sector. To meet this demand, many cement and lime manufacturers are expanding their production capacity. For instance, China Baowu Steel Group announced plans for a new 10 million tonnes per annum greenfield steel plant in Zhanjiang, Guangdong, China, utilizing electric arc furnace (EAF) technology. Similarly, ArcelorMittal commissioned a new 2 million tonnes per annum steel plant in the same year. These expansions and installations of new steel manufacturing plants are anticipated to boost market growth.
- Other market drivers include thermal and fuel efficiency, raw material feed optimization, mineral composition analysis, advanced kiln lining materials, dust collection systems, and refractory materials. Additionally, particle size distribution and kiln speed are crucial factors influencing market trends. Manufacturers are focusing on improving these aspects to enhance production efficiency and reduce operational costs.
What are the Rotary Kiln market trends shaping the Industry?
- The use of alternative fuels is becoming increasingly popular and is a notable market trend. This shift towards renewable energy sources is a significant development in the energy sector. Cement kilns, a key component in the production of cement, traditionally rely on coal as their primary fuel source. However, the integration of alternative fuels, such as waste oil, solvents, non-recyclable plastics, pre-treated industrial and municipal wastes, textiles, paper residues, biomass, and unrecyclable tires, is increasingly prevalent in many countries. This shift towards alternative fuels not only reduces carbon dioxide emissions during cement production but also offers significant cost savings and improved energy management. The use of alternative fuels in cement kilns involves the exchange of waste for coal, proportionate to their calorific values. Energy consumption is optimized through kiln rotation and heat transfer, while product quality and temperature control are preserved.
- The chemical analysis of alternative fuels is crucial to ensure compatibility with the cement production process and minimize any potential negative impacts. Emissions control is a critical consideration in the use of alternative fuels, as proper management is essential to minimize any potential environmental concerns. Energy management is also a key focus, as the efficient use of alternative fuels can lead to substantial cost savings and improved sustainability. The adoption of alternative fuels in cement kilns represents a significant market trend, driven by the need for emissions control, energy management, and cost savings. The integration of these fuels requires a thorough understanding of their properties and compatibility with the cement production process, as well as careful consideration of emissions control and energy management strategies.
How does Rotary Kiln market face challenges during its growth?
- The implementation of stringent regulations on blast furnace usage poses a significant challenge to the expansion and growth of the industry. The market encompasses the production capacity and design of kilns used in various industries, most notably the cement and lime production sectors. These kilns rely on intense heat for their operation, making heat recovery a critical consideration for reducing operating costs and minimizing carbon emissions. As the cement industry faces increasing pressure to reduce its environmental footprint, there is a growing emphasis on process integration and material characterization to optimize kiln performance.
- A lifecycle assessment of rotary kilns reveals significant opportunities for carbon emission reduction through improved efficiency and the adoption of renewable energy sources. The implementation of stringent regulations and the rising cost of raw materials are key market drivers, necessitating continuous innovation in kiln design and technology.
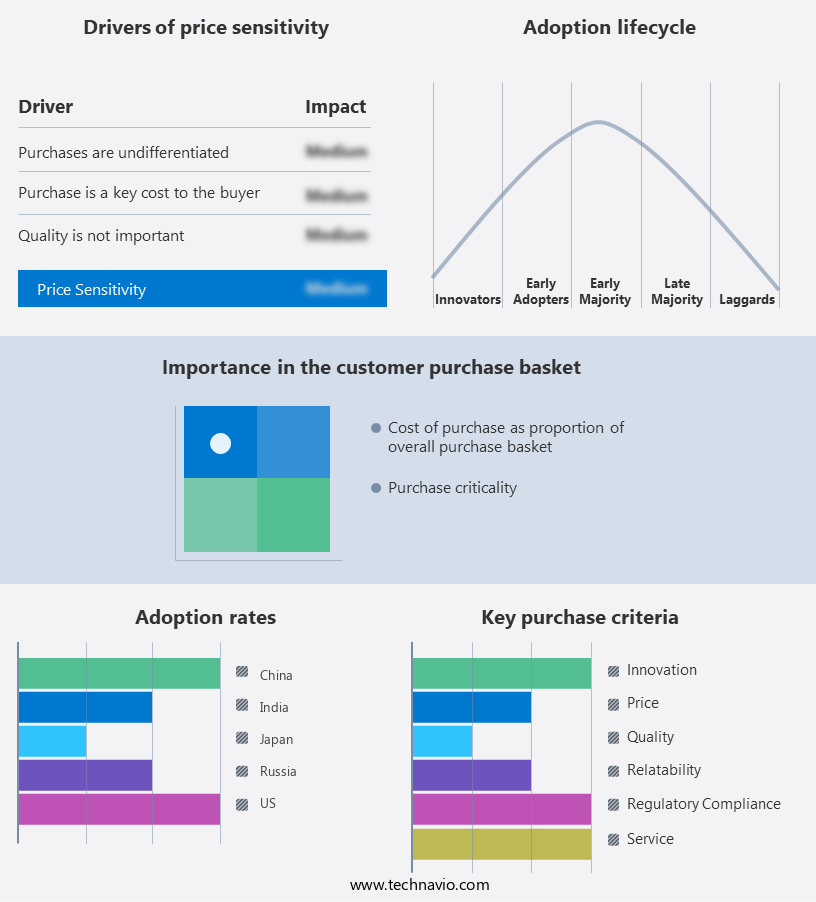
Exclusive Customer Landscape
The rotary kiln market forecasting report includes the adoption lifecycle of the market, covering from the innovator's stage to the laggard's stage. It focuses on adoption rates in different regions based on penetration. Furthermore, the rotary kiln market report also includes key purchase criteria and drivers of price sensitivity to help companies evaluate and develop their market growth analysis strategies.
Customer Landscape
Key Companies & Market Insights
Companies are implementing various strategies, such as strategic alliances, rotary kiln market forecast, partnerships, mergers and acquisitions, geographical expansion, and product/service launches, to enhance their presence in the industry.
Ansac Corp. - The company specializes in providing advanced rotary kiln solutions, including the Ansac HK Series Kiln. This indirect-fired, horizontal kiln is an optimal choice for pyrolysis, material drying, and carbon regeneration applications.
The industry research and growth report includes detailed analyses of the competitive landscape of the market and information about key companies, including:
- Ansac Corp.
- Boardman LLC
- Cimprogetti Srl
- CITIC HIC Gandara Censa S.A.U.
- FEECO International Inc.
- FLSmidth and Co. AS
- Harcliff Mining Services Pty Ltd.
- Harrop Industries Inc.
- Henan Hongxing Mining Machinery Co. Ltd.
- Henan Zhengzhou Mining Machinery Co. Ltd.
- Hitachi Zosen Inova AG
- Jiangsu Pengfei Group Co. Ltd.
- KHD Humboldt Wedag International AG
- Linyi Jinyong Kiln Co. Ltd.
- Maerz Ofenbau AG
- Metso Outotec Corp.
- Shanghai Minggong Heavy Equipment Co. Ltd.
- Shanghai Tongli Heavy Machinery Co. Ltd.
- Ube Corp.
Qualitative and quantitative analysis of companies has been conducted to help clients understand the wider business environment as well as the strengths and weaknesses of key industry players. Data is qualitatively analyzed to categorize companies as pure play, category-focused, industry-focused, and diversified; it is quantitatively analyzed to categorize companies as dominant, leading, strong, tentative, and weak.
Recent Development and News in Rotary Kiln Market
- In March 2024, L&T Construction, a leading engineering and construction conglomerate, announced the successful commissioning of a 5,000-tonne per day Rotary Kiln Cement Plant in Bangladesh. This strategic expansion marks their entry into the growing cement industry in the country (L&T Press Release, 2024).
- In August 2024, Schwenk Zement KG, a major European cement producer, and Cemex, a global building materials company, announced a strategic partnership to jointly develop and commercialize a new generation of Rotary Kilns with enhanced energy efficiency. The collaboration aims to reduce carbon emissions and improve the sustainability of cement production (Schwenk Zement Press Release, 2024).
Research Analyst Overview
The market continues to evolve, driven by the constant quest for improved emissions control, energy consumption, and process optimization in various sectors. The integration of green technology and advanced process control systems is a key trend, as environmental regulations become increasingly stringent. Kiln tilt and waste heat utilization are critical areas of focus, with the potential for significant energy savings. Material handling and raw material feed systems are being optimized to enhance thermal and fuel efficiency, while mineral composition analysis and kiln lining are essential for maintaining product quality and temperature control. Capital expenditures remain a significant consideration, with ongoing investments in chemical analysis, energy management, and heat transfer systems.
The cement industry, a major consumer of rotary kilns, is undergoing a lifecycle assessment to reduce carbon emissions and improve production capacity. Kiln design and lime production are also subjects of ongoing research, with a focus on increasing heat recovery and reducing operating costs. Process integration and material characterization are crucial for maximizing the efficiency of rotary kilns. Dust collection and refractory materials are essential components of emissions control, while particle size distribution and kiln speed are critical factors in ensuring consistent product quality. The ongoing evolution of the market reflects the dynamic nature of industrial processes and the continuous pursuit of innovation and efficiency.
Dive into Technavio's strong research methodology, blending expert interviews, extensive data synthesis, and validated models for unparalleled Rotary Kiln Market insights. See full methodology.
|
Market Scope |
|
|
Report Coverage |
Details |
|
Page number |
241 |
|
Base year |
2024 |
|
Historic period |
2019-2023 |
|
Forecast period |
2025-2029 |
|
Growth momentum & CAGR |
Accelerate at a CAGR of 3.3% |
|
Market growth 2025-2029 |
USD 179.2 million |
|
Market structure |
Fragmented |
|
YoY growth 2024-2025(%) |
3.2 |
|
Key countries |
China, US, India, Germany, Japan, Russia, Canada, South Korea, UK, and Indonesia |
|
Competitive landscape |
Leading Companies, Market Positioning of Companies, Competitive Strategies, and Industry Risks |
What are the Key Data Covered in this Rotary Kiln Market Research and Growth Report?
- CAGR of the Rotary Kiln industry during the forecast period
- Detailed information on factors that will drive the growth and forecasting between 2025 and 2029
- Precise estimation of the size of the market and its contribution of the industry in focus to the parent market
- Accurate predictions about upcoming growth and trends and changes in consumer behaviour
- Growth of the market across APAC, Europe, North America, Middle East and Africa, and South America
- Thorough analysis of the market's competitive landscape and detailed information about companies
- Comprehensive analysis of factors that will challenge the rotary kiln market growth of industry companies
We can help! Our analysts can customize this rotary kiln market research report to meet your requirements.
 RIA -
RIA - 
