Rpa And Hyperautomation Market Analysis North America, APAC, Europe, South America, Middle East and Africa - US, Canada, India, Japan, Australia, South Korea, China, UK, Germany, South Africa - Size and Forecast 2024-2028

Rpa And Hyperautomation Market Analysis North America, APAC, Europe, South America, Middle East and Africa - US, Canada, India, Japan, Australia, South Korea, China, UK, Germany, South Africa - Size and Forecast 2024-2028

Published: Jul 2024 165 Pages SKU: IRTNTR75002

Market Overview at a Glance

$31.64 B
Market Opportunity
27.77%
CAGR
22.76
YoY growth 2023-2024(%)

RPA and Hyperautomation Market Size 2024-2028

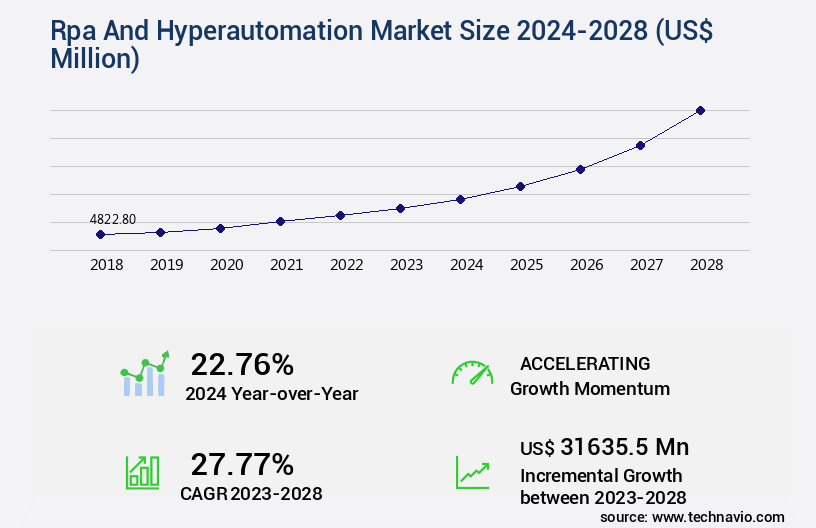
The RPA and hyperautomation market size is valued to increase USD 31.64 billion, at a CAGR of 27.77% from 2023 to 2028. Rise in need for automation within major industries will drive the RPA and hyperautomation market.

Major Market Trends & Insights

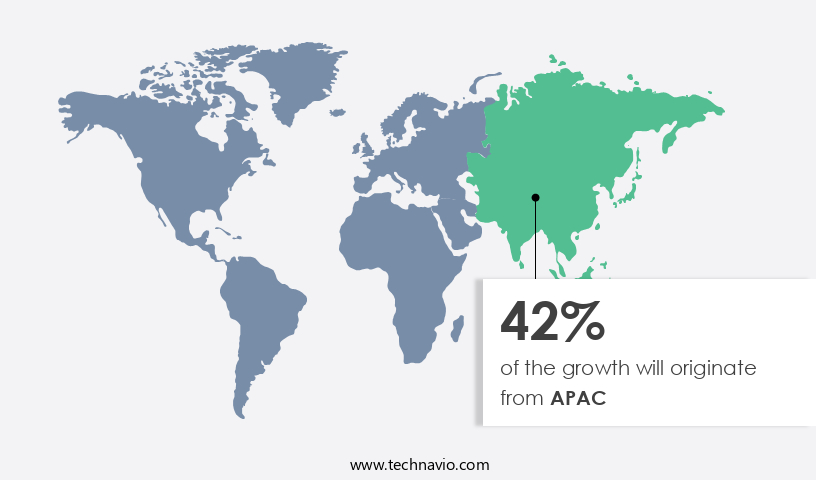
  • APAC dominated the market and accounted for a 42% growth during the forecast period.
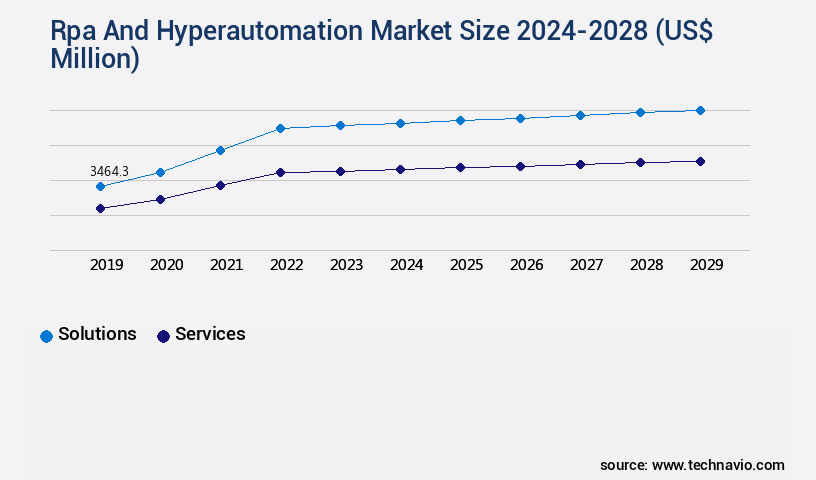
  • By Component - Solutions segment was valued at USD 2.91 billion in 2022
  • By Technology - RPA segment accounted for the largest market revenue share in 2022

Market Size & Forecast

  • Market Opportunities: USD 828.71 million
  • Market Future Opportunities: USD 31635.50 million
  • CAGR : 27.77%
  • APAC: Largest market in 2022

Market Summary

  • The market is experiencing significant growth and transformation, driven by the increasing need for automation within major industries. Core technologies such as machine learning, artificial intelligence, and natural language processing are fueling the evolution of RPA and hyperautomation solutions, enabling businesses to automate complex processes and enhance operational efficiency. Despite the numerous benefits, the market faces challenges such as the lack of awareness regarding RPA and hyperautomation solutions, as well as regulatory compliance issues.
  • However, the opportunities far outweigh the challenges, with industries such as healthcare, finance, and retail leading the way in RPA adoption. The ongoing technological advancements in automation are revolutionizing business processes, offering significant cost savings, improved accuracy, and increased productivity. As businesses continue to explore the potential of RPA and hyperautomation, the market is expected to remain dynamic and innovative, shaping the future of business operations.

What will be the Size of the RPA And Hyperautomation Market during the forecast period?

Rpa And Hyperautomation Market Size

Get Key Insights on Market Forecast (PDF) Request Free Sample

How is the RPA And Hyperautomation Market Segmented and what are the key trends of market segmentation?

The RPA and hyperautomation industry research report provides comprehensive data (region-wise segment analysis), with forecasts and estimates in "USD million" for the period 2024-2028, as well as historical data from 2018-2022 for the following segments.

  • Component
    • Solutions
    • Services
  • Technology
    • RPA
    • Business process management suites
    • Decision management systems
    • Integration platform as a service
  • Deployment
    • Cloud
    • On-premises
    • Cloud
    • On-premises
  • Organization Size
    • SMEs
    • Large Enterprises
    • SMEs
    • Large Enterprises
  • Verticals
    • BFSI
    • IT and Telecom
    • Retail and Consumer Goods
    • Healthcare and Life Sciences
    • Manufacturing
    • Transportation and Logistics
    • Others
  • Geography
    • North America
      • US
      • Canada
    • Europe
      • Germany
      • UK
    • Middle East and Africa
      • South Africa
    • APAC
      • Australia
      • China
      • India
      • Japan
      • South Korea
    • Rest of World (ROW)

By Component Insights

The solutions segment is estimated to witness significant growth during the forecast period.

The market trends indicate a significant growth trajectory, with solution implementations accounting for a substantial market share in 2023. These solutions leverage automation technologies, including AI, machine learning, and cognitive automation, to streamline business processes and enhance operational efficiency. The market's continuous evolution is marked by the increasing adoption of natural language processing, workflow orchestration, and error reduction capabilities. Hyperautomation platforms facilitate the integration of various automation tools, enabling seamless data flow between software robots, data integration, and API connections. Training programs and exception handling are essential components of RPA and hyperautomation, ensuring a digital workforce that adapts to evolving business requirements.

Compliance requirements and security protocols are also prioritized, with return on investment and audit trails being crucial factors in the decision-making process. Optical character recognition and intelligent automation are integral to the market's expansion, offering organizations the ability to automate complex tasks and processes. Integration platforms and digital workforces are increasingly being adopted to optimize business processes, with machine learning models and change management strategies playing a pivotal role in ensuring successful implementations. Future industry growth is anticipated to be robust, with organizations in various sectors, including finance, healthcare, and manufacturing, recognizing the potential benefits of RPA and hyperautomation.

Rpa And Hyperautomation Market Size

Request Free Sample

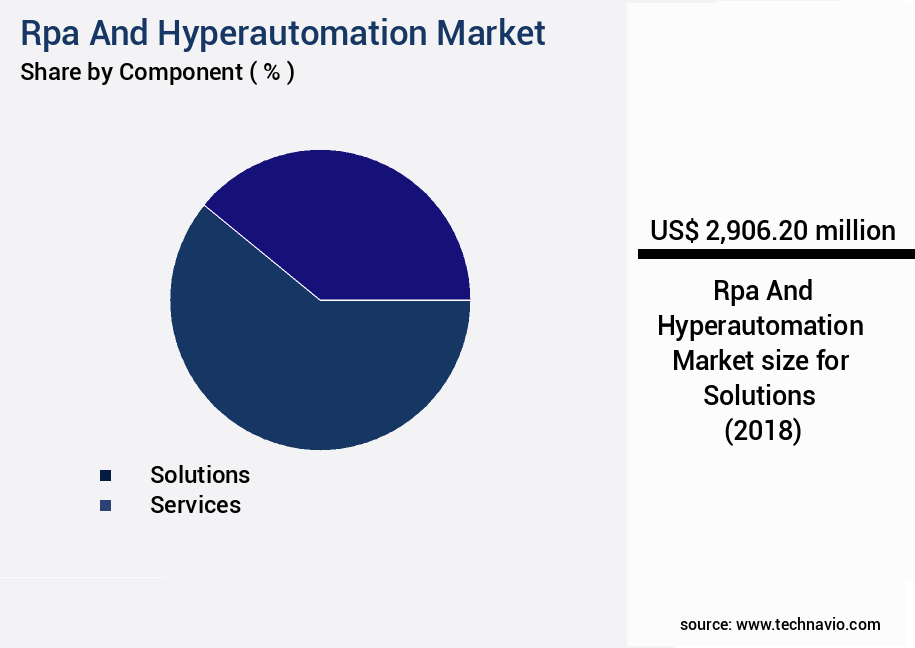
The Solutions segment was valued at USD 2.91 billion in 2018 and showed a gradual increase during the forecast period.

The market's ongoing development is expected to bring about cost savings automation, automation anywhere, and the continued refinement of process mining tools and business process management systems. Incorporating RPA and hyperautomation into business operations can lead to substantial time and cost savings, enabling organizations to focus on strategic initiatives and drive growth.

Rpa And Hyperautomation Market Size

Request Free Sample

Regional Analysis

APAC is estimated to contribute 42% to the growth of the global market during the forecast period.Technavio's analysts have elaborately explained the regional trends and drivers that shape the market during the forecast period.

Rpa And Hyperautomation Market Share by Geography

See How RPA And Hyperautomation Market Demand is Rising in APAC Request Free Sample

North America's rapid digital transformation fuels the market's growth. With businesses in the region among the first to adopt new technologies, they have generated vast amounts of data, necessitating efficient management solutions. RPA and hyperautomation offer significant benefits, including reduced labor requirements, substantial time and cost savings, and freed resources for strategic decision-making. As of now, North America accounts for a substantial market share due to these advantages.

The region's industry verticals, such as finance, healthcare, and manufacturing, are major contributors to this trend. This business process automation adoption not only enhances operational efficiency but also positions companies for future success.

Market Dynamics

Our researchers analyzed the data with 2023 as the base year, along with the key drivers, trends, and challenges. A holistic analysis of drivers will help companies refine their marketing strategies to gain a competitive advantage.

The market is witnessing significant growth as businesses worldwide seek to streamline operations and enhance productivity through AI-driven process automation. Hyperautomation, an extension of RPA, integrates advanced technologies like machine learning, artificial intelligence, and process mining to automate complex business processes. Implementing hyperautomation and RPA comes with challenges, including the need for robust change management strategies, human-in-the-loop workflows, and exception handling. Best practices include careful planning, prioritizing processes, and considering the total cost of ownership, including implementation, maintenance, and training costs. Intelligent automation ROI calculations are crucial for businesses to assess the financial benefits of these technologies.

Workflow orchestration software comparisons help organizations select the right solution for their needs, while process mining enables business process improvement by analyzing existing workflows and identifying inefficiencies. Data integration strategies for RPA are essential to ensure seamless communication between systems. Security considerations are paramount, with cloud-based RPA deployment models offering flexibility and scalability but requiring robust security measures. Low-code RPA platforms simplify implementation, enabling businesses to automate processes quickly and efficiently. Human-in-the-loop automation workflows strike a balance between automation and human intervention, ensuring accuracy and efficiency. According to market information, more than 60% of RPA projects involve the use of cloud-based platforms, reflecting the growing preference for flexibility and scalability.

This trend is expected to continue, with the cloud-based RPA market projected to expand at a rapid pace. Successfully implementing RPA and hyperautomation requires careful planning, selecting the right company, and developing a comprehensive strategy. Compliance requirements are also essential considerations, with regulations like GDPR and HIPAA driving the need for robust data security and privacy measures. Future trends in intelligent automation include the integration of RPA with other technologies like artificial intelligence, machine learning, and natural language processing, enabling more sophisticated automation capabilities. This integration is expected to drive significant growth in the market.

Rpa And Hyperautomation Market Size

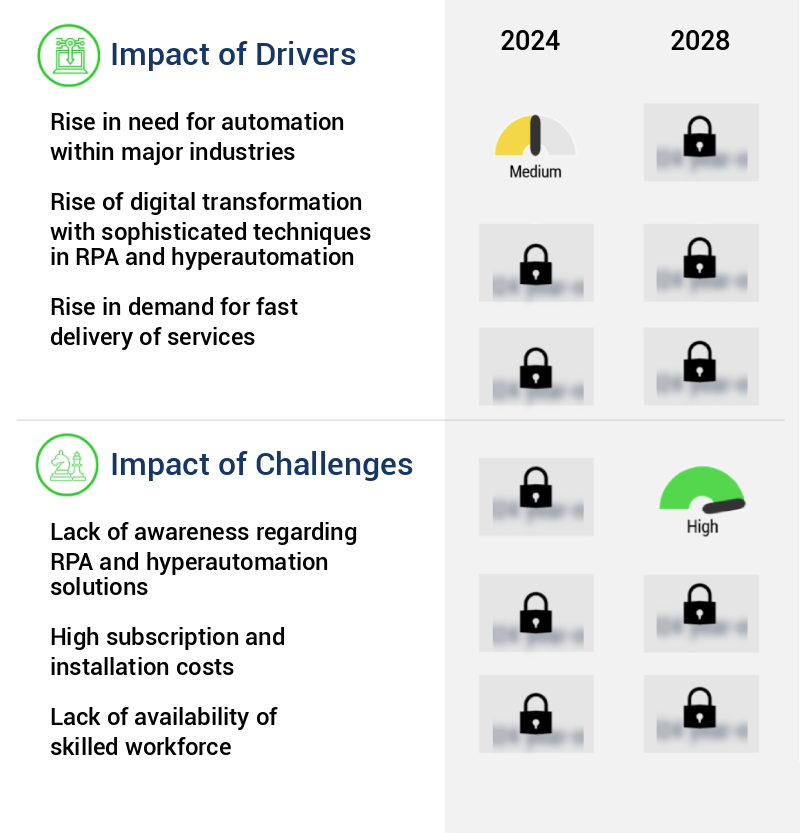
What are the key market drivers leading to the rise in the adoption of RPA And Hyperautomation Industry?

  • The increasing demand for automation in major industries serves as the primary market driver. 
  • Hyperautomation, a subset of Robotic Process Automation (RPA), is revolutionizing industries by automating repetitive tasks and ensuring compliance with safety regulations. This technology is particularly valuable in construction, where it enables businesses to identify safety violations before accidents occur and maintain precise adherence to pedestrian walking lanes. By providing real-time data on job-site behavior, hyperautomation empowers decision-makers to make data-driven modifications, rather than relying on speculation. The increasing demand for automation across major industries is a significant factor fueling the growth of the market.
  • Companies in various sectors are recognizing the benefits of hyperautomation, including enhanced productivity, improved accuracy, and reduced operational costs. As technology continues to evolve, the opportunities for hyperautomation are expected to expand further, making it an essential tool for businesses seeking to streamline their operations and maintain a competitive edge.

What are the market trends shaping the RPA And Hyperautomation Industry?

  • Technological advancements are increasingly becoming the market trend. This trend is driven by continuous growth in technology.
  • The markets have witnessed significant advancements in automation processes, with major organizations focusing on developing innovative technology solutions. For instance, Appian, a US-based enterprise software and cloud computing provider, introduced an updated version of its low-code automation platform in December 2020. This new iteration integrates process automation, low-code Robotic Process Automation (RPA), and Artificial Intelligence (AI). The latest generation of scalable and integrated enterprise automation technologies offers businesses the potential for swift and substantial improvements. By adopting these solutions, IT departments can streamline operations, enhance productivity, and reduce costs. According to recent studies, the global RPA market is projected to grow at a steady pace, with the hyperautomation segment experiencing significant traction.
  • This trend is driven by the increasing demand for automation in various industries, including finance, healthcare, and manufacturing. The integration of AI and RPA is particularly noteworthy, as it enables organizations to automate complex processes and make data-driven decisions. The ongoing technological advancements in the markets continue to reshape the business landscape, offering numerous opportunities for growth and innovation.

What challenges does the RPA And Hyperautomation Industry face during its growth?

  • The absence of awareness about Robotic Process Automation (RPA) and hyperautomation solutions poses a significant challenge to industry growth. Organizations that fail to recognize the benefits of these technologies may miss opportunities for increased efficiency, cost savings, and competitive advantage. 
  • In the dynamic business landscape, industrial sectors worldwide are embracing the shift from manual workforces to virtual workforces through Robotic Process Automation (RPA) and hyperautomation. RPA software standardizes business processes, while hyperautomation extends RPA's capabilities with AI and machine learning. This transition is not limited to large corporations but also impacts small and medium enterprises with larger workforces. However, awareness of RPA and hyperautomation software remains low in regions like APAC, where the abundance of low-cost labor might initially seem a substitute.
  • Yet, the advantages of RPA and hyperautomation, such as increased efficiency, reduced errors, and improved compliance, are compelling. As industries continue to explore these technologies, the evolving patterns in business process management will further unfold, offering significant potential for growth and innovation.

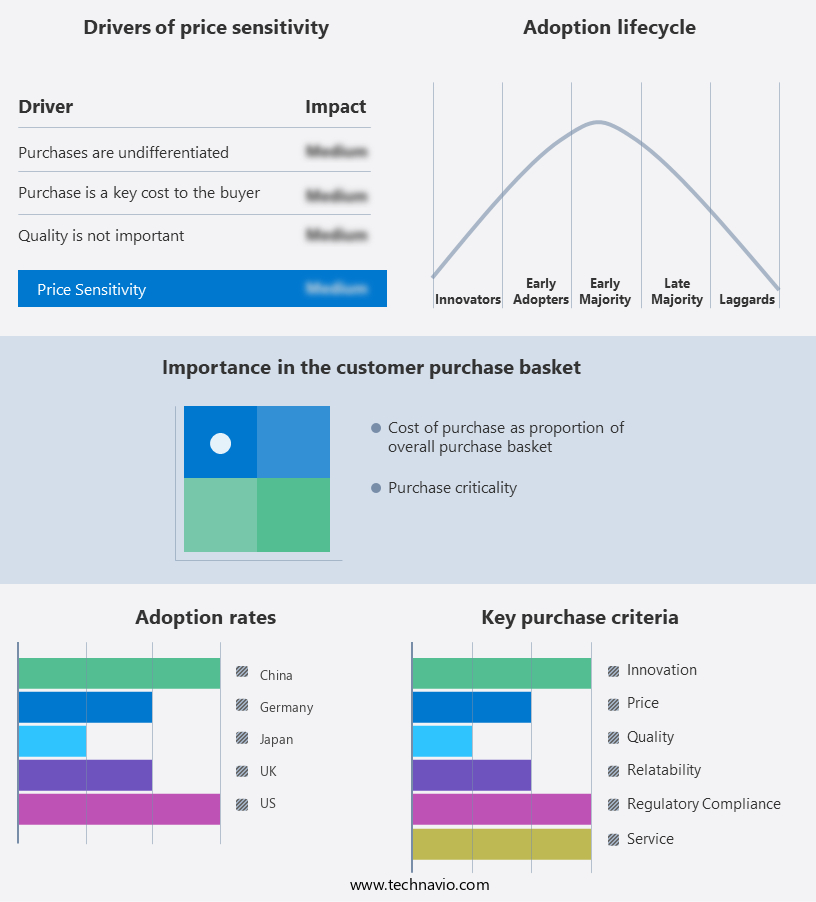
Exclusive Customer Landscape

The RPA and hyperautomation market forecasting report includes the adoption lifecycle of the market, covering from the innovator's stage to the laggard's stage. It focuses on adoption rates in different regions based on penetration. Furthermore, the RPA and hyperautomation market report also includes key purchase criteria and drivers of price sensitivity to help companies evaluate and develop their market growth analysis strategies.

Rpa And Hyperautomation Market Share by Geography

 Customer Landscape of RPA And Hyperautomation Industry

Competitive Landscape & Market Insights

Companies are implementing various strategies, such as strategic alliances, RPA and hyperautomation market forecast, partnerships, mergers and acquisitions, geographical expansion, and product/service launches, to enhance their presence in the industry.

Akabot - The Alteryx automation platform is a leading solution in the Robotic Process Automation (RPA) hyperautomation market.

The industry research and growth report includes detailed analyses of the competitive landscape of the market and information about key companies, including:

  • Akabot
  • Alteryx Inc.
  • Appian Corp.
  • Automation Anywhere Inc.
  • Celonis SE
  • Compulink Management Center Inc.
  • Datamatics Global Services Limited
  • Fortra LLC
  • International Business Machines Corp.
  • Juniper Networks Inc.
  • Microsoft Corp.
  • NICE Ltd.
  • PagerDuty Inc.
  • Pegasystems Inc.
  • ProcessMaker Inc.
  • SAP SE
  • SolveXia Pty Ltd.
  • SS and C Technologies Holdings Inc.
  • UiPath Inc.
  • Zendesk Inc.

Qualitative and quantitative analysis of companies has been conducted to help clients understand the wider business environment as well as the strengths and weaknesses of key industry players. Data is qualitatively analyzed to categorize companies as pure play, category-focused, industry-focused, and diversified; it is quantitatively analyzed to categorize companies as dominant, leading, strong, tentative, and weak.

Recent Development and News in RPA And Hyperautomation Market

  • In January 2024, UiPath, a leading Robotic Process Automation (RPA) and Hyperautomation provider, announced the launch of its new AI Center of Excellence (CoE) in Singapore. This strategic move aimed to expand its presence in the Asia Pacific region and cater to the growing demand for automation solutions in the area (UiPath Press Release).
  • In March 2024, Blue Prism, another major player in the RPA market, entered into a partnership with Microsoft to integrate Blue Prism's digital workforce solutions with Microsoft's Power Automate platform. This collaboration aimed to offer more comprehensive automation capabilities to joint customers (Microsoft News Center).
  • In April 2025, Automation Anywhere, a global leader in RPA, raised USD 550 million in a Series E funding round. This significant investment will be used to accelerate product innovation, expand market reach, and enhance the company's customer support capabilities (Automation Anywhere Press Release).
  • In May 2025, the European Union's General Data Protection Regulation (GDPR) issued new guidelines on the use of RPA and AI in data processing. The guidelines emphasized the need for increased transparency, accountability, and data security in automation solutions (European Data Protection Board). These developments underscore the growing importance and evolution of the market.

Dive into Technavio's robust research methodology, blending expert interviews, extensive data synthesis, and validated models for unparalleled RPA And Hyperautomation Market insights. See full methodology.

Market Scope

Report Coverage

Details

Page number

165

Base year

2023

Historic period

2018-2022

Forecast period

2024-2028

Growth momentum & CAGR

Accelerate at a CAGR of 27.77%

Market growth 2024-2028

USD 31635.5 million

Market structure

Fragmented

YoY growth 2023-2024(%)

22.76

Key countries

US, Canada, India, Japan, Australia, South Korea, China, UK, Germany, South Africa, and Saudi Arabia

Competitive landscape

Leading Companies, Market Positioning of Companies, Competitive Strategies, and Industry Risks

Request Free Sample

Research Analyst Overview

  • In the ever-evolving business landscape, Robotic Process Automation (RPA) and Hyperautomation have emerged as game-changers, revolutionizing process discovery and optimization. These technologies, fueled by Natural Language Processing and AI-powered automation, have transformed the way organizations manage and streamline their operations. Hyperautomation platforms, which build upon RPA, employ task mining and workflow orchestration to identify and automate repetitive tasks. Deployment strategies for these technologies have become increasingly scalable, enabling businesses to automate processes across various departments and industries. The integration of software robots and data integration, facilitated by API connections, has significantly improved automation efficiency.
  • Training programs have been instrumental in enabling a seamless transition to these advanced technologies. Exception handling and compliance requirements are met with ease, ensuring a digital workforce that adheres to industry standards. Error reduction rates have soared, as these intelligent automation solutions have taken over mundane, error-prone tasks. Hyperautomation platforms have also shown remarkable progress in areas like cost savings automation, audit trails, and optical character recognition. Moreover, machine learning models and integration platforms have expanded the capabilities of these technologies, enabling businesses to build a digital workforce that can learn and adapt to changing business requirements.
  • Blue Prism and other leading RPA companies continue to innovate, offering change management features and robust security protocols. Process mining tools and Business Process Management systems have further enhanced the value of RPA and Hyperautomation, providing valuable insights into business processes and enabling continuous process improvement. The future of these technologies lies in their ability to adapt and evolve, driving business growth and success.

What are the Key Data Covered in this RPA And Hyperautomation Market Research and Growth Report?

  • What is the expected growth of the RPA And Hyperautomation Market between 2024 and 2028?

    • USD 31.64 billion, at a CAGR of 27.77%

  • What segmentation does the market report cover?

    • The report segmented by Component (Solutions and Services), Technology (RPA, Business process management suites, Decision management systems, and Integration platform as a service), Geography (North America, APAC, Europe, South America, and Middle East and Africa), Deployment (Cloud, On-premises, Cloud, and On-premises), Organization Size (SMEs, Large Enterprises, SMEs, and Large Enterprises), and Verticals (BFSI, IT and Telecom, Retail and Consumer Goods, Healthcare and Life Sciences, Manufacturing, Transportation and Logistics, Others, BFSI, IT and Telecom, Retail and Consumer Goods, Healthcare and Life Sciences, Manufacturing, Transportation and Logistics, and Others)

  • Which regions are analyzed in the report?

    • North America, APAC, Europe, South America, and Middle East and Africa

  • What are the key growth drivers and market challenges?

    • Rise in need for automation within major industries, Lack of awareness regarding RPA and hyperautomation solutions

  • Who are the major players in the RPA And Hyperautomation Market?

    • Key Companies Akabot, Alteryx Inc., Appian Corp., Automation Anywhere Inc., Celonis SE, Compulink Management Center Inc., Datamatics Global Services Limited, Fortra LLC, International Business Machines Corp., Juniper Networks Inc., Microsoft Corp., NICE Ltd., PagerDuty Inc., Pegasystems Inc., ProcessMaker Inc., SAP SE, SolveXia Pty Ltd., SS and C Technologies Holdings Inc., UiPath Inc., and Zendesk Inc.

Market Research Insights

  • The market continues to gain traction as businesses seek to enhance operational efficiency and productivity. Key performance indicators (KPIs) such as error reduction, process cycle time, and employee productivity are significant drivers of RPA and hyperautomation adoption.
  • Cloud-based automation, security automation, and intelligent document processing are among the most popular use cases. Performance dashboards, service level agreements, and predictive analytics enable businesses to monitor and optimize their automation initiatives. Process standardization, risk management, and process automation tools are essential components of a successful RPA and hyperautomation strategy. No-code platforms and low-code platforms empower citizen developers to create automation workflows, while virtual assistants streamline repetitive tasks. RPA implementation requires careful project management, data analytics, decision automation, data governance, process governance, capacity planning, and resource allocation. Hybrid automation, which combines on-premise and cloud-based solutions, offers flexibility and scalability for businesses.
  • Adopting a well-planned hyperautomation strategy can lead to significant cost savings, improved compliance, and increased customer satisfaction.

We can help! Our analysts can customize this RPA and hyperautomation market research report to meet your requirements.

Get in touch

1 Executive Summary

  • 1.1 Market overview
    • Executive Summary - Chart on Market Overview
    • Executive Summary - Data Table on Market Overview
    • Executive Summary - Chart on Global Market Characteristics
    • Executive Summary - Chart on Market by Geography
    • Executive Summary - Chart on Market Segmentation by Component
    • Executive Summary - Chart on Market Segmentation by Technology
    • Executive Summary - Chart on Incremental Growth
    • Executive Summary - Data Table on Incremental Growth
    • Executive Summary - Chart on Company Market Positioning

2 Market Landscape

  • 2.1 Market ecosystem
    • Parent Market
    • Data Table on - Parent Market
  • 2.2 Market characteristics
    • Market characteristics analysis
  • 2.3 Value chain analysis
    • Value Chain Analysis

3 Market Sizing

  • 3.1 Market definition
    • Offerings of companies included in the market definition
  • 3.2 Market segment analysis
    • Market segments
  • 3.3 Market size 2023
    • 3.4 Market outlook: Forecast for 2023-2028
      • Chart on Global - Market size and forecast 2023-2028 ($ million)
      • Data Table on Global - Market size and forecast 2023-2028 ($ million)
      • Chart on Global Market: Year-over-year growth 2023-2028 (%)
      • Data Table on Global Market: Year-over-year growth 2023-2028 (%)

    4 Historic Market Size

    • 4.1 Global RPA And Hyperautomation Market 2018 - 2022
      • Historic Market Size - Data Table on Global RPA And Hyperautomation Market 2018 - 2022 ($ million)
    • 4.2 Component segment analysis 2018 - 2022
      • Historic Market Size - Component Segment 2018 - 2022 ($ million)
    • 4.3 Technology segment analysis 2018 - 2022
      • Historic Market Size - Technology Segment 2018 - 2022 ($ million)
    • 4.4 Geography segment analysis 2018 - 2022
      • Historic Market Size - Geography Segment 2018 - 2022 ($ million)
    • 4.5 Country segment analysis 2018 - 2022
      • Historic Market Size - Country Segment 2018 - 2022 ($ million)

    5 Five Forces Analysis

    • 5.1 Five forces summary
      • Five forces analysis - Comparison between 2023 and 2028
    • 5.2 Bargaining power of buyers
      • Bargaining power of buyers - Impact of key factors 2023 and 2028
    • 5.3 Bargaining power of suppliers
      • Bargaining power of suppliers - Impact of key factors in 2023 and 2028
    • 5.4 Threat of new entrants
      • Threat of new entrants - Impact of key factors in 2023 and 2028
    • 5.5 Threat of substitutes
      • Threat of substitutes - Impact of key factors in 2023 and 2028
    • 5.6 Threat of rivalry
      • Threat of rivalry - Impact of key factors in 2023 and 2028
    • 5.7 Market condition
      • Chart on Market condition - Five forces 2023 and 2028

    6 Market Segmentation by Component

    • 6.1 Market segments
      • Chart on Component - Market share 2023-2028 (%)
      • Data Table on Component - Market share 2023-2028 (%)
    • 6.2 Comparison by Component
      • Chart on Comparison by Component
      • Data Table on Comparison by Component
    • 6.3 Solutions - Market size and forecast 2023-2028
      • Chart on Solutions - Market size and forecast 2023-2028 ($ million)
      • Data Table on Solutions - Market size and forecast 2023-2028 ($ million)
      • Chart on Solutions - Year-over-year growth 2023-2028 (%)
      • Data Table on Solutions - Year-over-year growth 2023-2028 (%)
    • 6.4 Services - Market size and forecast 2023-2028
      • Chart on Services - Market size and forecast 2023-2028 ($ million)
      • Data Table on Services - Market size and forecast 2023-2028 ($ million)
      • Chart on Services - Year-over-year growth 2023-2028 (%)
      • Data Table on Services - Year-over-year growth 2023-2028 (%)
    • 6.5 Market opportunity by Component
      • Market opportunity by Component ($ million)
      • Data Table on Market opportunity by Component ($ million)

    7 Market Segmentation by Technology

    • 7.1 Market segments
      • Chart on Technology - Market share 2023-2028 (%)
      • Data Table on Technology - Market share 2023-2028 (%)
    • 7.2 Comparison by Technology
      • Chart on Comparison by Technology
      • Data Table on Comparison by Technology
    • 7.3 RPA - Market size and forecast 2023-2028
      • Chart on RPA - Market size and forecast 2023-2028 ($ million)
      • Data Table on RPA - Market size and forecast 2023-2028 ($ million)
      • Chart on RPA - Year-over-year growth 2023-2028 (%)
      • Data Table on RPA - Year-over-year growth 2023-2028 (%)
    • 7.4 Business process management suites - Market size and forecast 2023-2028
      • Chart on Business process management suites - Market size and forecast 2023-2028 ($ million)
      • Data Table on Business process management suites - Market size and forecast 2023-2028 ($ million)
      • Chart on Business process management suites - Year-over-year growth 2023-2028 (%)
      • Data Table on Business process management suites - Year-over-year growth 2023-2028 (%)
    • 7.5 Decision management systems - Market size and forecast 2023-2028
      • Chart on Decision management systems - Market size and forecast 2023-2028 ($ million)
      • Data Table on Decision management systems - Market size and forecast 2023-2028 ($ million)
      • Chart on Decision management systems - Year-over-year growth 2023-2028 (%)
      • Data Table on Decision management systems - Year-over-year growth 2023-2028 (%)
    • 7.6 Integration platform as a service - Market size and forecast 2023-2028
      • Chart on Integration platform as a service - Market size and forecast 2023-2028 ($ million)
      • Data Table on Integration platform as a service - Market size and forecast 2023-2028 ($ million)
      • Chart on Integration platform as a service - Year-over-year growth 2023-2028 (%)
      • Data Table on Integration platform as a service - Year-over-year growth 2023-2028 (%)
    • 7.7 Market opportunity by Technology
      • Market opportunity by Technology ($ million)
      • Data Table on Market opportunity by Technology ($ million)

    8 Market Segmentation by Deployment

    • 8.1 Market segments
      • Chart on Deployment - Market share (2023-2028) (%)
      • Data Table on Deployment - Market share (2023-2028) (%)
    • 8.2 Comparison by Deployment
      • Chart on Comparison by Deployment
      • Data Table on Comparison by Deployment
    • 8.3 Cloud - Market size and forecast (2023-2028)
      • Chart on Cloud - Market size and forecast (2023-2028) ($ million)
      • Data Table on Cloud - Market size and forecast (2023-2028) ($ million)
      • Chart on Cloud - Year-over-year growth (2023-2028) (%)
      • Data Table on Cloud - Year-over-year growth (2023-2028) (%)
    • 8.4 On-premises - Market size and forecast (2023-2028)
      • Chart on On-premises - Market size and forecast (2023-2028) ($ million)
      • Data Table on On-premises - Market size and forecast (2023-2028) ($ million)
      • Chart on On-premises - Year-over-year growth (2023-2028) (%)
      • Data Table on On-premises - Year-over-year growth (2023-2028) (%)
    • 8.5 Market opportunity by Deployment
      • Market opportunity by $segment_name ($ million)
      • Data Table on Market opportunity by $segment_name ($ million)

    9 Market Segmentation by Organization Size

    • 9.1 Market segments
      • Chart on Organization Size - Market share (2023-2028) (%)
      • Data Table on Organization Size - Market share (2023-2028) (%)
    • 9.2 Comparison by Organization Size
      • Chart on Comparison by Organization Size
      • Data Table on Comparison by Organization Size
    • 9.3 SMEs - Market size and forecast (2023-2028)
      • Chart on SMEs - Market size and forecast (2023-2028) ($ million)
      • Data Table on SMEs - Market size and forecast (2023-2028) ($ million)
      • Chart on SMEs - Year-over-year growth (2023-2028) (%)
      • Data Table on SMEs - Year-over-year growth (2023-2028) (%)
    • 9.4 Large Enterprises - Market size and forecast (2023-2028)
      • Chart on Large Enterprises - Market size and forecast (2023-2028) ($ million)
      • Data Table on Large Enterprises - Market size and forecast (2023-2028) ($ million)
      • Chart on Large Enterprises - Year-over-year growth (2023-2028) (%)
      • Data Table on Large Enterprises - Year-over-year growth (2023-2028) (%)
    • 9.5 Market opportunity by Organization Size
      • Market opportunity by $segment_name ($ million)
      • Data Table on Market opportunity by $segment_name ($ million)

    10 Market Segmentation by Verticals

    • 10.1 Market segments
      • Chart on Verticals - Market share (2023-2028) (%)
      • Data Table on Verticals - Market share (2023-2028) (%)
      • Market opportunity by $segment_name ($ million)
      • Data Table on Market opportunity by $segment_name ($ million)
    • 10.2 Comparison by Verticals
      • Chart on Comparison by Verticals
      • Data Table on Comparison by Verticals
    • 10.3 BFSI - Market size and forecast (2023-2028)
      • Chart on BFSI - Market size and forecast (2023-2028) ($ million)
      • Data Table on BFSI - Market size and forecast (2023-2028) ($ million)
      • Chart on BFSI - Year-over-year growth (2023-2028) (%)
      • Data Table on BFSI - Year-over-year growth (2023-2028) (%)
    • 10.4 IT and Telecom - Market size and forecast (2023-2028)
      • Chart on IT and Telecom - Market size and forecast (2023-2028) ($ million)
      • Data Table on IT and Telecom - Market size and forecast (2023-2028) ($ million)
      • Chart on IT and Telecom - Year-over-year growth (2023-2028) (%)
      • Data Table on IT and Telecom - Year-over-year growth (2023-2028) (%)
    • 10.5 Retail and Consumer Goods - Market size and forecast (2023-2028)
      • Chart on Retail and Consumer Goods - Market size and forecast (2023-2028) ($ million)
      • Data Table on Retail and Consumer Goods - Market size and forecast (2023-2028) ($ million)
      • Chart on Retail and Consumer Goods - Year-over-year growth (2023-2028) (%)
      • Data Table on Retail and Consumer Goods - Year-over-year growth (2023-2028) (%)
    • 10.6 Healthcare and Life Sciences - Market size and forecast (2023-2028)
      • Chart on Healthcare and Life Sciences - Market size and forecast (2023-2028) ($ million)
      • Data Table on Healthcare and Life Sciences - Market size and forecast (2023-2028) ($ million)
      • Chart on Healthcare and Life Sciences - Year-over-year growth (2023-2028) (%)
      • Data Table on Healthcare and Life Sciences - Year-over-year growth (2023-2028) (%)
    • 10.7 Manufacturing - Market size and forecast (2023-2028)
      • Chart on Manufacturing - Market size and forecast (2023-2028) ($ million)
      • Data Table on Manufacturing - Market size and forecast (2023-2028) ($ million)
      • Chart on Manufacturing - Year-over-year growth (2023-2028) (%)
      • Data Table on Manufacturing - Year-over-year growth (2023-2028) (%)
    • 10.8 Transportation and Logistics - Market size and forecast (2023-2028)
      • Chart on Transportation and Logistics - Market size and forecast (2023-2028) ($ million)
      • Data Table on Transportation and Logistics - Market size and forecast (2023-2028) ($ million)
      • Chart on Transportation and Logistics - Year-over-year growth (2023-2028) (%)
      • Data Table on Transportation and Logistics - Year-over-year growth (2023-2028) (%)
    • 10.9 Others - Market size and forecast (2023-2028)
      • Chart on Others - Market size and forecast (2023-2028) ($ million)
      • Data Table on Others - Market size and forecast (2023-2028) ($ million)
      • Chart on Others - Year-over-year growth (2023-2028) (%)
      • Data Table on Others - Year-over-year growth (2023-2028) (%)

    11 Customer Landscape

    • 11.1 Customer landscape overview
      • Analysis of price sensitivity, lifecycle, customer purchase basket, adoption rates, and purchase criteria

    12 Geographic Landscape

    • 12.1 Geographic segmentation
      • Chart on Market share by geography 2023-2028 (%)
      • Data Table on Market share by geography 2023-2028 (%)
    • 12.2 China - Market size and forecast (2023-2028)
      • Chart on China - Market size and forecast (2023-2028) ($ million)
      • Data Table on China - Market size and forecast (2023-2028) ($ million)
      • Chart on China - Year-over-year growth (2023-2028) (%)
      • Data Table on China - Year-over-year growth (2023-2028) (%)
      • Chart on Geographic comparison
      • Data Table on Geographic comparison
    • 12.3 UK - Market size and forecast (2023-2028)
      • Chart on UK - Market size and forecast (2023-2028) ($ million)
      • Data Table on UK - Market size and forecast (2023-2028) ($ million)
      • Chart on UK - Year-over-year growth (2023-2028) (%)
      • Data Table on UK - Year-over-year growth (2023-2028) (%)
      • Chart on North America - Market size and forecast 2023-2028 ($ million)
      • Data Table on North America - Market size and forecast 2023-2028 ($ million)
      • Chart on North America - Year-over-year growth 2023-2028 (%)
      • Data Table on North America - Year-over-year growth 2023-2028 (%)
    • 12.4 Germany - Market size and forecast (2023-2028)
      • Chart on Germany - Market size and forecast (2023-2028) ($ million)
      • Data Table on Germany - Market size and forecast (2023-2028) ($ million)
      • Chart on Germany - Year-over-year growth (2023-2028) (%)
      • Data Table on Germany - Year-over-year growth (2023-2028) (%)
      • Chart on APAC - Market size and forecast 2023-2028 ($ million)
      • Data Table on APAC - Market size and forecast 2023-2028 ($ million)
      • Chart on APAC - Year-over-year growth 2023-2028 (%)
      • Data Table on APAC - Year-over-year growth 2023-2028 (%)
    • 12.5 South Africa - Market size and forecast (2023-2028)
      • Chart on South Africa - Market size and forecast (2023-2028) ($ million)
      • Data Table on South Africa - Market size and forecast (2023-2028) ($ million)
      • Chart on South Africa - Year-over-year growth (2023-2028) (%)
      • Data Table on South Africa - Year-over-year growth (2023-2028) (%)
      • Chart on Europe - Market size and forecast 2023-2028 ($ million)
      • Data Table on Europe - Market size and forecast 2023-2028 ($ million)
      • Chart on Europe - Year-over-year growth 2023-2028 (%)
      • Data Table on Europe - Year-over-year growth 2023-2028 (%)
    • 12.6 South America - Market size and forecast 2023-2028
      • Chart on South America - Market size and forecast 2023-2028 ($ million)
      • Data Table on South America - Market size and forecast 2023-2028 ($ million)
      • Chart on South America - Year-over-year growth 2023-2028 (%)
      • Data Table on South America - Year-over-year growth 2023-2028 (%)
    • 12.7 Middle East and Africa - Market size and forecast 2023-2028
      • Chart on Middle East and Africa - Market size and forecast 2023-2028 ($ million)
      • Data Table on Middle East and Africa - Market size and forecast 2023-2028 ($ million)
      • Chart on Middle East and Africa - Year-over-year growth 2023-2028 (%)
      • Data Table on Middle East and Africa - Year-over-year growth 2023-2028 (%)
    • 12.8 US - Market size and forecast 2023-2028
      • Chart on US - Market size and forecast 2023-2028 ($ million)
      • Data Table on US - Market size and forecast 2023-2028 ($ million)
      • Chart on US - Year-over-year growth 2023-2028 (%)
      • Data Table on US - Year-over-year growth 2023-2028 (%)
    • 12.9 China - Market size and forecast 2023-2028
      • Chart on China - Market size and forecast 2023-2028 ($ million)
      • Data Table on China - Market size and forecast 2023-2028 ($ million)
      • Chart on China - Year-over-year growth 2023-2028 (%)
      • Data Table on China - Year-over-year growth 2023-2028 (%)
    • 12.10 Germany - Market size and forecast 2023-2028
      • Chart on Germany - Market size and forecast 2023-2028 ($ million)
      • Data Table on Germany - Market size and forecast 2023-2028 ($ million)
      • Chart on Germany - Year-over-year growth 2023-2028 (%)
      • Data Table on Germany - Year-over-year growth 2023-2028 (%)
    • 12.11 Japan - Market size and forecast 2023-2028
      • Chart on Japan - Market size and forecast 2023-2028 ($ million)
      • Data Table on Japan - Market size and forecast 2023-2028 ($ million)
      • Chart on Japan - Year-over-year growth 2023-2028 (%)
      • Data Table on Japan - Year-over-year growth 2023-2028 (%)
    • 12.12 UK - Market size and forecast 2023-2028
      • Chart on UK - Market size and forecast 2023-2028 ($ million)
      • Data Table on UK - Market size and forecast 2023-2028 ($ million)
      • Chart on UK - Year-over-year growth 2023-2028 (%)
      • Data Table on UK - Year-over-year growth 2023-2028 (%)
    • 12.13 Market opportunity by geography
      • Market opportunity by geography ($ million)
      • Data Tables on Market opportunity by geography ($ million)
    • 12.14 US - Market size and forecast (2023-2028)
      • Chart on US - Market size and forecast (2023-2028) ($ million)
      • Data Table on US - Market size and forecast (2023-2028) ($ million)
      • Chart on US - Year-over-year growth (2023-2028) (%)
      • Data Table on US - Year-over-year growth (2023-2028) (%)
    • 12.15 Canada - Market size and forecast (2023-2028)
      • Chart on Canada - Market size and forecast (2023-2028) ($ million)
      • Data Table on Canada - Market size and forecast (2023-2028) ($ million)
      • Chart on Canada - Year-over-year growth (2023-2028) (%)
      • Data Table on Canada - Year-over-year growth (2023-2028) (%)
    • 12.16 India - Market size and forecast (2023-2028)
      • Chart on India - Market size and forecast (2023-2028) ($ million)
      • Data Table on India - Market size and forecast (2023-2028) ($ million)
      • Chart on India - Year-over-year growth (2023-2028) (%)
      • Data Table on India - Year-over-year growth (2023-2028) (%)
    • 12.17 Japan - Market size and forecast (2023-2028)
      • Chart on Japan - Market size and forecast (2023-2028) ($ million)
      • Data Table on Japan - Market size and forecast (2023-2028) ($ million)
      • Chart on Japan - Year-over-year growth (2023-2028) (%)
      • Data Table on Japan - Year-over-year growth (2023-2028) (%)
    • 12.18 Australia - Market size and forecast (2023-2028)
      • Chart on Australia - Market size and forecast (2023-2028) ($ million)
      • Data Table on Australia - Market size and forecast (2023-2028) ($ million)
      • Chart on Australia - Year-over-year growth (2023-2028) (%)
      • Data Table on Australia - Year-over-year growth (2023-2028) (%)
    • 12.19 South Korea - Market size and forecast (2023-2028)
      • Chart on South Korea - Market size and forecast (2023-2028) ($ million)
      • Data Table on South Korea - Market size and forecast (2023-2028) ($ million)
      • Chart on South Korea - Year-over-year growth (2023-2028) (%)
      • Data Table on South Korea - Year-over-year growth (2023-2028) (%)

    13 Drivers, Challenges, and Opportunity/Restraints

    • 13.1 Market drivers
      • 13.2 Market challenges
        • 13.3 Impact of drivers and challenges
          • Impact of drivers and challenges in 2023 and 2028
        • 13.4 Market opportunities/restraints

          14 Competitive Landscape

          • 14.1 Overview
            • 14.2 Competitive Landscape
              • Overview on criticality of inputs and factors of differentiation
            • 14.3 Landscape disruption
              • Overview on factors of disruption
            • 14.4 Industry risks
              • Impact of key risks on business

            15 Competitive Analysis

            • 15.1 Companies profiled
              • Companies covered
            • 15.2 Market positioning of companies
              • Matrix on companies position and classification
            • 15.3 Alteryx Inc.
              • Alteryx Inc. - Overview
              • Alteryx Inc. - Product / Service
              • Alteryx Inc. - Key news
              • Alteryx Inc. - Key offerings
            • 15.4 Appian Corp.
              • Appian Corp. - Overview
              • Appian Corp. - Product / Service
              • Appian Corp. - Key news
              • Appian Corp. - Key offerings
            • 15.5 Automation Anywhere Inc.
              • Automation Anywhere Inc. - Overview
              • Automation Anywhere Inc. - Product / Service
              • Automation Anywhere Inc. - Key offerings
            • 15.6 Celonis SE
              • Celonis SE - Overview
              • Celonis SE - Product / Service
              • Celonis SE - Key offerings
            • 15.7 International Business Machines Corp.
              • International Business Machines Corp. - Overview
              • International Business Machines Corp. - Business segments
              • International Business Machines Corp. - Key news
              • International Business Machines Corp. - Key offerings
              • International Business Machines Corp. - Segment focus
            • 15.8 Juniper Networks Inc.
              • Juniper Networks Inc. - Overview
              • Juniper Networks Inc. - Product / Service
              • Juniper Networks Inc. - Key news
              • Juniper Networks Inc. - Key offerings
            • 15.9 Microsoft Corp.
              • Microsoft Corp. - Overview
              • Microsoft Corp. - Business segments
              • Microsoft Corp. - Key news
              • Microsoft Corp. - Key offerings
              • Microsoft Corp. - Segment focus
            • 15.10 NICE Ltd.
              • NICE Ltd. - Overview
              • NICE Ltd. - Business segments
              • NICE Ltd. - Key news
              • NICE Ltd. - Key offerings
              • NICE Ltd. - Segment focus
            • 15.11 PagerDuty Inc.
              • PagerDuty Inc. - Overview
              • PagerDuty Inc. - Product / Service
              • PagerDuty Inc. - Key offerings
            • 15.12 Pegasystems Inc.
              • Pegasystems Inc. - Overview
              • Pegasystems Inc. - Product / Service
              • Pegasystems Inc. - Key news
              • Pegasystems Inc. - Key offerings
            • 15.13 ProcessMaker Inc.
              • ProcessMaker Inc. - Overview
              • ProcessMaker Inc. - Product / Service
              • ProcessMaker Inc. - Key offerings
            • 15.14 SAP SE
              • SAP SE - Overview
              • SAP SE - Business segments
              • SAP SE - Key news
              • SAP SE - Key offerings
              • SAP SE - Segment focus
            • 15.15 SolveXia Pty Ltd.
              • SolveXia Pty Ltd. - Overview
              • SolveXia Pty Ltd. - Product / Service
              • SolveXia Pty Ltd. - Key offerings
            • 15.16 UiPath Inc.
              • UiPath Inc. - Overview
              • UiPath Inc. - Product / Service
              • UiPath Inc. - Key news
              • UiPath Inc. - Key offerings
            • 15.17 Zendesk Inc.
              • Zendesk Inc. - Overview
              • Zendesk Inc. - Product / Service
              • Zendesk Inc. - Key offerings

            16 Appendix

            • 16.1 Scope of the report
              • 16.2 Inclusions and exclusions checklist
                • Inclusions checklist
                • Exclusions checklist
              • 16.3 Currency conversion rates for US$
                • Currency conversion rates for US$
              • 16.4 Research methodology
                • Research methodology
              • 16.5 Data procurement
                • Information sources
              • 16.6 Data validation
                • Data validation
              • 16.7 Validation techniques employed for market sizing
                • Validation techniques employed for market sizing
              • 16.8 Data synthesis
                • Data synthesis
              • 16.9 360 degree market analysis
                • 360 degree market analysis
              • 16.10 List of abbreviations
                • List of abbreviations

              Research Methodology

              Technavio presents a detailed picture of the market by way of study, synthesis, and summation of data from multiple sources. The analysts have presented the various facets of the market with a particular focus on identifying the key industry influencers. The data thus presented is comprehensive, reliable, and the result of extensive research, both primary and secondary.

              INFORMATION SOURCES

              Primary sources

              • Manufacturers and suppliers
              • Channel partners
              • Industry experts
              • Strategic decision makers

              Secondary sources

              • Industry journals and periodicals
              • Government data
              • Financial reports of key industry players
              • Historical data
              • Press releases

              DATA ANALYSIS

              Data Synthesis

              • Collation of data
              • Estimation of key figures
              • Analysis of derived insights

              Data Validation

              • Triangulation with data models
              • Reference against proprietary databases
              • Corroboration with industry experts

              REPORT WRITING

              Qualitative

              • Market drivers
              • Market challenges
              • Market trends
              • Five forces analysis

              Quantitative

              • Market size and forecast
              • Market segmentation
              • Geographical insights
              • Competitive landscape

              Interested in this report?

              Get your sample now to see our research methodology and insights!

              Download Now

              Frequently Asked Questions

              Rpa And Hyperautomation market growth will increase by $ 31635.5 mn during 2024-2028 .

              The Rpa And Hyperautomation market is expected to grow at a CAGR of 27.77% during 2024-2028 .

              Rpa And Hyperautomation market is segmented by Component( Solutions, Services) Technology( RPA, Business process management suites, Decision management systems, Integration platform as a service)

              Akabot, Alteryx Inc., Appian Corp., Automation Anywhere Inc., Celonis SE, Compulink Management Center Inc., Datamatics Global Services Limited, Fortra LLC, International Business Machines Corp., Juniper Networks Inc., Microsoft Corp., NICE Ltd., PagerDuty Inc., Pegasystems Inc., ProcessMaker Inc., SAP SE, SolveXia Pty Ltd., SS and C Technologies Holdings Inc., UiPath Inc., Zendesk Inc. are a few of the key vendors in the Rpa And Hyperautomation market.

              APAC will register the highest growth rate of 42% among the other regions. Therefore, the Rpa And Hyperautomation market in APAC is expected to garner significant business opportunities for the vendors during the forecast period.

              US, Canada, India, Japan, Australia, South Korea, China, UK, Germany, South Africa, Saudi Arabia

              • Rise in need for automation within major industriesEvery industry is trying to keep up with the changes as technology develops. Businesses can find safety violations using hyperautomation before they result in accidents or liabilities. Hyperautomation also makes sure that job site employees precisely follow pedestrian walking lanes is the driving factor this market.
              • confirms the security of safety equipment is the driving factor this market.
              • and makes sure that it is always worn. The integration and widespread use of automation in construction projects as well as other industries is the driving factor this market.
              • are therefore expected to present opportunities for hyperautomation because it also gives real-time data on job-site behavior so that modifications may be made based on data rather than speculation. Thus is the driving factor this market.
              • the rise in the need for automation within major industries is one of the major factors which is expected to drive the growth of the global RPA and hyperautomation market during the forecast period. is the driving factor this market.

              The Rpa And Hyperautomation market vendors should focus on grabbing business opportunities from the Solutions segment as it accounted for the largest market share in the base year.