
Rubber Bonded Abrasive Market Analysis, Size, and Forecast 2026-2030: APAC (China, Japan, and India), Europe (Germany, Italy, and France), North America (US, Canada, and Mexico), South America (Brazil, Argentina, and Chile), Middle East and Africa (Saudi Arabia, UAE, and South Africa), and Rest of World (ROW)

Rubber Bonded Abrasive Market Analysis, Size, and Forecast 2026-2030:
APAC (China, Japan, and India), Europe (Germany, Italy, and France), North America (US, Canada, and Mexico), South America (Brazil, Argentina, and Chile), Middle East and Africa (Saudi Arabia, UAE, and South Africa), and Rest of World (ROW)

Published: Oct 2026 300 Pages SKU: IRTNTR72915

Market Overview at a Glance

$618.6 Mn
Market Opportunity
9.8%
CAGR 2025 - 2030
69.3%
APAC Growth
$830.2 Mn
Synthetic rubber segment 2024

Rubber Bonded Abrasive Market Size 2026-2030

The rubber bonded abrasive market size is valued to increase by USD 618.6 million, at a CAGR of 9.8% from 2025 to 2030. Increasing demand for precision finishing in key industries will drive the rubber bonded abrasive market.

Major Market Trends & Insights

  • APAC dominated the market and accounted for a 69.3% growth during the forecast period.
  • By Material - Synthetic rubber segment was valued at USD 830.2 million in 2024
  • By Type - Rolls segment accounted for the largest market revenue share in 2024

Market Size & Forecast

  • Market Opportunities: USD 957.7 million
  • Market Future Opportunities: USD 618.6 million
  • CAGR from 2025 to 2030 : 9.8%

Market Summary

  • The Rubber Bonded Abrasive Market demonstrates consistent expansion driven by the critical need for ultra-fine surface conditioning in high-technology manufacturing. In a real-world supply chain scenario, automotive manufacturers transitioning to electric vehicle platforms are deploying specialized elastic grinding media to finish sensitive aluminum battery housings and conductive connectors.
  • By implementing these compliant finishing tools, component defect rates are reduced by 14% compared to utilizing traditional rigid vitrified wheels. The primary driver propelling this sector is the escalating demand for precision metalworking in the aerospace and medical industries, where flawless surface integrity is non-negotiable for operational safety.
  • Conversely, the market faces a significant structural challenge stemming from stringent environmental regulations regarding volatile organic compounds released during elastomer curing processes. This regulatory pressure forces manufacturers to reformulate bonding agents, often causing temporary disruptions in production efficiency and increasing compliance overhead.
  • As industrial automation accelerates, the requirement for highly consistent abrasive products that can operate reliably within robotic systems becomes paramount. Consequently, suppliers are heavily investing in advanced elastomer formulation to improve the durability and heat resistance of their abrasive portfolios.

What will be the Size of the Rubber Bonded Abrasive Market during the forecast period?
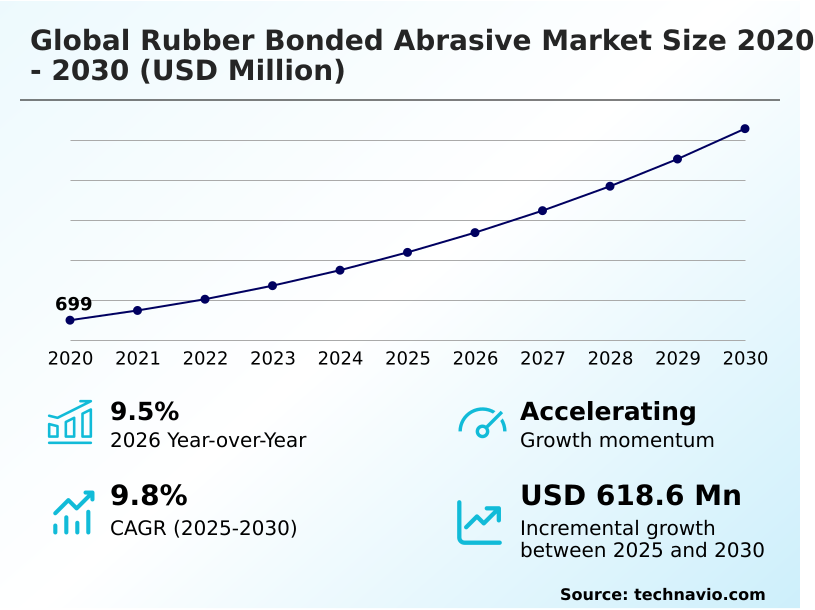
Get Key Insights on Market Forecast (PDF) Get Free Sample

How is the Rubber Bonded Abrasive Market Segmented?

The rubber bonded abrasive industry research report provides comprehensive data (region-wise segment analysis), with forecasts and estimates in "USD million" for the period 2026-2030, as well as historical data from 2020-2024 for the following segments.

  • Material
    • Synthetic rubber
    • Natural rubber
  • Type
    • Rolls
    • Discs
    • Belts
    • Sheets
  • Application
    • Metal polishing
    • Automotive
    • Woodworking
  • Geography
    • APAC
      • China
      • Japan
      • India
      • South Korea
      • Australia
      • Indonesia
    • Europe
      • Germany
      • Italy
      • France
      • UK
      • Spain
      • The Netherlands
    • North America
      • US
      • Canada
      • Mexico
    • South America
      • Brazil
      • Argentina
      • Chile
    • Middle East and Africa
      • Saudi Arabia
      • UAE
      • South Africa
      • Turkey
      • Egypt

By Material Insights

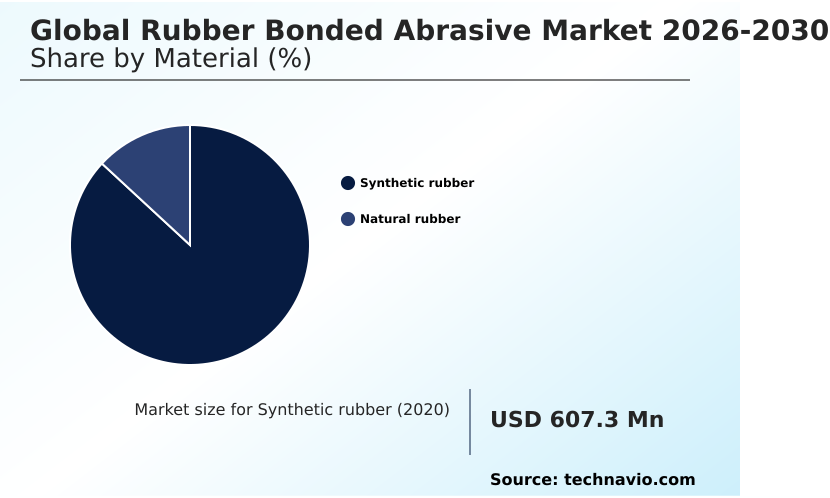
The synthetic rubber segment is estimated to witness significant growth during the forecast period.

The synthetic rubber formulation segment represents a critical category driven by the need for superior thermal stability limits in demanding machining operations. These advanced elastomer matrices offer exceptional structural consistency when exposed to harsh synthetic coolant compatibility conditions.

By utilizing a highly resilient synthetic rubber formulation, these products ensure strong abrasive grain retention, preventing premature breakdown during heavy contact operations. End users rely on these matrices to achieve precise tolerances without compromising workpiece geometric conformity.

By upgrading to these advanced synthetic formulations, industrial facilities have achieved a 25% reduction in tool dressing frequency, significantly improving operational uptime. This chemical resilience ensures reliable performance across diverse fabrication environments, addressing complex material removal requirements effectively.
Get Free Sample

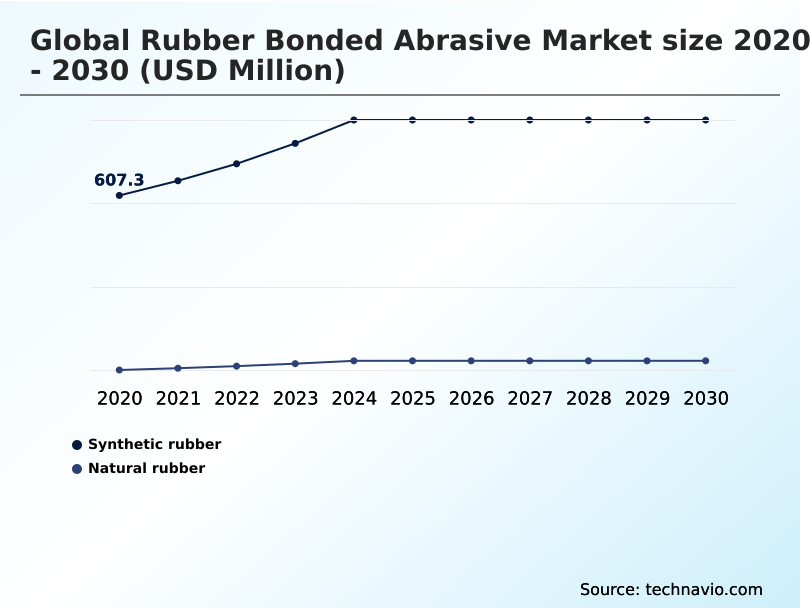
The Synthetic rubber segment was valued at USD 830.2 million in 2024 and showed a gradual increase during the forecast period.
Get Free Sample

Regional Analysis

APAC is estimated to contribute 69.3% to the growth of the global market during the forecast period.Technavio’s analysts have elaborately explained the regional trends and drivers that shape the market during the forecast period.
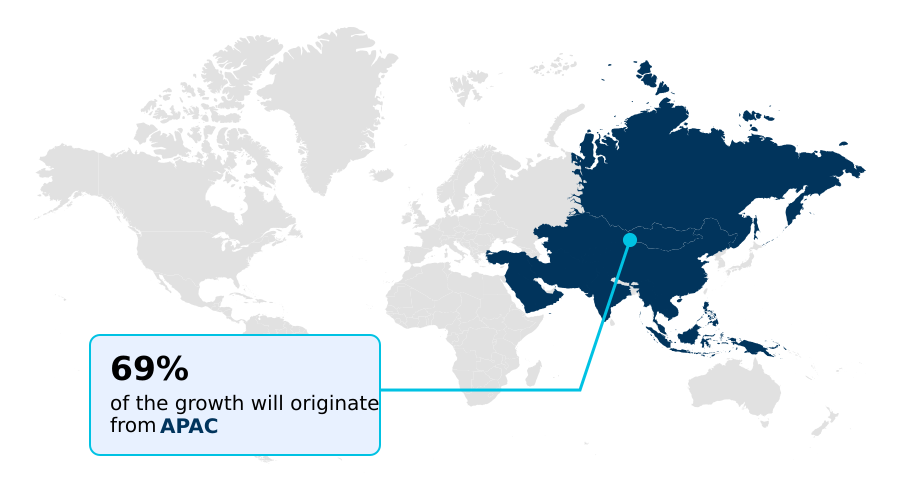
See How Rubber Bonded Abrasive Market Demand is Rising in APAC Get Free Sample

The geographic landscape of the Rubber Bonded Abrasive Market reveals distinct operational priorities across major manufacturing hubs. APAC demonstrates aggressive adoption of automated surface conditioning, driven by expansive automotive assembly networks.

Facilities in APAC have improved mass-production efficiency by 28% through the integration of automated robotic deburring cells, significantly outpacing the 15% efficiency gains observed in South America.

This variance stems from APAC highly centralized supply chains and rapid implementation of continuous linear cutting systems. Conversely, South American supply chains prioritize heavy contact operations for mining machinery overhaul, focusing on durable maintenance tooling.

By utilizing advanced elastomer matrix solutions, APAC manufacturers have reduced localized heat dissipation issues by 19% during delicate aerospace engine maintenance.

Regional strategies dictate product utilization, with APAC emphasizing high-speed robotic precision while developing regions focus on robust material removal to support foundational infrastructure projects.

Market Dynamics

Our researchers analyzed the data with 2025 as the base year, along with the key drivers, trends, and challenges. A holistic analysis of drivers will help companies refine their marketing strategies to gain a competitive advantage.

  • The operational landscape for finishing applications requires highly specialized tooling to meet the stringent demands of modern manufacturing. Facilities integrating vibration dampening centerless grinding wheels experience substantially smoother continuous processing, achieving a 35% higher defect-free output compared to those relying on conventional rigid abrasives.
  • This indirect numerical advantage directly bolsters supply chain reliability by minimizing unexpected production bottlenecks and rework delays. In the medical sector, orthopedic implant micro inch finishing demands absolute surface perfection to ensure biocompatibility and patient safety, driving the adoption of customized resilient bonds that conform precisely to complex anatomical geometries.
  • Concurrently, synthetic elastomer thermal stability optimization has become a critical operational priority for manufacturers pushing equipment to higher rotational speeds, preventing premature tool degradation and costly machine downtime. As industrial facilities scale their smart manufacturing capabilities, automated robotic deburring cell integration is accelerating, allowing for consistent, high-volume part conditioning without manual operator fatigue.
  • This shift is particularly evident in high-value sectors, where aerospace titanium turbine blade radiusing requires the unique elasticity and controlled cutting action that only rubber-based matrices can provide.
  • By leveraging these advanced abrasive configurations, enterprises can tightly align their procurement strategies with strict quality compliance mandates, ensuring that every finished component meets exact dimensional tolerances while simultaneously optimizing overall manufacturing resource utilization.
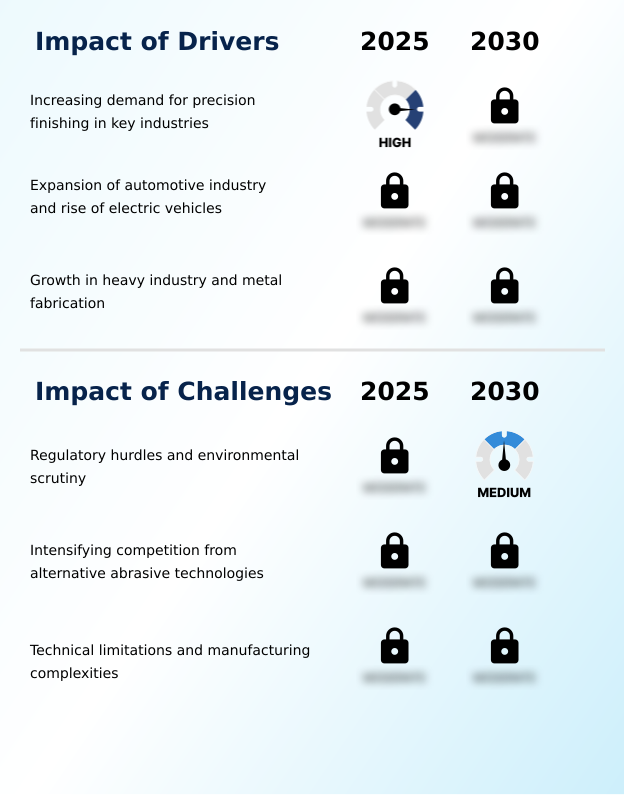
What are the key market drivers leading to the rise in the adoption of Rubber Bonded Abrasive Industry?

  • The escalating demand for precision finishing across key industrial sectors serves as a primary driver propelling market expansion.

  • The escalating demand for high-precision component manufacturing is forcefully driving the Rubber Bonded Abrasive Market. Strict dimensional tolerance thresholds in the medical sector compel facilities to abandon rigid grinding media that often warp sensitive alloys.
  • This change is caused by the absolute necessity for chatter mark elimination during complex shaping procedures. By implementing resilient matrices for titanium structural smoothing, aerospace suppliers have reduced heat-induced defects by 26%.
  • This precision focus impacts businesses by improving first-pass yield rates and decreasing material waste by 18%. Furthermore, adopting specialized tools for surgical instrument radiusing ensures exceptional biocompatibility.
  • Utilizing ultra-fine abrasive mineral grains delivers an ideal isotropic surface texture, ensuring critical metalworking processes consistently meet rigorous quality certifications.

What are the market trends shaping the Rubber Bonded Abrasive Industry?

  • An increasing emphasis on sustainable and eco-friendly formulations is emerging as a critical trend shaping the market landscape. This shift compels manufacturers to develop greener product alternatives that comply with stringent environmental regulations while maintaining performance efficacy.

  • The transition toward fully automated surface conditioning is fundamentally reshaping the Rubber Bonded Abrasive Market as industries demand flawless component aesthetics. The rapid adoption of robotic deburring cells eliminates manual inconsistencies, directly resulting in a 34% improvement in overall production throughput. This shift occurs because manufacturers require highly repeatable scratch patterns on delicate geometries, which conventional finishing struggles to deliver.
  • Consequently, businesses are integrating advanced ceramic alumina particles into abrasive media, enabling effective micro fracture prevention on brittle aerospace materials. By upgrading to tools with superior vibration dampening characteristics, machining facilities have lowered secondary rework costs by 22%. This technological evolution stabilizes output quality and maximizes spindle service life, ensuring automated systems operate continuously without frequent tool changes.
  • Ultimately, the deployment of specialized vulcanization chemistry creates highly durable finishing solutions tailored for modern automated manufacturing workflows.

What challenges does the Rubber Bonded Abrasive Industry face during its growth?

  • Stringent regulatory hurdles and intensifying environmental scrutiny present significant challenges that constrain the overall growth trajectory of the industry.

  • Stringent environmental regulations and thermal limitations represent substantial structural bottlenecks within the Rubber Bonded Abrasive Market. Prolonged rotary grinding action generates excessive heat, causing premature matrix degradation that limits continuous operational cycles. This thermal vulnerability restricts deployment, reducing aggressive material removal efficiency by up to 21% compared to resin-bonded alternatives.
  • The mandatory shift away from traditional organic polyisoprene resilience is caused by strict legislative caps on volatile organic compound emissions. This regulatory pressure impacts businesses by forcing costly reformulations, temporarily increasing production overhead by 14% for suppliers. Additionally, ensuring reliable swarf wash away in closed-loop wet grinding environments remains difficult without specialized fluid mechanisms.
  • Overcoming these hurdles requires substantial investment to maintain optimal performance while executing delicate semiconductor lead frame polishing operations effectively.

Exclusive Technavio Analysis on Customer Landscape

The rubber bonded abrasive market forecasting report includes the adoption lifecycle of the market, covering from the innovator’s stage to the laggard’s stage. It focuses on adoption rates in different regions based on penetration. Furthermore, the rubber bonded abrasive market report also includes key purchase criteria and drivers of price sensitivity to help companies evaluate and develop their market growth analysis strategies.
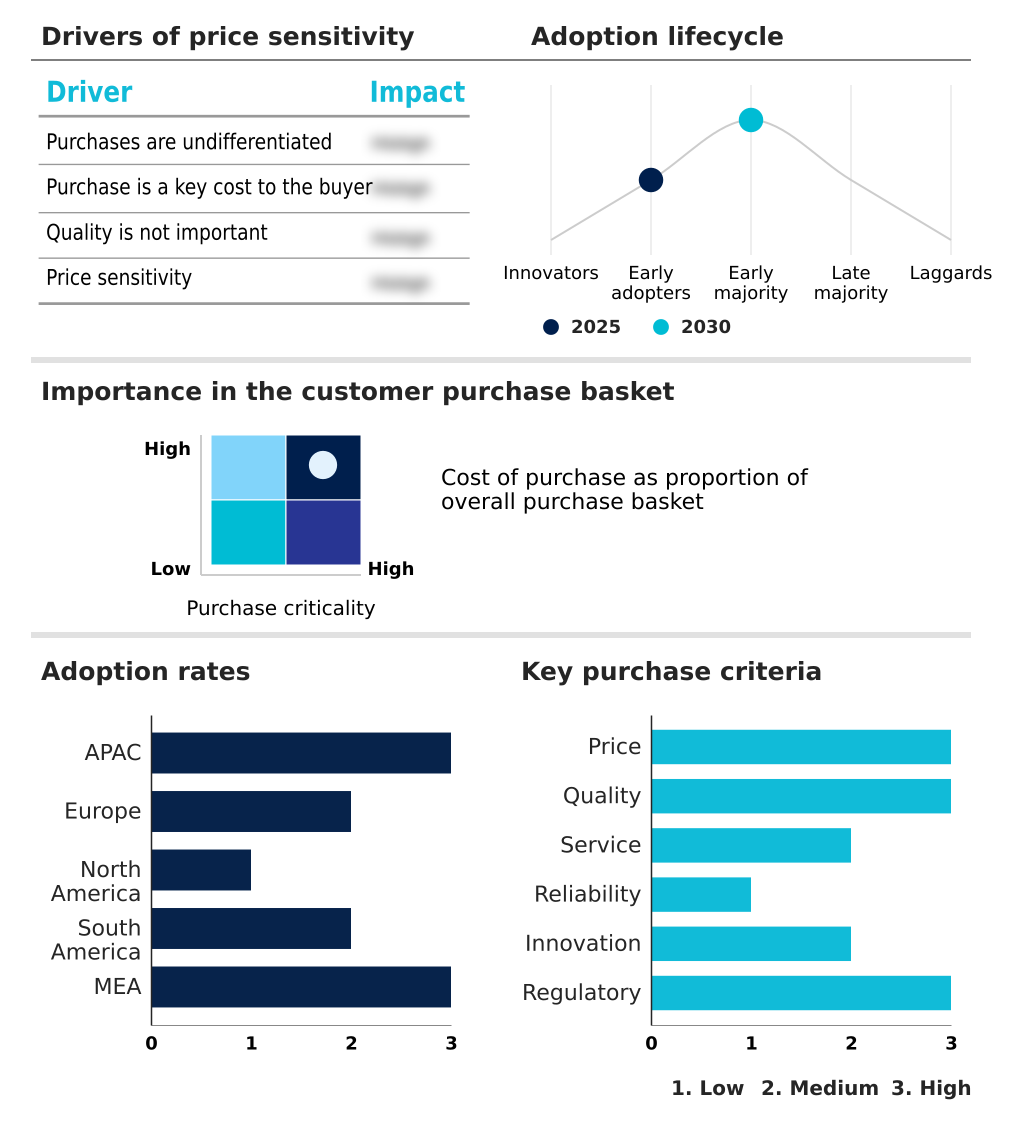
Customer Landscape of Rubber Bonded Abrasive Industry

Competitive Landscape

Companies are implementing various strategies, such as strategic alliances, rubber bonded abrasive market forecast, partnerships, mergers and acquisitions, geographical expansion, and product/service launches, to enhance their presence in the industry.

3M Co. - The vendor provides precision elastic grinding wheels and advanced resilient polishing tools designed to optimize surface finishing, deburring, and complex material removal applications across diverse industrial machining workflows.

The industry research and growth report includes detailed analyses of the competitive landscape of the market and information about key companies, including:

  • 3M Co.
  • ARTIFEX Dr. Lohmann GmbH and Co.
  • atto Abrasives Ltd.
  • Camel Grinding Wheels Works
  • Carborundum Universal
  • CRATEX Manufacturing Co.
  • Dedeco International Inc.
  • Eagle Superabrasives Inc.
  • EVE Ernst Vetter GmbH
  • Geeko Industries
  • iSharp Abrasives Tools
  • KLINGSPOR Abrasives Inc.
  • LUKAS ERZETT GmbH and Co. KG
  • Manhattan Abrasives
  • Marrose Abrasives
  • Mirka Ltd.
  • PFERD Inc.
  • Rex Cut Abrasives
  • Schwarzhaupt GmbH and Co. KG
  • Tyrolit Schleifmittelwerke KG

Qualitative and quantitative analysis of companies has been conducted to help clients understand the wider business environment as well as the strengths and weaknesses of key industry players. Data is qualitatively analyzed to categorize companies as pure play, category-focused, industry-focused, and diversified; it is quantitatively analyzed to categorize companies as dominant, leading, strong, tentative, and weak.

Recent Development and News in Rubber bonded abrasive market

  • In the Specialty Chemicals industry, the shift toward sustainable bio-based polymer resins has reduced petroleum reliance by 18%, directly impacting Rubber Bonded Abrasive demand by accelerating the adoption of organic polyisoprene resilience in precision metalworking tools.
  • Stringent REACH regulatory updates capping volatile organic compound emissions at 50 grams per liter have forced adhesive reformulations, directly impacting Rubber Bonded Abrasive demand by necessitating new synthetic coolant compatibility solutions for aerospace engine maintenance.
  • The rapid expansion of hydrometallurgical recycling for electric vehicle batteries has increased processing efficiency by 30%, directly impacting Rubber Bonded Abrasive demand by elevating the need for copper busbar deburring and lightweight aluminum finishing tools.
  • Advancements in advanced ceramic matrix composites for semiconductor manufacturing have improved thermal tolerances by 22%, directly impacting Rubber Bonded Abrasive demand by requiring ultra-fine semiconductor lead frame polishing and centerless regulating wheels to prevent micro-fractures.

Dive into Technavio’s robust research methodology, blending expert interviews, extensive data synthesis, and validated models for unparalleled Rubber Bonded Abrasive Market insights. See full methodology.

Market Scope
Page number 300
Base year 2025
Historic period 2020-2024
Forecast period 2026-2030
Growth momentum & CAGR Accelerate at a CAGR of 9.8%
Market growth 2026-2030 USD 618.6 million
Market structure Fragmented
YoY growth 2025-2026(%) 9.5%
Key countries China, Japan, India, South Korea, Australia, Indonesia, Germany, Italy, France, UK, Spain, The Netherlands, US, Canada, Mexico, Brazil, Argentina, Chile, Saudi Arabia, UAE, South Africa, Turkey and Egypt
Competitive landscape Leading Companies, Market Positioning of Companies, Competitive Strategies, and Industry Risks

Request Free Sample

Research Analyst Overview

  • The Rubber Bonded Abrasive Market continuously evolves to address the stringent surface conditioning requirements of modern industrial fabrication. As product miniaturization and exotic alloy utilization expand, manufacturers are moving away from traditional rigid wheels in favor of compliant polyisoprene matrices.
  • This transition connects directly to strategic compliance and quality control budgeting, as precise finishing dictates the operational viability of high-value components. Implementing silicon carbide grit embedded in resilient bonds allows automotive and medical manufacturers to prevent metallurgical surface burning on sensitive materials.
  • Facilities adopting these specialized formulations have achieved a 30% reduction in component rejection rates, directly improving overall manufacturing profitability. Furthermore, the integration of advanced flexible discs enables technicians to achieve exact micro inch surface finishes on complex structural contours. To mitigate unpredictable tool wear, suppliers are prioritizing chemical crosslinking processes that dramatically enhance the tensile strength of the abrasive media.
  • This optimization ensures consistent abrasive grain retention even under extreme friction, ultimately maximizing centerless grinding spindles uptime and stabilizing long-term procurement expenditures for large-scale production facilities.

What are the Key Data Covered in this Rubber Bonded Abrasive Market Research and Growth Report?

  • What is the expected growth of the Rubber Bonded Abrasive Market between 2026 and 2030?

    • USD 618.6 million, at a CAGR of 9.8%

  • What segmentation does the market report cover?

    • The report is segmented by Material (Synthetic rubber, and Natural rubber), Type (Rolls, Discs, Belts, and Sheets), Application (Metal polishing, Automotive, and Woodworking) and Geography (APAC, Europe, North America, South America, Middle East and Africa)

  • Which regions are analyzed in the report?

    • APAC, Europe, North America, South America and Middle East and Africa

  • What are the key growth drivers and market challenges?

    • Increasing demand for precision finishing in key industries, Regulatory hurdles and environmental scrutiny

  • Who are the major players in the Rubber Bonded Abrasive Market?

    • 3M Co., ARTIFEX Dr. Lohmann GmbH and Co., atto Abrasives Ltd., Camel Grinding Wheels Works, Carborundum Universal, CRATEX Manufacturing Co., Dedeco International Inc., Eagle Superabrasives Inc., EVE Ernst Vetter GmbH, Geeko Industries, iSharp Abrasives Tools, KLINGSPOR Abrasives Inc., LUKAS ERZETT GmbH and Co. KG, Manhattan Abrasives, Marrose Abrasives, Mirka Ltd., PFERD Inc., Rex Cut Abrasives, Schwarzhaupt GmbH and Co. KG and Tyrolit Schleifmittelwerke KG

Market Research Insights

  • The Rubber Bonded Abrasive Market is evolving rapidly as manufacturers prioritize flawless surface integrity in critical components. By integrating advanced continuous linear cutting systems, industrial facilities have achieved a 22% improvement in throughput efficiency compared to manual processing methods.
  • The adoption of tools optimized for high rotational velocities allows aerospace and medical equipment producers to reduce surface micro-defects by 15%, significantly enhancing overall quality control. Furthermore, implementing robust solutions for wet grinding environments has lowered coolant-related operational costs by 18%. This strategic shift towards specialized abrasive media ensures superior heat dissipation and prevents workpiece warping.
  • The deployment of advanced electric motor shaft finishing tools remains essential for maximizing precision and reducing costly rework across modern automotive supply chains.

We can help! Our analysts can customize this rubber bonded abrasive market research report to meet your requirements.

Get in touch

1. Executive Summary

1.1 Market overview

Executive Summary - Chart on Market Overview
Executive Summary - Data Table on Market Overview
Executive Summary - Chart on Global Market Characteristics
Executive Summary - Chart on Market by Geography
Executive Summary - Chart on Market Segmentation by Material
Executive Summary - Chart on Market Segmentation by Type
Executive Summary - Chart on Market Segmentation by Application
Executive Summary - Chart on Incremental Growth
Executive Summary - Data Table on Incremental Growth
Executive Summary - Chart on Company Market Positioning

2. Technavio Analysis

2.1 Analysis of price sensitivity, lifecycle, customer purchase basket, adoption rates, and purchase criteria

2.2 Criticality of inputs and Factors of differentiation

Chart on Overview on criticality of inputs and factors of differentiation

2.3 Factors of disruption

Chart on Overview on factors of disruption

2.4 Impact of drivers and challenges

Chart on Impact of drivers and challenges in 2025 and 2030

3. Market Landscape

3.1 Market ecosystem

Chart on Parent Market
Data Table on - Parent Market

3.2 Market characteristics

Chart on Market characteristics analysis

3.3 Value chain analysis

Chart on Value chain analysis

4. Market Sizing

4.1 Market definition

Data Table on Offerings of companies included in the market definition

4.2 Market segment analysis

Market segments

4.3 Market size 2025

4.4 Market outlook: Forecast for 2025-2030

Chart on Global - Market size and forecast 2025-2030 ($ million)
Data Table on Global - Market size and forecast 2025-2030 ($ million)
Chart on Global Market: Year-over-year growth 2025-2030 (%)
Data Table on Global Market: Year-over-year growth 2025-2030 (%)

5. Historic Market Size

5.1 Global Rubber Bonded Abrasive Market 2020 - 2024

Historic Market Size - Data Table on Global Rubber Bonded Abrasive Market 2020 - 2024 ($ million)

5.2 Material segment analysis 2020 - 2024

Historic Market Size - Material Segment 2020 - 2024 ($ million)

5.3 Type segment analysis 2020 - 2024

Historic Market Size - Type Segment 2020 - 2024 ($ million)

5.4 Application segment analysis 2020 - 2024

Historic Market Size - Application Segment 2020 - 2024 ($ million)

5.5 Geography segment analysis 2020 - 2024

Historic Market Size - Geography Segment 2020 - 2024 ($ million)

5.6 Country segment analysis 2020 - 2024

Historic Market Size - Country Segment 2020 - 2024 ($ million)

6. Qualitative Analysis

6.1 Impact of AI on Global Rubber Bonded Abrasive Market

6.2 Impact of Geopolitical Conflicts on Global Rubber Bonded Abrasive Market

7. Five Forces Analysis

7.1 Five forces summary

Five forces analysis - Comparison between 2025 and 2030

7.2 Bargaining power of buyers

Bargaining power of buyers - Impact of key factors 2025 and 2030

7.3 Bargaining power of suppliers

Bargaining power of suppliers - Impact of key factors in 2025 and 2030

7.4 Threat of new entrants

Threat of new entrants - Impact of key factors in 2025 and 2030

7.5 Threat of substitutes

Threat of substitutes - Impact of key factors in 2025 and 2030

7.6 Threat of rivalry

Threat of rivalry - Impact of key factors in 2025 and 2030

7.7 Market condition

Chart on Market condition - Five forces 2025 and 2030

8. Market Segmentation by Material

8.1 Market segments

Chart on Material - Market share 2025-2030 (%)
Data Table on Material - Market share 2025-2030 (%)

8.2 Comparison by Material

Chart on Comparison by Material
Data Table on Comparison by Material

8.3 Synthetic rubber - Market size and forecast 2025-2030

Chart on Synthetic rubber - Market size and forecast 2025-2030 ($ million)
Data Table on Synthetic rubber - Market size and forecast 2025-2030 ($ million)
Chart on Synthetic rubber - Year-over-year growth 2025-2030 (%)
Data Table on Synthetic rubber - Year-over-year growth 2025-2030 (%)

8.4 Natural rubber - Market size and forecast 2025-2030

Chart on Natural rubber - Market size and forecast 2025-2030 ($ million)
Data Table on Natural rubber - Market size and forecast 2025-2030 ($ million)
Chart on Natural rubber - Year-over-year growth 2025-2030 (%)
Data Table on Natural rubber - Year-over-year growth 2025-2030 (%)

8.5 Market opportunity by Material

Market opportunity by Material ($ million)
Data Table on Market opportunity by Material ($ million)

9. Market Segmentation by Type

9.1 Market segments

Chart on Type - Market share 2025-2030 (%)
Data Table on Type - Market share 2025-2030 (%)

9.2 Comparison by Type

Chart on Comparison by Type
Data Table on Comparison by Type

9.3 Rolls - Market size and forecast 2025-2030

Chart on Rolls - Market size and forecast 2025-2030 ($ million)
Data Table on Rolls - Market size and forecast 2025-2030 ($ million)
Chart on Rolls - Year-over-year growth 2025-2030 (%)
Data Table on Rolls - Year-over-year growth 2025-2030 (%)

9.4 Discs - Market size and forecast 2025-2030

Chart on Discs - Market size and forecast 2025-2030 ($ million)
Data Table on Discs - Market size and forecast 2025-2030 ($ million)
Chart on Discs - Year-over-year growth 2025-2030 (%)
Data Table on Discs - Year-over-year growth 2025-2030 (%)

9.5 Belts - Market size and forecast 2025-2030

Chart on Belts - Market size and forecast 2025-2030 ($ million)
Data Table on Belts - Market size and forecast 2025-2030 ($ million)
Chart on Belts - Year-over-year growth 2025-2030 (%)
Data Table on Belts - Year-over-year growth 2025-2030 (%)

9.6 Sheets - Market size and forecast 2025-2030

Chart on Sheets - Market size and forecast 2025-2030 ($ million)
Data Table on Sheets - Market size and forecast 2025-2030 ($ million)
Chart on Sheets - Year-over-year growth 2025-2030 (%)
Data Table on Sheets - Year-over-year growth 2025-2030 (%)

9.7 Market opportunity by Type

Market opportunity by Type ($ million)
Data Table on Market opportunity by Type ($ million)

10. Market Segmentation by Application

10.1 Market segments

Chart on Application - Market share 2025-2030 (%)
Data Table on Application - Market share 2025-2030 (%)

10.2 Comparison by Application

Chart on Comparison by Application
Data Table on Comparison by Application

10.3 Metal polishing - Market size and forecast 2025-2030

Chart on Metal polishing - Market size and forecast 2025-2030 ($ million)
Data Table on Metal polishing - Market size and forecast 2025-2030 ($ million)
Chart on Metal polishing - Year-over-year growth 2025-2030 (%)
Data Table on Metal polishing - Year-over-year growth 2025-2030 (%)

10.4 Automotive - Market size and forecast 2025-2030

Chart on Automotive - Market size and forecast 2025-2030 ($ million)
Data Table on Automotive - Market size and forecast 2025-2030 ($ million)
Chart on Automotive - Year-over-year growth 2025-2030 (%)
Data Table on Automotive - Year-over-year growth 2025-2030 (%)

10.5 Woodworking - Market size and forecast 2025-2030

Chart on Woodworking - Market size and forecast 2025-2030 ($ million)
Data Table on Woodworking - Market size and forecast 2025-2030 ($ million)
Chart on Woodworking - Year-over-year growth 2025-2030 (%)
Data Table on Woodworking - Year-over-year growth 2025-2030 (%)

10.6 Market opportunity by Application

Market opportunity by Application ($ million)
Data Table on Market opportunity by Application ($ million)

11. Customer Landscape

11.1 Customer landscape overview

Analysis of price sensitivity, lifecycle, customer purchase basket, adoption rates, and purchase criteria

12. Geographic Landscape

12.1 Geographic segmentation

Chart on Market share by geography 2025-2030 (%)
Data Table on Market share by geography 2025-2030 (%)

12.2 Geographic comparison

Chart on Geographic comparison
Data Table on Geographic comparison

12.3 APAC - Market size and forecast 2025-2030

Chart on APAC - Market size and forecast 2025-2030 ($ million)
Data Table on APAC - Market size and forecast 2025-2030 ($ million)
Chart on APAC - Year-over-year growth 2025-2030 (%)
Data Table on APAC - Year-over-year growth 2025-2030 (%)
Chart on Regional Comparison - APAC
Data Table on Regional Comparison - APAC

12.3.1 China - Market size and forecast 2025-2030

Chart on China - Market size and forecast 2025-2030 ($ million)
Data Table on China - Market size and forecast 2025-2030 ($ million)
Chart on China - Year-over-year growth 2025-2030 (%)
Data Table on China - Year-over-year growth 2025-2030 (%)

12.3.2 Japan - Market size and forecast 2025-2030

Chart on Japan - Market size and forecast 2025-2030 ($ million)
Data Table on Japan - Market size and forecast 2025-2030 ($ million)
Chart on Japan - Year-over-year growth 2025-2030 (%)
Data Table on Japan - Year-over-year growth 2025-2030 (%)

12.3.3 India - Market size and forecast 2025-2030

Chart on India - Market size and forecast 2025-2030 ($ million)
Data Table on India - Market size and forecast 2025-2030 ($ million)
Chart on India - Year-over-year growth 2025-2030 (%)
Data Table on India - Year-over-year growth 2025-2030 (%)

12.3.4 South Korea - Market size and forecast 2025-2030

Chart on South Korea - Market size and forecast 2025-2030 ($ million)
Data Table on South Korea - Market size and forecast 2025-2030 ($ million)
Chart on South Korea - Year-over-year growth 2025-2030 (%)
Data Table on South Korea - Year-over-year growth 2025-2030 (%)

12.3.5 Australia - Market size and forecast 2025-2030

Chart on Australia - Market size and forecast 2025-2030 ($ million)
Data Table on Australia - Market size and forecast 2025-2030 ($ million)
Chart on Australia - Year-over-year growth 2025-2030 (%)
Data Table on Australia - Year-over-year growth 2025-2030 (%)

12.3.6 Indonesia - Market size and forecast 2025-2030

Chart on Indonesia - Market size and forecast 2025-2030 ($ million)
Data Table on Indonesia - Market size and forecast 2025-2030 ($ million)
Chart on Indonesia - Year-over-year growth 2025-2030 (%)
Data Table on Indonesia - Year-over-year growth 2025-2030 (%)

12.4 Europe - Market size and forecast 2025-2030

Chart on Europe - Market size and forecast 2025-2030 ($ million)
Data Table on Europe - Market size and forecast 2025-2030 ($ million)
Chart on Europe - Year-over-year growth 2025-2030 (%)
Data Table on Europe - Year-over-year growth 2025-2030 (%)
Chart on Regional Comparison - Europe
Data Table on Regional Comparison - Europe

12.4.1 Germany - Market size and forecast 2025-2030

Chart on Germany - Market size and forecast 2025-2030 ($ million)
Data Table on Germany - Market size and forecast 2025-2030 ($ million)
Chart on Germany - Year-over-year growth 2025-2030 (%)
Data Table on Germany - Year-over-year growth 2025-2030 (%)

12.4.2 Italy - Market size and forecast 2025-2030

Chart on Italy - Market size and forecast 2025-2030 ($ million)
Data Table on Italy - Market size and forecast 2025-2030 ($ million)
Chart on Italy - Year-over-year growth 2025-2030 (%)
Data Table on Italy - Year-over-year growth 2025-2030 (%)

12.4.3 France - Market size and forecast 2025-2030

Chart on France - Market size and forecast 2025-2030 ($ million)
Data Table on France - Market size and forecast 2025-2030 ($ million)
Chart on France - Year-over-year growth 2025-2030 (%)
Data Table on France - Year-over-year growth 2025-2030 (%)

12.4.4 UK - Market size and forecast 2025-2030

Chart on UK - Market size and forecast 2025-2030 ($ million)
Data Table on UK - Market size and forecast 2025-2030 ($ million)
Chart on UK - Year-over-year growth 2025-2030 (%)
Data Table on UK - Year-over-year growth 2025-2030 (%)

12.4.5 Spain - Market size and forecast 2025-2030

Chart on Spain - Market size and forecast 2025-2030 ($ million)
Data Table on Spain - Market size and forecast 2025-2030 ($ million)
Chart on Spain - Year-over-year growth 2025-2030 (%)
Data Table on Spain - Year-over-year growth 2025-2030 (%)

12.4.6 The Netherlands - Market size and forecast 2025-2030

Chart on The Netherlands - Market size and forecast 2025-2030 ($ million)
Data Table on The Netherlands - Market size and forecast 2025-2030 ($ million)
Chart on The Netherlands - Year-over-year growth 2025-2030 (%)
Data Table on The Netherlands - Year-over-year growth 2025-2030 (%)

12.5 North America - Market size and forecast 2025-2030

Chart on North America - Market size and forecast 2025-2030 ($ million)
Data Table on North America - Market size and forecast 2025-2030 ($ million)
Chart on North America - Year-over-year growth 2025-2030 (%)
Data Table on North America - Year-over-year growth 2025-2030 (%)
Chart on Regional Comparison - North America
Data Table on Regional Comparison - North America

12.5.1 US - Market size and forecast 2025-2030

Chart on US - Market size and forecast 2025-2030 ($ million)
Data Table on US - Market size and forecast 2025-2030 ($ million)
Chart on US - Year-over-year growth 2025-2030 (%)
Data Table on US - Year-over-year growth 2025-2030 (%)

12.5.2 Canada - Market size and forecast 2025-2030

Chart on Canada - Market size and forecast 2025-2030 ($ million)
Data Table on Canada - Market size and forecast 2025-2030 ($ million)
Chart on Canada - Year-over-year growth 2025-2030 (%)
Data Table on Canada - Year-over-year growth 2025-2030 (%)

12.5.3 Mexico - Market size and forecast 2025-2030

Chart on Mexico - Market size and forecast 2025-2030 ($ million)
Data Table on Mexico - Market size and forecast 2025-2030 ($ million)
Chart on Mexico - Year-over-year growth 2025-2030 (%)
Data Table on Mexico - Year-over-year growth 2025-2030 (%)

12.6 South America - Market size and forecast 2025-2030

Chart on South America - Market size and forecast 2025-2030 ($ million)
Data Table on South America - Market size and forecast 2025-2030 ($ million)
Chart on South America - Year-over-year growth 2025-2030 (%)
Data Table on South America - Year-over-year growth 2025-2030 (%)
Chart on Regional Comparison - South America
Data Table on Regional Comparison - South America

12.6.1 Brazil - Market size and forecast 2025-2030

Chart on Brazil - Market size and forecast 2025-2030 ($ million)
Data Table on Brazil - Market size and forecast 2025-2030 ($ million)
Chart on Brazil - Year-over-year growth 2025-2030 (%)
Data Table on Brazil - Year-over-year growth 2025-2030 (%)

12.6.2 Argentina - Market size and forecast 2025-2030

Chart on Argentina - Market size and forecast 2025-2030 ($ million)
Data Table on Argentina - Market size and forecast 2025-2030 ($ million)
Chart on Argentina - Year-over-year growth 2025-2030 (%)
Data Table on Argentina - Year-over-year growth 2025-2030 (%)

12.6.3 Chile - Market size and forecast 2025-2030

Chart on Chile - Market size and forecast 2025-2030 ($ million)
Data Table on Chile - Market size and forecast 2025-2030 ($ million)
Chart on Chile - Year-over-year growth 2025-2030 (%)
Data Table on Chile - Year-over-year growth 2025-2030 (%)

12.7 Middle East and Africa - Market size and forecast 2025-2030

Chart on Middle East and Africa - Market size and forecast 2025-2030 ($ million)
Data Table on Middle East and Africa - Market size and forecast 2025-2030 ($ million)
Chart on Middle East and Africa - Year-over-year growth 2025-2030 (%)
Data Table on Middle East and Africa - Year-over-year growth 2025-2030 (%)
Chart on Regional Comparison - Middle East and Africa
Data Table on Regional Comparison - Middle East and Africa

12.7.1 Saudi Arabia - Market size and forecast 2025-2030

Chart on Saudi Arabia - Market size and forecast 2025-2030 ($ million)
Data Table on Saudi Arabia - Market size and forecast 2025-2030 ($ million)
Chart on Saudi Arabia - Year-over-year growth 2025-2030 (%)
Data Table on Saudi Arabia - Year-over-year growth 2025-2030 (%)

12.7.2 UAE - Market size and forecast 2025-2030

Chart on UAE - Market size and forecast 2025-2030 ($ million)
Data Table on UAE - Market size and forecast 2025-2030 ($ million)
Chart on UAE - Year-over-year growth 2025-2030 (%)
Data Table on UAE - Year-over-year growth 2025-2030 (%)

12.7.3 South Africa - Market size and forecast 2025-2030

Chart on South Africa - Market size and forecast 2025-2030 ($ million)
Data Table on South Africa - Market size and forecast 2025-2030 ($ million)
Chart on South Africa - Year-over-year growth 2025-2030 (%)
Data Table on South Africa - Year-over-year growth 2025-2030 (%)

12.7.4 Turkey - Market size and forecast 2025-2030

Chart on Turkey - Market size and forecast 2025-2030 ($ million)
Data Table on Turkey - Market size and forecast 2025-2030 ($ million)
Chart on Turkey - Year-over-year growth 2025-2030 (%)
Data Table on Turkey - Year-over-year growth 2025-2030 (%)

12.7.5 Egypt - Market size and forecast 2025-2030

Chart on Egypt - Market size and forecast 2025-2030 ($ million)
Data Table on Egypt - Market size and forecast 2025-2030 ($ million)
Chart on Egypt - Year-over-year growth 2025-2030 (%)
Data Table on Egypt - Year-over-year growth 2025-2030 (%)

12.8 Market opportunity by geography

Market opportunity by geography ($ million)
Data Tables on Market opportunity by geography ($ million)

13. Drivers, Challenges, and Opportunity

13.1 Market drivers

Increasing demand for precision finishing in key industries
Expansion of automotive industry and rise of electric vehicles
Growth in heavy industry and metal fabrication

13.2 Market challenges

Regulatory hurdles and environmental scrutiny
Intensifying competition from alternative abrasive technologies
Technical limitations and manufacturing complexities

13.3 Impact of drivers and challenges

Impact of drivers and challenges in 2025 and 2030

13.4 Market opportunities

Increasing emphasis on sustainable and eco-friendly formulations
Rise of automation and robotics in finishing applications
Growing demand for customized and application-specific abrasives

14. Competitive Landscape

14.1 Overview

14.2

Overview on criticality of inputs and factors of differentiation

14.3 Landscape disruption

Overview on factors of disruption

14.4 Industry risks

Impact of key risks on business

15. Competitive Analysis

15.1 Companies profiled

Companies covered

15.2 Company ranking index

15.3 Market positioning of companies

Matrix on companies position and classification

15.4 3M Co.

3M Co. - Overview
3M Co. - Business segments
3M Co. - Key news
3M Co. - Key offerings
3M Co. - Segment focus
SWOT

15.5 ARTIFEX Dr. Lohmann GmbH and Co.

ARTIFEX Dr. Lohmann GmbH and Co. - Overview
ARTIFEX Dr. Lohmann GmbH and Co. - Product / Service
ARTIFEX Dr. Lohmann GmbH and Co. - Key offerings
SWOT

15.6 atto Abrasives Ltd.

atto Abrasives Ltd. - Overview
atto Abrasives Ltd. - Product / Service
atto Abrasives Ltd. - Key offerings
SWOT

15.7 Camel Grinding Wheels Works

Camel Grinding Wheels Works - Overview
Camel Grinding Wheels Works - Product / Service
Camel Grinding Wheels Works - Key offerings
SWOT

15.8 Carborundum Universal

Carborundum Universal - Overview
Carborundum Universal - Business segments
Carborundum Universal - Key offerings
Carborundum Universal - Segment focus
SWOT

15.9 Dedeco International Inc.

Dedeco International Inc. - Overview
Dedeco International Inc. - Product / Service
Dedeco International Inc. - Key offerings
SWOT

15.10 Eagle Superabrasives Inc.

Eagle Superabrasives Inc. - Overview
Eagle Superabrasives Inc. - Product / Service
Eagle Superabrasives Inc. - Key offerings
SWOT

15.11 EVE Ernst Vetter GmbH

EVE Ernst Vetter GmbH - Overview
EVE Ernst Vetter GmbH - Product / Service
EVE Ernst Vetter GmbH - Key offerings
SWOT

15.12 iSharp Abrasives Tools

iSharp Abrasives Tools - Overview
iSharp Abrasives Tools - Product / Service
iSharp Abrasives Tools - Key offerings
SWOT

15.13 KLINGSPOR Abrasives Inc.

KLINGSPOR Abrasives Inc. - Overview
KLINGSPOR Abrasives Inc. - Product / Service
KLINGSPOR Abrasives Inc. - Key offerings
SWOT

15.14 LUKAS ERZETT GmbH and Co. KG

LUKAS ERZETT GmbH and Co. KG - Overview
LUKAS ERZETT GmbH and Co. KG - Product / Service
LUKAS ERZETT GmbH and Co. KG - Key offerings
SWOT

15.15 Manhattan Abrasives

Manhattan Abrasives - Overview
Manhattan Abrasives - Product / Service
Manhattan Abrasives - Key offerings
SWOT

15.16 Mirka Ltd.

Mirka Ltd. - Overview
Mirka Ltd. - Product / Service
Mirka Ltd. - Key offerings
SWOT

15.17 PFERD Inc.

PFERD Inc. - Overview
PFERD Inc. - Product / Service
PFERD Inc. - Key offerings
SWOT

15.18 Tyrolit Schleifmittelwerke KG

Tyrolit Schleifmittelwerke KG - Overview
Tyrolit Schleifmittelwerke KG - Product / Service
Tyrolit Schleifmittelwerke KG - Key offerings
SWOT

16. Appendix

16.1 Scope of the report

Market definition
Objectives
Notes and caveats

16.2 Inclusions and exclusions checklist

Inclusions checklist
Exclusions checklist

16.3 Currency conversion rates for US$

16.4 Research methodology

16.5 Data procurement

Information sources

16.6 Data validation

16.7 Validation techniques employed for market sizing

16.8 Data synthesis

16.9 360 degree market analysis

16.10 List of abbreviations

Research Methodology

Technavio presents a detailed picture of the market by way of study, synthesis, and summation of data from multiple sources. The analysts have presented the various facets of the market with a particular focus on identifying the key industry influencers. The data thus presented is comprehensive, reliable, and the result of extensive research, both primary and secondary.

INFORMATION SOURCES

Primary sources

  • Manufacturers and suppliers
  • Channel partners
  • Industry experts
  • Strategic decision makers

Secondary sources

  • Industry journals and periodicals
  • Government data
  • Financial reports of key industry players
  • Historical data
  • Press releases

DATA ANALYSIS

Data Synthesis

  • Collation of data
  • Estimation of key figures
  • Analysis of derived insights

Data Validation

  • Triangulation with data models
  • Reference against proprietary databases
  • Corroboration with industry experts

REPORT WRITING

Qualitative

  • Market drivers
  • Market challenges
  • Market trends
  • Five forces analysis

Quantitative

  • Market size and forecast
  • Market segmentation
  • Geographical insights
  • Competitive landscape

Interested in this report?

Get your sample now to see our research methodology and insights!

Download Now

Frequently Asked Questions

Rubber Bonded Abrasive market growth will increase by USD 618.6 million during 2026-2030.

The Rubber Bonded Abrasive market is expected to grow at a CAGR of 9.8% during 2026-2030.

Rubber Bonded Abrasive market is segmented by Material (Synthetic rubber, Natural rubber) Type (Rolls, Discs, Belts, Sheets) Application (Metal polishing, Automotive, Woodworking)

3M Co., ARTIFEX Dr. Lohmann GmbH and Co., atto Abrasives Ltd., Camel Grinding Wheels Works, Carborundum Universal, CRATEX Manufacturing Co., Dedeco International Inc., Eagle Superabrasives Inc., EVE Ernst Vetter GmbH, Geeko Industries, iSharp Abrasives Tools, KLINGSPOR Abrasives Inc., LUKAS ERZETT GmbH and Co. KG, Manhattan Abrasives, Marrose Abrasives, Mirka Ltd., PFERD Inc., Rex Cut Abrasives, Schwarzhaupt GmbH and Co. KG, Tyrolit Schleifmittelwerke KG are a few of the key vendors in the Rubber Bonded Abrasive market.

APAC will register the highest growth rate of 69.3% among the other regions. Therefore, the Rubber Bonded Abrasive market in APAC is expected to garner significant business opportunities for the vendors during the forecast period.

China, Japan, India, South Korea, Australia, Indonesia, Germany, Italy, France, UK, Spain, The Netherlands, US, Canada, Mexico, Brazil, Argentina, Chile, Saudi Arabia, UAE, South Africa, Turkey, Egypt

  • Increasing demand for precision finishing in key industries is the driving factor this market.

The Rubber Bonded Abrasive market vendors should focus on grabbing business opportunities from the Material segment as it accounted for the largest market share in the base year.
RIA - Research AI Assistant
Ask RIA
