
US Same-Day Delivery Market Size 2025-2029
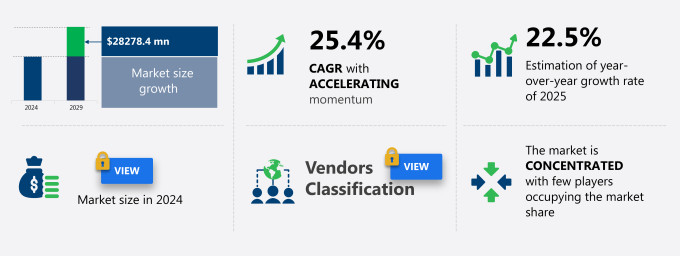
The US same-day delivery market size is forecast to increase by USD 28.28 billion, at a CAGR of 25.4% between 2024 and 2029.
- The market is witnessing significant growth due to several key factors. The burgeoning B2C e-commerce sector is driving market expansion, as consumers increasingly demand faster delivery times. Automation is another major trend, with companies implementing advanced technologies such as drones and robots to streamline their delivery processes. Established players are also responding to this competitive landscape by establishing their own in-house delivery networks, further fueling market growth. These trends are shaping the future of the same-day delivery market In the US, offering significant opportunities for businesses that can adapt and innovate to meet evolving consumer demands.
What will be the Size of the market During the Forecast Period?
- The market has experienced significant growth due to increasing customer expectations for swift and efficient shipping. With the rise of e-commerce and the prevalence of smartphones and tablets, consumers can place orders from anywhere at any time, leading to a rise in same-day delivery demands. Customer satisfaction is paramount in this market, as shipping costs and reliability play a crucial role in customer confidence. Same-day delivery models require a composite infrastructure, combining advanced technological capabilities such as AI and machine learning with an extensive network of vehicles and efficient logistics.
- The digitization of business inventory management and B2C transactions has enabled stationery retail stores and brick-and-mortar businesses to compete with online platforms. Lockdowns and social distancing measures have further accelerated the adoption of same-day delivery services, as consumers seek contactless shopping options. The same-day delivery market is continuously evolving, with technological advances and innovations in vehicle costs, shipping model efficiency, and customer loyalty programs shaping the competitive landscape.
How is this market segmented and which is the largest segment?
The market research report provides comprehensive data (region-wise segment analysis), with forecasts and estimates in "USD million" for the period 2025-2029, as well as historical data from 2019-2023 for the following segments.
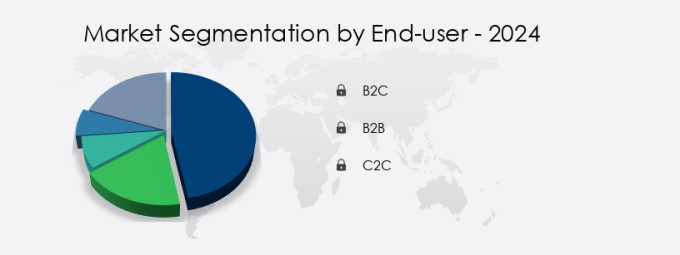
- End-user
- B2C
- B2B
- C2C
- Service
- Regular service
- Priority service
- Rush service
- Geography
- US
By End-user Insights
- The B2C segment is estimated to witness significant growth during the forecast period.
The market is witnessing significant expansion, primarily due to the escalating e-commerce industry. Consumers' preference for swift order fulfillment is driving the demand for same-day delivery services, making it a competitive differentiator among major retailers such as Amazon, Walmart, and Target. Impulsive purchases and urgent deliveries, including medical supplies, further fuel this trend. Technological advancements, including AI and machine learning, are enhancing delivery efficiency and speed. The B2C segment is poised for continued growth, as e-commerce adoption increases, and online platforms cater to the need for instant gratification. The integration of digital streaming, cloud computing, and express postcode shipment tracking further strengthens the same-day delivery market.
Get a glance at the market report of share of various segments Request Free Sample
Market Dynamics
Our US Same-Day Delivery Market researchers analyzed the data with 2024 as the base year, along with the key drivers, trends, and challenges. A holistic analysis of drivers will help companies refine their marketing strategies to gain a competitive advantage.
What are the key market drivers leading to the rise in the adoption of the US Same-Day Delivery Market?
The growing B2C e-commerce market is the key driver of the market.
- The market has witnessed substantial growth due to the widespread use of smartphones, tablets, and internet access. Same-day delivery has emerged as a crucial aspect of the e-commerce experience, with customer satisfaction and confidence being key drivers. E-commerce businesses aim to provide quick turnaround times to stay competitive, with consumers often willing to pay higher shipping costs for same-day delivery. Technological advances, including AI and machine learning, have streamlined the shipping model, enabling real-time order processing and efficient vehicle routing. The need for temperature-controlled vehicles for medical supplies and specimens further underscores the importance of same-day delivery.
- E-commerce platforms and stationery retail stores are expanding their reach through acquisitions and expansion plans, while domestic and international shipping options continue to broaden. The convenience of same-day delivery contributes to increased conversion rates, customer loyalty, and impulsive purchases, reducing cart abandonment and enhancing the overall shopping experience. Cloud computing, digital streaming, and post-ecommerce-parcel services have also integrated with the same-day delivery model, further solidifying its role In the digital economy. Freight, express, and postcode shipment tracking are essential components of the composite delivery infrastructure, ensuring efficient and reliable delivery services.
What are the market trends shaping the US Same-Day Delivery Market?
Automation in the same-day delivery market is the upcoming trend in the market.
- The market is witnessing significant advancements driven by the integration of technology and the increasing demand for quick and efficient shipping. Sole traders and e-commerce businesses are prioritizing customer satisfaction by offering same-day delivery services to enhance customer confidence and reduce cart abandonment. Technological advances, including AI and machine learning, are streamlining operations and reducing delivery times, while also cutting shipping costs. Autonomous logistics, such as temperature-controlled vehicles for medical supplies and specimens, are gaining popularity for their accuracy and efficiency. Furthermore, the digitization of businesses, including e-commerce platforms and brick-and-mortar stores, is driving the adoption of same-day delivery services.
- The use of smartphones and tablets for online purchases and the availability of internet access have made same-day delivery a convenient option for customers, particularly for impulsive purchases. Express and postal services are expanding their same-day delivery offerings, while freight companies are investing in composite delivery infrastructure to cater to the growing demand. The integration of digital streaming, cloud computing, and post-ecommerce-parcel tracking is enhancing the shopping experience and increasing conversion rates for brands. Despite the initial vehicle costs, the competitive distinction offered by same-day delivery services is expected to outweigh the expenses In the long run.
What challenges does the US Same-Day Delivery Market face during the growth?
Established players increasingly adopting in-house delivery networks is a key challenge affecting the market growth.
- Same-day delivery has become a crucial aspect of customer satisfaction in the US e-commerce market, particularly for impulsive purchases and time-sensitive items. Sole traders and large retailers alike are investing in this shipping model to enhance customer experience, boost customer loyalty, and reduce cart abandonment. However, the challenges of managing vehicle costs and temperature-controlled vehicles for specific product categories can hinder smaller businesses. Technological advances, including AI and machine learning, are streamlining the delivery process, enabling real-time shipment tracking and postcode-specific delivery.
- E-commerce platforms and brick-and-mortar stores are expanding their composite delivery infrastructure, offering domestic and international B2C transactions through digital streaming, cloud computing, and express freight services. The digitization of shopping experiences, facilitated by smartphones and tablets with internet access, is driving e-commerce adoption, making same-day delivery a competitive distinction for brands. Medical supplies and temperature-sensitive specimens require specialized handling, leading to acquisitions and expansion plans for businesses in this sector.
Exclusive Customer Landscape
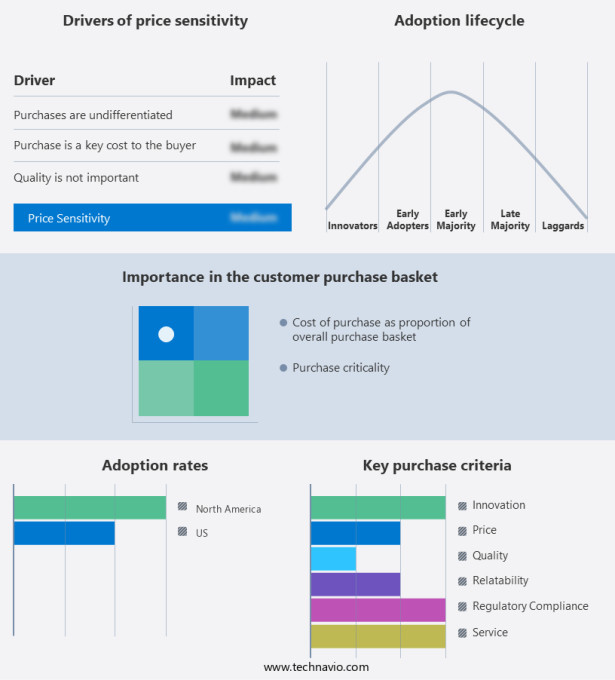
The market forecasting report includes the adoption lifecycle of the market, covering from the innovator's stage to the laggard's stage. It focuses on adoption rates in different regions based on penetration. Furthermore, the market report also includes key purchase criteria and drivers of price sensitivity to help companies evaluate and develop their market growth analysis strategies.
Customer Landscape
Key Companies & Market Insights
Companies are implementing various strategies, such as strategic alliances, market forecast, partnerships, mergers and acquisitions, geographical expansion, and product/service launches, to enhance their presence In the market.
Courier Express - The company offers same-day delivery services such as scheduled services and dedicated services.
The market research and growth report includes detailed analyses of the competitive landscape of the market and information about key companies, including:
- Deutsche Post AG
- FedEx Corp.
- Greenwich Logistics LLC
- Last Mile Logistics
- Power Link Expedite Corp.
- Target Corp.
- United Parcel Service Inc.
- USA Couriers
- Zipline International Inc.
Qualitative and quantitative analysis of companies has been conducted to help clients understand the wider business environment as well as the strengths and weaknesses of key market players. Data is qualitatively analyzed to categorize companies as pure play, category-focused, industry-focused, and diversified; it is quantitatively analyzed to categorize companies as dominant, leading, strong, tentative, and weak.
Research Analyst Overview
The market has experienced significant growth in recent years, driven by the increasing popularity of e-commerce and the widespread use of smartphones and tablets for online shopping. With more consumers relying on the internet for purchases, the need for swift and efficient delivery has become a key differentiator for online businesses. Customer satisfaction is a critical factor In the success of same-day delivery models. The convenience of receiving orders on the same day they are placed builds customer confidence and loyalty. However, the cost of implementing and maintaining a same-day delivery infrastructure can be substantial. Vehicle costs, fuel expenses, and labor wages are just a few of the expenses that must be considered.
Further, the digitization of businesses and the adoption of e-commerce platforms have made same-day delivery a viable option for a wide range of industries. From online retailers selling stationery supplies to medical suppliers delivering temperature-controlled vehicles for the transport of specimens, same-day delivery has become an essential component of the shopping experience. Technological advances, such as AI and machine learning, have also played a role In the growth of same-day delivery. These technologies enable more efficient order processing, real-time shipment tracking, and postcode-specific delivery routing. Additionally, the integration of digital streaming and cloud computing into delivery operations has streamlined processes and improved overall efficiency.
Moreover, the competitive distinction of same-day delivery has become increasingly important for online businesses looking to differentiate themselves from competitors. Brands that can offer fast and reliable delivery have seen higher conversion rates and increased customer loyalty. Furthermore, the ability to make impulsive purchases without the fear of long shipping times has led to a decrease in cart abandonment. The same-day delivery market is not limited to domestic transactions. International same-day delivery is also gaining traction, with express freight services and postal services expanding their offerings to meet the demands of global consumers. As the same-day delivery market continues to evolve, businesses are exploring acquisitions and expansion plans to stay competitive.
|
Market Scope |
|
|
Report Coverage |
Details |
|
Page number |
140 |
|
Base year |
2024 |
|
Historic period |
2019-2023 |
|
Forecast period |
2025-2029 |
|
Growth momentum & CAGR |
Accelerate at a CAGR of 25.4% |
|
Market Growth 2025-2029 |
USD 28.28 billion |
|
Market structure |
Concentrated |
|
YoY growth 2024-2025(%) |
22.5 |
|
Competitive landscape |
Leading Companies, Market Positioning of Companies, Competitive Strategies, and Industry Risks |
What are the Key Data Covered in this Market Research and Growth Report?
- CAGR of the market during the forecast period
- Detailed information on factors that will drive the market growth and forecasting between 2025 and 2029
- Precise estimation of the size of the market and its contribution of the market in focus to the parent market
- Accurate predictions about upcoming market growth and trends and changes in consumer behaviour
- Growth of the market across US
- Thorough analysis of the market's competitive landscape and detailed information about companies
- Comprehensive analysis of factors that will challenge the growth of market companies
We can help! Our analysts can customize this market research report to meet your requirements.