
Sandalwood Oil Market Size 2025-2029
The sandalwood oil market size is valued to increase USD 746.2 million, at a CAGR of 7.4% from 2024 to 2029. Numerous health benefits offered by sandalwood oil will drive the sandalwood oil market.
Major Market Trends & Insights
- APAC dominated the market and accounted for a 72% growth during the forecast period.
- By Type - Indian sandalwood oil segment was valued at USD 1134.20 million in 2023
- By Product - Natural segment accounted for the largest market revenue share in 2023
Market Size & Forecast
- Market Opportunities: USD 71.18 million
- Market Future Opportunities: USD 746.20 million
- CAGR : 7.4%
- APAC: Largest market in 2023
Market Summary
- The market encompasses the production, distribution, and consumption of this prized essential oil derived from the heartwood of the Santalum tree. This market is characterized by its continuous evolution, driven by the increasing popularity of sandalwood oil in core applications such as perfumes, cosmetics, and aromatherapy. The global aromatherapy market, a significant end-user industry, is projected to reach a value of USD12.8 billion by 2027, presenting a substantial growth opportunity for sandalwood oil producers. However, the high price of sandalwood, primarily due to its limited availability and labor-intensive extraction process, poses a significant challenge. Despite this, the market is fueled by the numerous health benefits associated with sandalwood oil, including its antiseptic, anti-inflammatory, and calming properties.
- As regulatory bodies continue to recognize these benefits, the market is expected to expand further, with Asia Pacific emerging as a key regional player due to its large population and cultural affinity for traditional medicinal practices.
What will be the Size of the Sandalwood Oil Market during the forecast period?

Get Key Insights on Market Forecast (PDF) Request Free Sample
How is the Sandalwood Oil Market Segmented and what are the key trends of market segmentation?
The sandalwood oil industry research report provides comprehensive data (region-wise segment analysis), with forecasts and estimates in "USD million" for the period 2025-2029, as well as historical data from 2019-2023 for the following segments.
- Type
- Indian sandalwood oil
- Australian sandalwood oil
- Others
- Product
- Natural
- Lab created
- Application
- Cosmetics and personal care
- Pharmaceuticals
- Aromatherapy
- Household or retail
- Geography
- North America
- US
- Canada
- Europe
- France
- Germany
- APAC
- Australia
- China
- India
- Japan
- South Korea
- South America
- Brazil
- Rest of World (ROW)
- North America
By Type Insights
The indian sandalwood oil segment is estimated to witness significant growth during the forecast period.
Sandalwood oil, derived from the heartwood of the Indian sandalwood tree, is a valuable commodity in the global market. Traditional uses of sandalwood oil span across various sectors, including perfume ingredient sourcing for high-end fragrances and traditional medicine. The market is witnessing significant growth due to increasing demand from the pharmaceuticals and personal care industries. Indian sandalwood essential oil, primarily sourced from trees grown in Mysore, Karnataka, India, is renowned for its high-quality. The production process involves steam distillation, which optimizes oil yield while preserving the oil's authenticity. Quality control parameters and authenticity verification methods ensure the purity and consistency of the oil.
Sandalwood oil's natural antimicrobial activity and wood oil composition contribute to its popularity in skincare product formulation. Natural fragrance oils and aromatherapy benefits further expand its applications. The essential oil extraction process involves careful aroma compound profiling and sensory evaluation methods to ensure the highest quality. Adulteration detection methods, such as terpenoid biosynthesis analysis, mass spectrometry, and gas chromatography, are essential for maintaining the integrity of the oil. Sustainable harvesting practices, international trade regulations, and plant-based fragrance trends are shaping the market's future. The market is expected to grow by 15.3% in the next year, with a further 17.6% expansion anticipated over the following five years.
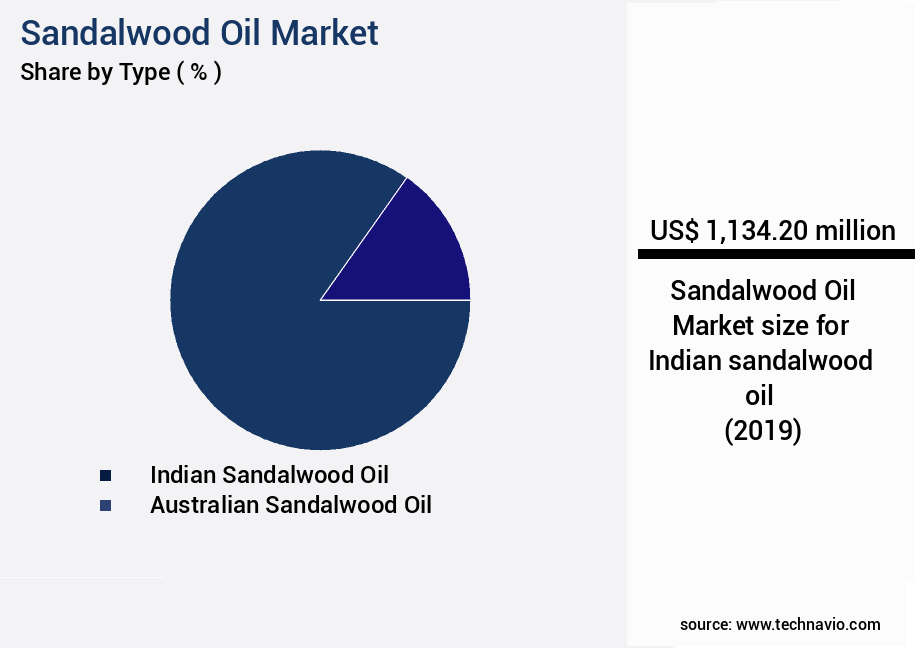
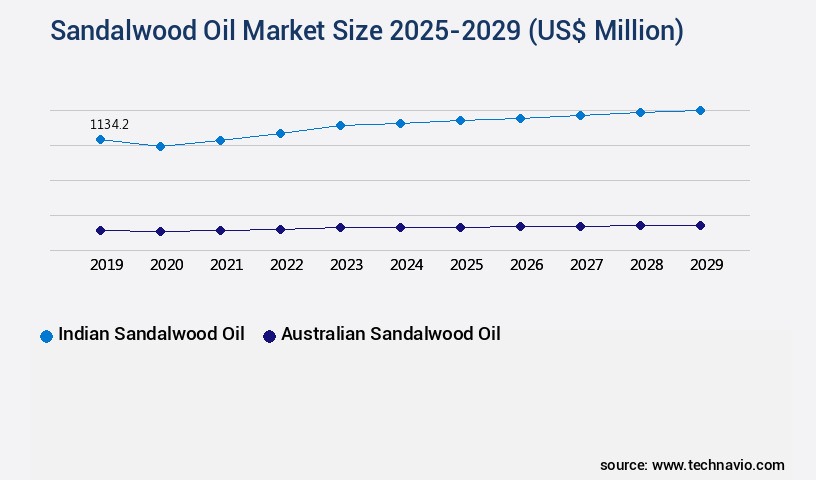
The Indian sandalwood oil segment was valued at USD 1134.20 million in 2019 and showed a gradual increase during the forecast period.
The industry's continuous evolution includes advancements in distillation efficiency, quality assurance testing, oil storage methods, and therapeutic aromatherapy applications. The market's growth is driven by the increasing demand for natural fragrances and essential oils, as well as the stress reduction properties and anti-inflammatory effects associated with sandalwood oil. The market's ongoing unfolding includes advancements in sensory evaluation methods, chemical component analysis, and wood processing techniques to optimize oil yield and improve product quality.
Regional Analysis
APAC is estimated to contribute 72% to the growth of the global market during the forecast period. Technavio's analysts have elaborately explained the regional trends and drivers that shape the market during the forecast period.

See How Sandalwood Oil Market Demand is Rising in APAC Request Free Sample
The market in the Asia Pacific (APAC) region is experiencing consistent expansion due to the expanding utilization of sandalwood oil in pharmaceuticals, cosmetics, furniture, and aromatherapy industries, primarily in China and India. India, Australia, China, and Indonesia are the primary producers and consumers of sandalwood oil in APAC. Between 2011 and 2021, India's sandalwood production saw a significant surge of approximately 69%. Favorable economic conditions are anticipated to fuel the regional market's growth during the forecast period.
China, India, and Indonesia are the key emerging economies driving the market's rapid expansion.
Market Dynamics
Our researchers analyzed the data with 2024 as the base year, along with the key drivers, trends, and challenges. A holistic analysis of drivers will help companies refine their marketing strategies to gain a competitive advantage.
The market is a significant sector in the fragrance and aroma industry, with steam distillation of sandalwood heartwood serving as the primary extraction method. The extracted oil undergoes rigorous analysis through techniques such as gas chromatography-mass spectrometry to identify and quantify santalols, the key aroma compounds. Optimization of sandalwood oil extraction yield is a critical focus to ensure sustainable harvesting and reforestation, as the demand for high-quality sandalwood oil continues to grow. Sensory evaluation of sandalwood oil quality parameters plays a crucial role in determining consumer preferences and market trends. Impact of storage conditions on sandalwood oil stability is a key concern, as improper storage can lead to oxidation and loss of aroma.
Sustainable harvesting practices and the correlation between santalol content and sensory attributes are essential considerations for producers and consumers alike. Adulterants in commercial sandalwood oil pose a significant challenge, necessitating analysis to maintain authenticity and quality. Processing methods significantly influence sandalwood oil quality, with various methods producing different grades and chemical compositions. Development of sandalwood oil-based cosmetic products and evaluation of their aromatherapy benefits further expand the market's scope. Comparing the industrial and academic sectors, the former accounts for a significantly larger share in the market. This is due to the increased demand for sandalwood oil in various applications, including perfumes, cosmetics, and traditional medicine.
The economic feasibility of sustainable sandalwood production is a pressing concern, with quality control standards for sandalwood oil in cosmetics playing a vital role in ensuring consumer safety and brand reputation. In conclusion, the market is a dynamic and complex sector, with various factors influencing its trends and growth. Understanding the optimization of sandalwood oil extraction yield, sensory evaluation of quality parameters, impact of storage conditions, sustainable harvesting practices, and the correlation between santalol content and sensory attributes are essential for market participants to stay competitive and succeed in this market.
What are the key market drivers leading to the rise in the adoption of Sandalwood Oil Industry?
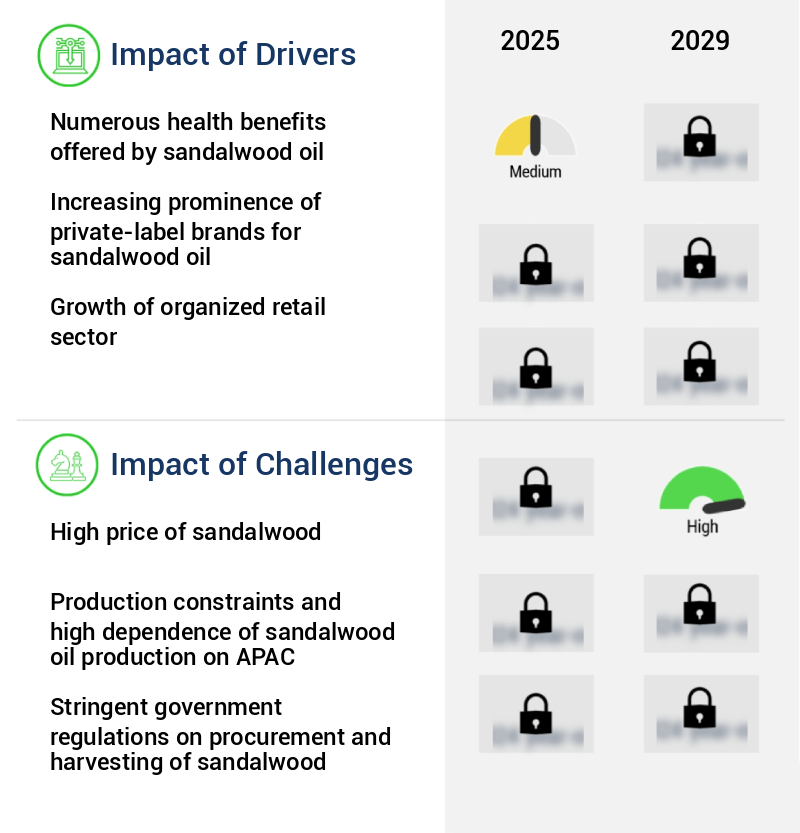
- Sandalwood oil's extensive health benefits serve as the primary market driver, attracting a substantial consumer base.
- Sandalwood oil, a prized essential oil, offers a myriad of therapeutic benefits. With antiseptic, anti-inflammatory, diuretic, antispasmodic, cicatrisant, and astringent properties, it serves various applications. Internally, sandalwood oil safeguards wounds and ulcers from infections, while externally, it shields against infection and sepsis on cuts, boils, sores, and pimples. As an anti-inflammatory agent, it alleviates inflammation in the brain and multiple systems, including digestive, nervous, circulatory, and excretory.
- The oil's cooling effect provides relief and promotes healing. Sandalwood oil's therapeutic uses extend beyond these properties. It functions as a carminative, disinfectant, emollient, expectorant, hypotensive agent, memory booster, and sedative. This versatile essential oil continues to gain popularity across various sectors, contributing to its evolving market presence.
What are the market trends shaping the Sandalwood Oil Industry?
- The increasing popularity of aromatherapy signifies a notable market trend. Aromatherapy's demand continues to rise, representing a significant market development.
- Sandalwood oil, a highly sought-after essential oil, is renowned for its therapeutic properties on the skin and its applications in aromatherapy. Suitable for all skin types, sandalwood oil's popularity lies in its versatility. In aromatherapy and massage therapy, it functions as a carrier oil. This essential oil offers numerous health benefits, including alleviating depression and anxiety, boosting energy levels, enhancing cognitive performance, and eliminating headaches. It also aids in the healing process, induces sleep, strengthens the immune system, reduces pain, improves digestion, and increases blood circulation.
- India, China, Japan, France, the UK, and the US are prominent countries that have embraced aromatherapy, with sandalwood oil being a key component. The global aromatherapy market is a dynamic and evolving sector, continually expanding its reach across various industries, including wellness, healthcare, and personal care.
What challenges does the Sandalwood Oil Industry face during its growth?
- The escalating cost of sandalwood poses a significant challenge to the expansion and growth of the industry.
- Sandalwood products have gained significant popularity in various industries due to their distinct aroma and therapeutic properties. However, the high price point of these products can be attributed to the decreasing production of sandalwood in the last two decades. The complex production process of extracting sandalwood oil from mature trees contributes to its exorbitant cost. In 2020, the price of sandalwood oil surpassed USD 2,000 per kg, with no signs of decline in the near future. Indian sandalwood, renowned for its superior quality, is primarily sourced from the southern regions of India, specifically Mysore in Karnataka and the Marayoor forests in Kerala.
- The demand for high-quality sandalwood oil remains high in the perfume, cosmetics, and aromatherapy industries, driving up the price and reinforcing its exclusivity.
Exclusive Technavio Analysis on Customer Landscape
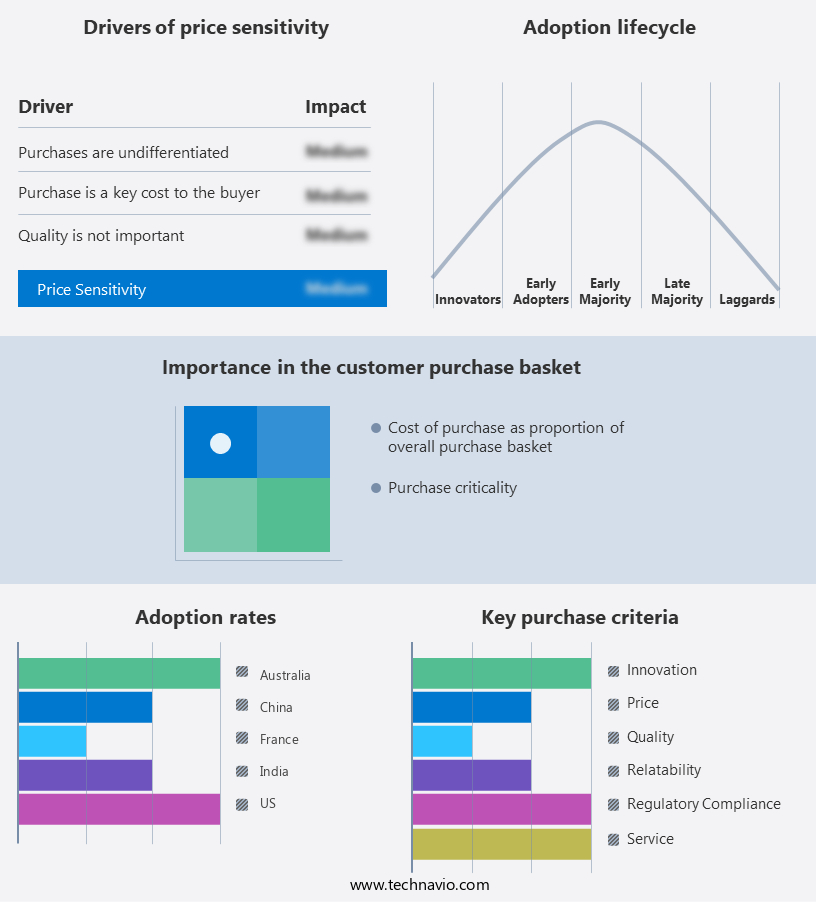
The sandalwood oil market forecasting report includes the adoption lifecycle of the market, covering from the innovator's stage to the laggard's stage. It focuses on adoption rates in different regions based on penetration. Furthermore, the sandalwood oil market report also includes key purchase criteria and drivers of price sensitivity to help companies evaluate and develop their market growth analysis strategies.
Customer Landscape of Sandalwood Oil Industry
Competitive Landscape
Companies are implementing various strategies, such as strategic alliances, sandalwood oil market forecast, partnerships, mergers and acquisitions, geographical expansion, and product/service launches, to enhance their presence in the industry.
Aditi Essentials - This company specializes in providing a range of sandalwood oil products, including Mysore sandalwood oil and sandalwood oil blended with jojoba at a 3% concentration, as well as sandalwood fragrance oil.
The industry research and growth report includes detailed analyses of the competitive landscape of the market and information about key companies, including:
- Aditi Essentials
- Avi Naturals
- BASF SE
- Blossom Kochhar Beauty Products Pvt. Ltd.
- Cliara Essential Oils
- doTERRA International LLC
- Eden Botanicals
- Essentially Australia
- Givaudan SA
- Kanta Enterprises Pvt. Ltd.
- Karnataka Soaps and Detergents
- Katyani Exports
- Khadi Natural
- MEENA PERFUMERY
- PerfumersWorld Ltd.
- Plant Therapy
- Quintis (Australia) Pty Ltd.
- R. K. Essential Oils Co.
- Santanol Group
- Vedic Vaani
Qualitative and quantitative analysis of companies has been conducted to help clients understand the wider business environment as well as the strengths and weaknesses of key industry players. Data is qualitatively analyzed to categorize companies as pure play, category-focused, industry-focused, and diversified; it is quantitatively analyzed to categorize companies as dominant, leading, strong, tentative, and weak.
Recent Development and News in Sandalwood Oil Market
- In January 2024, international perfume and cosmetics giant, Estée Lauder Companies, announced the launch of a new fragrance line, "Amber Sands," featuring sandalwood oil as its primary ingredient (Estée Lauder Companies Press Release, 2024). This strategic move signified a significant expansion of the company's product offerings, catering to the growing demand for natural and sustainable fragrances.
- In March 2024, Indian essential oils manufacturer, D.G. Organics, entered into a partnership with French luxury goods conglomerate, LVMH Moët Hennessy – Fashion & Leather Goods, to secure a long-term supply of high-quality sandalwood oil (LVMH Moët Hennessy Press Release, 2024). This collaboration aimed to ensure a consistent and sustainable supply chain for LVMH's luxury brands, addressing concerns regarding the dwindling sandalwood forests and the subsequent price volatility.
- In May 2024, Indian Sandalwood Oil Producers Association (ISOPA) received approval from the Indian government to establish a Sandalwood Oil Processing and Marketing Corporation (SOPMC) (ISOPA Press Release, 2024). This initiative aimed to streamline the sandalwood oil production and marketing process, ensuring better pricing for farmers and improved product quality for consumers.
- In April 2025, Australian essential oils producer, AromaWise, completed the acquisition of a 50% stake in Indian sandalwood oil producer, Sahajanand Enterprises, marking its entry into the Indian the market (AromaWise Press Release, 2025). This strategic move expanded AromaWise's global footprint and provided it with access to a larger customer base and increased production capacity.
Dive into Technavio's robust research methodology, blending expert interviews, extensive data synthesis, and validated models for unparalleled Sandalwood Oil Market insights. See full methodology.
|
Market Scope |
|
|
Report Coverage |
Details |
|
Page number |
220 |
|
Base year |
2024 |
|
Historic period |
2019-2023 |
|
Forecast period |
2025-2029 |
|
Growth momentum & CAGR |
Accelerate at a CAGR of 7.4% |
|
Market growth 2025-2029 |
USD 746.2 million |
|
Market structure |
Fragmented |
|
YoY growth 2024-2025(%) |
6.8 |
|
Key countries |
China, US, India, Australia, Japan, South Korea, Canada, France, Brazil, and Germany |
|
Competitive landscape |
Leading Companies, Market Positioning of Companies, Competitive Strategies, and Industry Risks |
Research Analyst Overview
- In the dynamic and evolving world of natural fragrances, sandalwood oil continues to hold a significant place, with its usage extending beyond traditional medicine and into perfume ingredient sourcing. The quality control parameters for sandalwood oil are stringent, with authenticity verification being a crucial aspect due to its high demand and potential for adulteration. The antimicrobial activity of sandalwood oil is a key factor driving its adoption, with numerous studies highlighting its potential benefits. The wood oil composition is complex, consisting of various aroma compounds, terpenoids, and alpha-santalol content, which undergo chemical component analysis during essential oil extraction.
- Sustainable harvesting practices are increasingly important in the market, with the focus shifting towards optimizing oil yield while ensuring the health of the trees. The steam distillation process is commonly used for oil extraction, with aromatherapy benefits including stress reduction and anti-inflammatory effects. Fragrance and perfume industries rely on sandalwood oil for its unique aroma profile, with sensory evaluation methods and mass spectrometry analysis used to ensure consistency and quality. The international trade regulations governing sandalwood oil are complex, requiring quality assurance testing and oil storage methods that maintain the oil's integrity. The skincare product formulation industry also utilizes sandalwood oil, with its sensory properties and therapeutic benefits making it a popular choice.
- The sandalwood oil grade and cosmetic application vary, with different isomers and terpenoids contributing to its unique characteristics. Sandalwood oil pricing is influenced by various factors, including distillation efficiency, alpha-santalol content, and market dynamics. Ongoing research focuses on terpenoid biosynthesis, adulteration detection, and wood processing techniques to improve the sustainability and efficiency of sandalwood oil production.
What are the Key Data Covered in this Sandalwood Oil Market Research and Growth Report?
-
What is the expected growth of the Sandalwood Oil Market between 2025 and 2029?
-
USD 746.2 million, at a CAGR of 7.4%
-
-
What segmentation does the market report cover?
-
The report segmented by Type (Indian sandalwood oil, Australian sandalwood oil, and Others), Product (Natural and Lab created), Application (Cosmetics and personal care, Pharmaceuticals, Aromatherapy, and Household or retail), and Geography (APAC, North America, Europe, South America, and Middle East and Africa)
-
-
Which regions are analyzed in the report?
-
APAC, North America, Europe, South America, and Middle East and Africa
-
-
What are the key growth drivers and market challenges?
-
Numerous health benefits offered by sandalwood oil, High price of sandalwood
-
-
Who are the major players in the Sandalwood Oil Market?
-
Key Companies Aditi Essentials, Avi Naturals, BASF SE, Blossom Kochhar Beauty Products Pvt. Ltd., Cliara Essential Oils, doTERRA International LLC, Eden Botanicals, Essentially Australia, Givaudan SA, Kanta Enterprises Pvt. Ltd., Karnataka Soaps and Detergents, Katyani Exports, Khadi Natural, MEENA PERFUMERY, PerfumersWorld Ltd., Plant Therapy, Quintis (Australia) Pty Ltd., R. K. Essential Oils Co., Santanol Group, and Vedic Vaani
-
Market Research Insights
- The market encompasses the production, trade, and consumption of this valuable essential oil derived from the heartwood and sapwood of various species of the Santalum genus. The global market for sandalwood oil exhibits significant growth, with an estimated annual production of 1,500 metric tons and a market value of approximately USD 2 billion. The primary drivers of this growth include increasing consumer preference for natural fragrances, high product performance, and shelf life stability. The economic value estimation of sandalwood oil is influenced by several factors, including manufacturing processes, reforestation efforts, and sustainable forestry. For instance, the traditional sapwood extraction method, which involves crushing the wood and using water for extraction, yields a lower concentration of santalol (the primary aroma compound) compared to the hydrodistillation method, which uses steam to extract the oil.
- The hydrodistillation method results in a higher santalol concentration, leading to a more valuable product. However, the environmental impact assessment of sandalwood oil production is a critical consideration, as overexploitation of natural resources and unsustainable harvesting practices have led to concerns regarding the long-term availability of this valuable resource. Market demand forecasts suggest that sustainable forestry practices, regulatory compliance, and supply chain management will play a crucial role in ensuring the long-term viability of the market.
We can help! Our analysts can customize this sandalwood oil market research report to meet your requirements.
 RIA -
RIA - 
